Kentik Blog: Product


Knowing something is broken is easy. Figuring out why is hard. Introducing three new, native AI diagnostic capabilities in the Kentik Network Intelligence Platform to accelerate root cause analysis and keep your network running better.
Generic AI fails in network operations because it lacks the “institutional knowledge” of your specific environment and business priorities. Learn how Kentik’s Custom Network Context encodes your unique operational reality into AI Advisor, turning a generic chatbot into a context-aware teammate.
Kentik AI Runbooks are machine-readable instructions that codify tribal knowledge into specific diagnostic workflows. By guiding AI Advisor’s reasoning and tool selection, Runbooks turn alerts into actionable, automated investigations, dramatically accelerating MTTR.
Introducing Cause Analysis from Kentik, designed to simplify network traffic analysis and rapidly identify the root cause of issues. Learn how this exciting new feature streamlines troubleshooting, makes complex insights accessible, and boosts team efficiency for all users.
Kentik and ServiceNow are teaming up to bring network intelligence to the ServiceNow® AI Platform. This integration enables ServiceNow ITOM customers, even those without deep network expertise, to answer questions about connectivity, performance, and more.
Today, we’re excited to launch Cloud Pathfinder, an AI-powered path assessment service built into Kentik Journeys. Read on to learn how Cloud Pathfinder gives you instant, turn-by-turn insight into cloud routing—mapping out every hop, gateway, VPC/VNet, and attachment along the way.
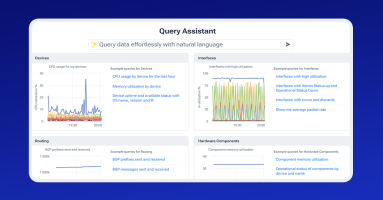
In this post, discover how Kentik Journeys integrates large language models to revolutionize network observability. By enabling anyone in IT to query and analyze network telemetry in plain language, regardless of technical expertise, Kentik breaks down silos and democratizes access to critical insights simplifying complex workflows, enhancing collaboration, and ensuring secure, real-time access to your network data.
When network issues strike, every second matters. Latency or packet loss can frustrate users and hurt revenue. Learn how Kentik AI uses natural language to speed up troubleshooting and isolate problems quickly.
Balancing cost efficiency and high performance in cloud networks is a constant challenge, especially when misconfigurations or inefficient routing lead to inflated costs or degraded performance. Learn how Kentik Journeys simplifies traffic analysis, helping cloud engineers identify inefficiencies like unnecessary Transit Gateway routing.
Kentik Journeys is an AI-powered user experience that helps you investigate your network. It combines knowledge about your network with deep GenAI integration to help you answer network questions and solve problems faster than ever. Since launch, we’ve been innovating on Journeys’ capabilities and skills with customer feedback. Here’s a peek at what’s new.
We’re excited to announce a new collaboration between Kentik and Red Hat. This partnership will enable organizations to enhance network monitoring and management by integrating network observability with open-source automation tools.
The time has come to switch to your new network monitoring solution. Remember, if an alert, report, ticket, or notification does not spark joy, get rid of it. We’ll cover how to spin up Kentik NMS and ensure you’re ready to sunset your old solution for good.
NMS can do so much that one blog topic triggered an idea for another, and another, and here we are, six posts later and I haven’t explained how to install NMS yet. The time for that post has come.
Leon takes a look at how to further modify SNMP metrics in Kentik NMS. Because sometimes, you want to modify data before displaying it in your network monitoring system. Ready? Let’s get mathy with it!
Kentik NMS has the ability to collect multiple SNMP objects (OIDs). Whether they are multiple unrelated OIDs, or multiple elements within a related table, Leon Adato walks you through the steps to get the data out of your devices and into your Kentik portal.
Kentik NMS collects valuable network data and then transforms it into usable information — information you can use to drive action.
Out of the gate, NMS collects an impressive array of metrics and telemetry. But there will always be bits that need to be added. This brings me to the topic of today’s blog post: How to configure NMS to collect a custom SNMP metric.
While many wifi access points and SD-WAN controllers have a rich data set available via their APIs, most do not support exporting this data via SNMP or streaming telemetry. In this post, Justin Ryburn walks you through configuring Telegraf to feed API JSON data into Kentik NMS.
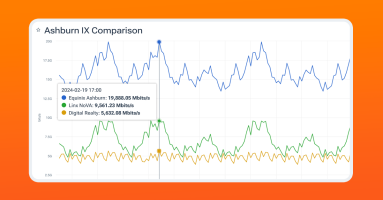
Kentik users can now correlate their traffic data with internet exchanges (IXes) and data centers worldwide, even ones they are not a member of – giving them instant answers for better informed peering decisions and interconnection strategies that reduce costs and improve performance.
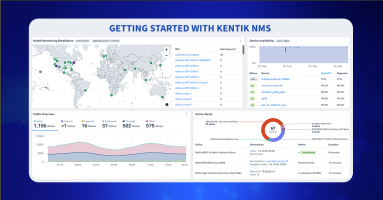
Kentik NMS is here to provide better network performance monitoring and observability. Read how to get started, from installation and configuration to a brief tour of what you can expect from Kentik’s new network monitoring solution.
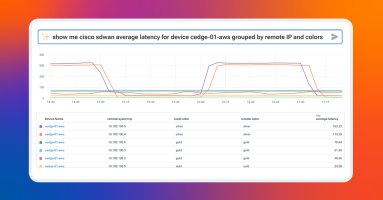
Kentik Journeys uses an AI-based, large language model to explore data from your network and troubleshoot problems in real time. Using natural language queries, Kentik Journeys is a huge step forward in leveraging AI to democratize data and make it simple for any engineer at any level to analyze network telemetry at scale.
We’re bringing AI to network monitoring and observability. And adding new products to Kentik, including a modern NMS, to simplify troubleshooting complex networks.
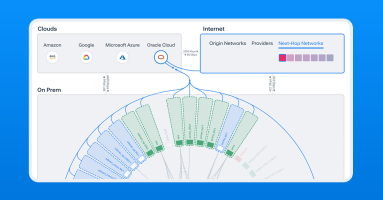
Kentik now provides network insight into Oracle Cloud Infrastructure (OCI) workloads, allowing customers to map, query, and visualize OCI, hybrid, and multi-cloud traffic and performance.
Peering evaluations are now so much easier. PeeringDB, the database of networks and the go-to location for interconnection data, is now integrated into Kentik and available to all Kentik customers at no additional cost.
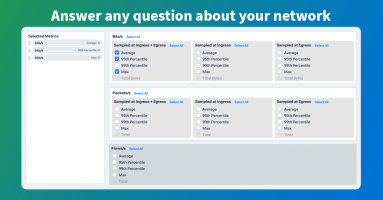
A cornerstone of network observability is the ability to ask any question of your network. In this post, we’ll look at the Kentik Data Explorer, the interface between an engineer and the vast database of telemetry within the Kentik platform. With the Data Explorer, an engineer can very quickly parse and filter the database in any manner and get back the results in almost any form.
We’re excited to announce our beta launch of Kentik Kube, an industry-first solution that reveals how K8s traffic routes through an organization’s data center, cloud, and the internet.
In part four of our series, you’ll learn how to find the right transit provider for your peering needs.
What fun is network observability if you can’t share what you see? Now you can with public link sharing from Kentik. See what’s new.
Kentik’s BGP monitoring capabilities address root-cause routing issues across BGP routes, BGP event tracking, hijack detection, and other BGP issues.
In part three of our series, you’ll see how to improve CDN and peering connectivity. Learn about peering policies and see how to use data to support your peering decisions.
In part two of our peering series, we look at performance. Read on to see how to understand the services used by your customers.
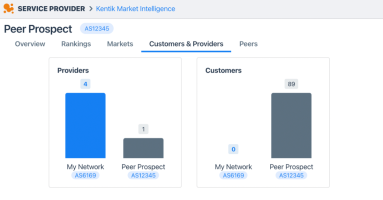
Just in time for Valentine’s Day, we’re announcing our newest labor of love: Kentik Market Intelligence (KMI), a new product that spells out the internet ecosystem.
In this blog series, we dive deep into the peering coordinator workflow and show how the right tools can help you be successful in your role. In part 1, we discuss the economics of connectivity.
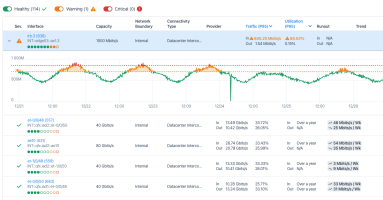
We’ve overhauled our Capacity Planning workflow. Read how our newest developments make capacity planning easier and more intuitive than ever.
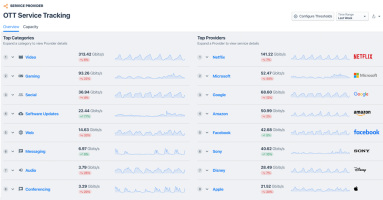
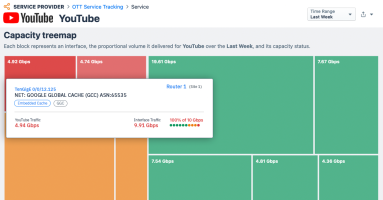
Today we’re introducing the most important update to OTT Service Tracking for ISPs since its inception. To understand the power of this workflow, we’ll review the basics of OTT service monitoring and explain why our capability is so popular with our broadband provider customers.
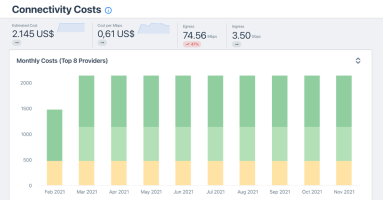
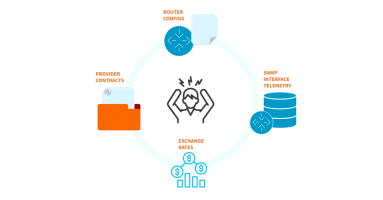
As today’s economy goes online, network costs can be a determinant factor to business success. Failure to strategize and optimize connectivity expenses will naturally result in a loss of competitiveness. Addressing customer needs, Kentik launched a new automated workflow to manage connectivity costs, timely instrument negotiations at contract term, and stay on top of optimization opportunities — all in Kentik’s user-friendly style.
My Kentik Portal, Kentik’s white-label network observability portal, is now available to all Kentik customers. We’ve lifted access restrictions, so you can take advantage of its features without complex activation. Plus you’ll find numerous enhancements based on interviews with existing users.
Kentik Firehose is a way for you to export enriched network traffic data from the Kentik Network Observability Platform. With Firehose, organizations can directly integrate network data into other analytic systems, message queues, time-series databases, or data lakes.
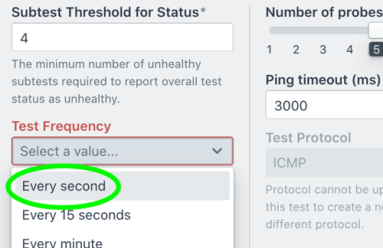
In this post, we show how Kentik Synthetic Monitoring supports high-frequency tests with sub-minute intervals, providing network teams with a tool that captures what’s happening in the network, including subtle degradations.
What is synthetic testing, and where do point solutions fail? In this blog post, Kentik Co-founder and CEO Avi Freedman discusses network performance testing and why Kentik designed an autonomous and affordable synthetic monitoring capability that is fully integrated into our network observability platform.
Kentik software engineer Will Glozer gives us a peek under the hood of Kentik’s new synthetic monitoring solution, explaining how and why Kentik used the Rust programming language to build its network monitoring agent.
Kentik’s Hybrid Map provides the industry’s first solution to visualize and manage interactions across public/private clouds, on-prem networks, SaaS apps, and other critical workloads as a means of delivering compelling, actionable intelligence. Product expert Dan Rohan has an overview.
Network capacity planning traditionally required a user to collect data from several tools, export all of the data, and then analyze it in a spreadsheet or database. In this post, we highlight Kentik’s latest platform capabilities to help understand, manage and automate capacity planning.
Today we announced an evolutionary leap forward for NetOps, solving for today’s biggest network challenge: effectively managing hybrid complexity and scale, at speed. In this post, Kentik CTO Jonah Kowall discusses what’s new with the latest release of the Kentik Platform.
Most DevOps teams use Grafana for reporting and data analysis for operational use cases spanning many monitoring systems. Grafana is a place these teams go to get answers to many questions. In this post, Kentik CTO Jonah Kowall discusses how Grafana became so popular and how the Kentik plugin for Grafana has new enhancements and features to help teams across the IT organization.
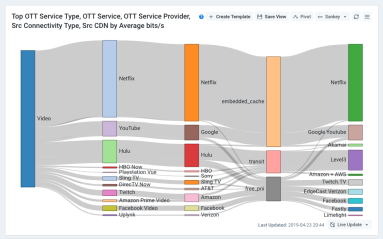
Kentik’s Greg Villain and Philip De Lancie explain the various benefits of True Origin™ and how ISPs can use it to see what content is most valuable to subscribers, how it impacts the network, and how to deliver a better subscriber experience. Includes a quick tutorial on setting up a Sankey chart to explore video traffic volumes.
If you are a service provider or enterprise providing your customers with traffic visibility into their networks, there are things you must consider. In this post, we will look into design considerations for self-service network analytics portals.
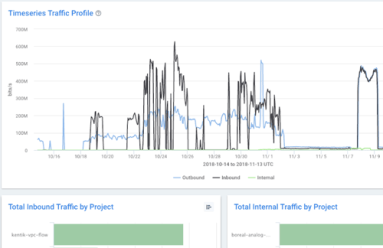
For NetOps and SecOps teams, alarms typically mean many more hours of work ahead. That doesn’t have to be the case. In this post, we look at how to troubleshoot an abnormal traffic spike and get to root cause in under five minutes.
“Wow!” moments don’t happen randomly. At Kentik, they reflect product value, differentiators, and the hard work of our engineering team. In this post, we look at a few of those moments when the insight delivered by Kentik made customers say, “Wow, that was amazing!”
If you work in this industry, chances are you use dashboards. But how do you build an effective dashboard that goes beyond pretty graphs and actually provides insight? In this post, we offer key principles for dashboard creation and share how we build them at Kentik, with examples of our dashboards for cloud monitoring.
Our network analytics platform supports visibility within public cloud environments via VPC Flow Logs. Our initial integration used VPC Flow Logs from Google Cloud Platform. Today, we are excited to extend our support to AWS. Read how we do it in this blog post.
During Networking Field Day 19, Kentik presented on new capabilities for service providers, cloud and cloud-native environments, and gave a technical talk on tagging and data enrichment. In this post, we recap the event highlights and provide the videos for watching and sharing.
We post a lot on our blog about our advanced network analytics platform, use cases, and the ROI we deliver to service providers and enterprises globally. However, today’s post is for our fellow programmers, as we go under Kentik’s hood to discuss Rust.
Real-time network data insights are not only important to the service provider. In this post, we discuss why service providers’ end-customers, who consume those services — subscribers, digital enterprise, hosting customers, etc., also need visibility.
Relentless traffic growth and a constant stream of new technologies, e.g. SDN and cloud interconnects, make it harder to understand how services traverse the network between application infrastructure and users or customers. In this post, we discuss how that led Kentik to build our BGP Ultimate Exit to help address traffic visibility challenges.
Service assurance and incident response are just one side of the network performance coin. What if you could use the same data to provide additional value to customers, and highlight the great service you provide? Today we announced the “My Kentik” portal to do just that. Read the details in this post.
VPC Flow Logs Blog Post: The migration of applications from traditional data centers to cloud infrastructure is well underway. In this post, we discuss Kentik’s new product expansion to support Google’s VPC Flow Logs.
We just published our first open source project on GitHub and npm. Called Mobx Form, in this blog post we look at how the project helps developers with coding complex forms.
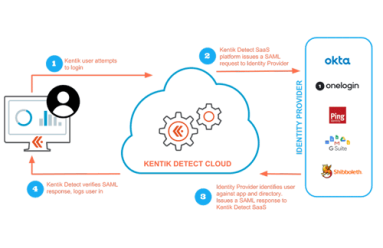
As security threats grow more ominous, security procedures grow more onerous, which can be a drag on productivity. In this post we look at how Kentik’s single sign-on (SSO) implementation enables users to maintain security without constantly entering authentication credentials. Check out this walk-through of the SSO setup and login process to enable your users to access Kentik Detect with the same SSO services they use for other applications.
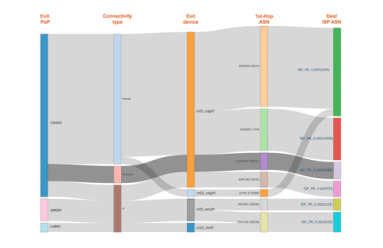
In our latest post on Interface Classification, we look beyond what it is and how it works to why it’s useful, illustrated with a few use cases that demonstrate its practical value. By segmenting traffic based on interface characteristics (Connectivity Type and Network Boundary), you’ll be able to easily see and export valuable intelligence related to the cost and ROI of carrying a given customer’s traffic.
Kentik addresses the day-to-day challenges of network operations, but our unique big network data platform also generates valuable business insights. A great example of this duality is our new Interface Classification feature, which streamlines an otherwise-tedious technical task while also giving sales teams a real competitive advantage. In this post we look at what it can do, how we’ve implemented it, and how to get started.
Can BGP routing tables provide actionable insights for both engineering and sales? Kentik Detect correlates BGP with flow records like NetFlow to deliver advanced analytics that unlock valuable knowledge hiding in your routes. In this post, we look at our Peering Analytics feature, which lets you see whether your traffic is taking the most cost-effective and performant routes to get where it’s going, including who you should be peering with to reduce transit costs.
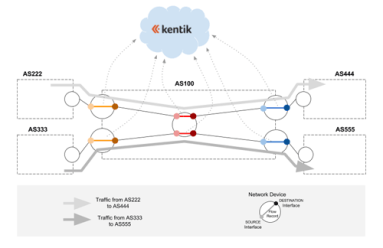
Without package tracking, FedEx wouldn’t know how directly a package got to its destination or how to improve service and efficiency. 25 years into the commercial Internet, most service providers find themselves in just that situation, with no easy way to tell where an individual customer’s traffic exited the network. With Kentik Detect’s new Ultimate Exit feature, those days are over. Learn how Kentik’s per-customer traffic breakdown gives providers a competitive edge.
While Kentik Detect’s ground-breaking DDoS detection is field-proven to catch 30% more attacks than legacy systems, our DDoS capabilities aren’t limited to standalone detection. We’re also actively working with leading mitigation providers to create end-to-end DDoS protection solutions. So we’re excited to be partnering with A10 Networks, whose products help defend some of the largest networks in the world, to enable seamless integration of Kentik Detect with A10 Thunder TPS mitigation.
Unless you’re a Tier 1 provider, IP transit is a significant cost of providing Internet service or operating a digital business. To minimize the pain, your network monitoring tools would ideally show you historical route utilization and notify you before the traffic volume on any path triggers added fees. In this post we look at how Kentik Detect is able to do just that, and we show how our Data Explorer is used to drill down on the details of route utilization.
Earlier this year the folks over at RouterFreak did a very thorough review of Kentik Detect. We really respected their thoroughness and the fact that they are practicing network engineers, so as we’ve come up with cool new gizmos in our product, we’ve asked them to extend their review. This post highlights some excerpts from their latest review, with particular focus on Kentik NPM, our enhanced network performance monitoring solution.
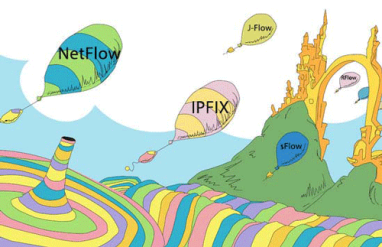
“NetFlow” may be the most common short-hand term for network flow data, but that doesn’t mean it’s the only important flow protocol. In fact there are three primary flavors of flow data — NetFlow, sFlow, and IPFIX — as well as a variety of brand-specific names used by various networking vendors. To help clear up any confusion, this post looks at the main flow-data protocols supported by Kentik Detect.
Destination-based Remotely Triggered Black-Hole routing (RTBH) is an incredibly effective and very cost-effective method of protecting your network during a DDoS attack. And with Kentik’s advanced Alerting system, automated RTBH is also relatively simple to configure. In this post, Kentik Customer Success Engineer Dan Rohan guides us through the process step by step.
Network performance is mission-critical for digital business, but traditional NPM tools provide only a limited, siloed view of how performance impacts application quality and user experience. Solutions Engineer Eric Graham explains how Kentik NPM uses lightweight distributed host agents to integrate performance metrics into Kentik Detect, enabling real-time performance monitoring and response without expensive centralized appliances.
In our second post related to BrightTalk videos recorded with Kentik at Cisco Live 2016, Kentik CEO Avi Freedman talks about the increasing threats that digital businesses face from DDoS and other forms of attacks and service interruptions. Avi also discusses the attributes that are required or desirable in a network visibility solution in order to effectively protect a network.
Cisco Live 2016 gave us a chance to meet with BrightTalk for some video-recorded discussions on hot topics in network operations. This post focuses on the first of those videos, in which Kentik’s Jim Frey, VP Strategic Alliances, talks about the complexity of today’s networks and how Big Data NetFlow analysis helps operators achieve timely insight into their traffic.
It was a blast taking part in our first ever Networking Field Day (NFD12), presenting our advanced and powerful network traffic analysis solution. Being at NFD12 gave us the opportunity to get valuable response and feedback from a set of knowledgeable network nerd and blogger delegates. See what they had to say about Kentik Detect…
BGP used to be primarily of interest only to ISPs and hosting providers, but it’s become something with which all network engineers should get familiar. In this conclusion to our four-part BGP tutorial series, we fill in a few more pieces of the puzzle, including when — and when not — it makes sense to advertise your routes to a service provider using BGP.
In this post we continue our look at BGP — the protocol used to route traffic across the interconnected Autonomous Systems (AS) that make up the Internet — by clarifying the difference between eBGP and iBGP and then starting to dig into the basics of actual BGP configuration. We’ll see how to establish peering connections with neighbors and to return a list of current sessions with useful information about each.
BGP is the protocol used to route traffic across the interconnected Autonomous Systems (AS) that make up the Internet, making effective BGP configuration an important part of controlling your network’s destiny. In this post we build on the basics covered in Part 1, covering additional concepts, looking at when the use of BGP is called for, and digging deeper into how BGP can help — or, if misconfigured, hinder — the efficient delivery of traffic to its destination.
In most digital businesses, network traffic data is everywhere, but legacy limitations on collection, storage, and analysis mean that the value of that data goes largely untapped. Kentik solves that problem with post-Hadoop Big Data analytics, giving network and operations teams the insights they need to boost performance and implement innovation. In this post we look at how the right tools for digging enable organizations to uncover the value that’s lying just beneath the surface.
The network data collected by Kentik Detect isn’t limited to portal-only access; it can also be queried via SQL client or using Kentik’s RESTful APIs. In this how-to, we look how service providers can use our Data Explorer API to integrate traffic graphs into a customer portal, creating added-value content that can differentiate a provider from its competitors while keeping customers committed and engaged.
In part 2 of our tour of Kentik Data Engine, the distributed backend that powers Kentik Detect, we continue our look at some of the key features that enable extraordinarily fast response to ad hoc queries even over huge volumes of data. Querying KDE directly in SQL, we use actual query results to quantify the speed of KDE’s results while also showing the depth of the insights that Kentik Detect can provide.
Kentik Detect’s backend is Kentik Data Engine (KDE), a distributed datastore that’s architected to ingest IP flow records and related network data at backbone scale and to execute exceedingly fast ad-hoc queries over very large datasets, making it optimal for both real-time and historical analysis of network traffic. In this series, we take a tour of KDE, using standard Postgres CLI query syntax to explore and quantify a variety of performance and scale characteristics.
NetFlow and IPFIX use templates to extend the range of data types that can be represented in flow records. sFlow addresses some of the downsides of templating, but in so doing takes away the flexibility that templating allows. In this post we look at the pros and cons of sFlow, and consider what the characteristics might be of a solution can support templating without the shortcomings of current template-based protocols.
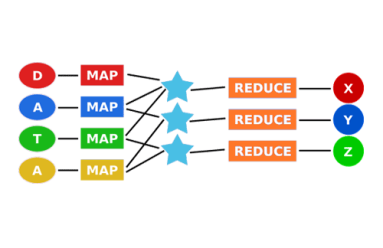
As the first widely accessible distributed-computing platform for large datasets, Hadoop is great for batch processing data. But when you need real-time answers to questions that can’t be fully defined in advance, the MapReduce architecture doesn’t scale. In this post we look at where Hadoop falls short, and we explore newer approaches to distributed computing that can deliver the scale and speed required for network analytics.
NetFlow and its variants like IPFIX and sFlow seem similar overall, but beneath the surface there are significant differences in the way the protocols are structured, how they operate, and the types of information they can provide. In this series we’ll look at the advantages and disadvantages of each, and see what clues we can uncover about where the future of flow protocols might lead.
The plummeting cost of storage and CPU allows us to apply distributed computing technology to network visibility, enabling long-term retention and fast ad hoc querying of metadata. In this post we look at what network metadata actually is and how its applications for everyday network operations — and its benefits for business — are distinct from the national security uses that make the news.
In part 2 of this series, we look at how Big Data in the cloud enables network visibility solutions to finally take full advantage of NetFlow and BGP. Without the constraints of legacy architectures, network data (flow, path, and geo) can be unified and queries covering billions of records can return results in seconds. Meanwhile the centrality of networks to nearly all operations makes state-of-the-art visibility essential for businesses to thrive.
Clear, comprehensive, and timely information is essential for effective network operations. For Internet-related traffic, there’s no better source of that information than NetFlow and BGP. In this series we’ll look at how we got from the first iterations of NetFlow and BGP to the fully realized network visibility systems that can be built around these protocols today.
Border Gateway Protocol (BGP) is a policy-based routing protocol that has long been an established part of the Internet infrastructure. Understanding BGP helps explain Internet interconnectivity and is key to controlling your own destiny on the Internet. With this post we kick off an occasional series explaining who can benefit from using BGP, how it’s used, and the ins and outs of BGP configuration.
By mapping customer traffic merged with topology and BGP data, Kentik Detect now provides a way to visualize traffic flow across across your network, through the Internet, and to a destination. This new Peering Analytics feature will primarily be used to determine who to peer (interconnect) with. But as you’ll see, Peering Analytics has use cases far beyond peering.
By actively exploring network traffic with Kentik Detect you can reveal attacks and exploits that you haven’t already anticipated in your alerts. In previous posts we showed a range of techniques that help determine whether anomalous traffic indicates that a DDoS attack is underway. This time we dig deeper, gathering the actionable intelligence required to mitigate an attack without disrupting legitimate traffic.
Kentik Detect is powered by Kentik Data Engine (KDE), a massively-scalable distributed HA database. One of the challenges of optimizing a multitenant datastore like KDE is to ensure fairness, meaning that queries by one customer don’t impact performance for other customers. In this post we look at the algorithms used in KDE to keep everyone happy and allocate a fair share of resources to every customer’s queries.
DDoS attacks impact profits by interrupting revenue and undermining customer satisfaction. To minimize damage, operators must be able to rapidly determine if a traffic spike is a true attack and then to quickly gather the key information required for mitigation. Kentik Detect’s Data Explorer is ideal for precisely that sort of drill-down.
Kentik Detect handles tens of billions of network flow records and many millions of sub-queries every day using a horizontally scaled distributed system with a custom microservice architecture. Instrumentation and metrics play a key role in performance optimization.
Kentik Detect’s alerting system generates notifications when network traffic meets user-defined conditions. Notifications containing details about the triggering conditions and the current status may be posted as JSON to Syslog and/or URL. This post shows how to parse the JSON with PHP to enable integration with external ticketing and configuration management systems.
Relational databases like PostgreSQL have long been dominant for data storage and access, but sometimes you need access from your application to data that’s either in a different database format, in a non-relational database, or not in a database at all. As shown in this “how-to” post, you can do that with PostgreSQL’s Foreign Data Wrapper feature.


