Launching a labor of love, Kentik Market Intelligence


Summary
Just in time for Valentine’s Day, we’re announcing our newest labor of love: Kentik Market Intelligence (KMI), a new product that spells out the internet ecosystem.
When it comes to the internet, understanding the global ecosystem can be tough. There’s a lot of manual work that service providers and digital businesses have traditionally put into finding the best way to reach customers over IP networks. And more work is needed for benchmarking against competitors and finding the best relationships for peering. But it doesn’t have to be complicated…
Just in time for Valentine’s Day, we’re announcing our newest labor of love: Kentik Market Intelligence (KMI), a new product that spells out the internet ecosystem.

What is KMI?
KMI enables users to easily navigate the insights and dynamics hidden in the global routing table by identifying the ASes operating in any given geography, determining their providers, customers and peers, and alerting you when there are changes to those relationships.
Additionally, KMI produces rankings based on the volume of IP space transited by ASes in different geographies. Using tables and charts, KMI offers a global view of the internet out-of-the-box without any configuration or setup.
KMI uses public BGP routing data to rank ASes based on their advertised IP space. Rankings are updated daily and come in various forms: total customer base, customer type (retail, wholesale, backbone), as well as peering. Your AS is always highlighted for easy comparison in each geography.

Key benefits for NetOps and peering coordinators
KMI removes the guesswork in planning discussions around extending the reach of the network. Now the top retail, wholesale or backbone providers are known in any country, region or continent. Interconnection managers can make better decisions based on data they did not have easy access to previously.
- Determine which service providers connect to the most customer networks, both directly and through peering relationships.
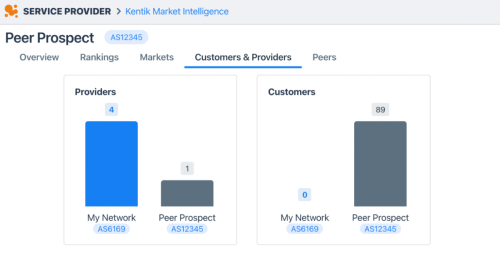
- Quickly understand who are the customers, providers, and peers of any AS in any country.
- Observe the reach and relative market share of each ASN in geographies of interest.
Key benefits for marketing and sales
Sales prospecting used to rely heavily on parsing routing registry records and word-of-mouth. KMI reveals sales opportunities by listing the transit relationships in a target market. For example, you can discover new prospects by analyzing the current customers of wholesale or backbone operators that provide service in a particular market. Additionally, KMI will mark ASes that are critically dependent on a single upstream provider (i.e., single-homed) as well as which ASes are presently classified as customers of your AS (i.e., mutual).
- Know how you compare to other providers in selected geographies.
- Identify sales opportunities by knowing your competitors’ customers in any market, including whether or not they are critically dependent on a single upstream provider.
- Market your network connectivity based on objective ranking data in a geographical market.
- Monitor how your competitors’ rankings are evolving.
How is KMI calculated?
KMI rankings are based on the relative amount of transited IP space by each AS for a given market. While we cannot directly measure the volume of internet traffic routed by any given AS on the internet, we can estimate the size of the customer base by determining how much IP address space it transits relative to other ASes.
All models are based on sets of assumptions and the key assumption for this model is that the volume of transited internet traffic is correlated to the amount of transited IP address space. In other words, the more transited IP address space, the more potential for transited internet traffic and the higher the transit score.
The following computation is done on a regular basis (initially once a day, more frequently in the future) using BGP data collected from the public RouteViews project which collects BGP data from global vantage points around the world. There are four steps:
- AS-AS relationship classification: We classify every AS-AS adjacency as either transit or peering through a machine learning algorithm that takes several factors into account. More details on our methodology can be requested.
- Routed prefixes are assigned a score based on prefix length.
- Prefix scores are summed by geolocation and score type.
- Rank ASes using transit scores.
Every prefix in the global routing table is analyzed and contributes to a set of transit scores by geolocation and score type. Therefore, every AS that is either originating a prefix or transiting one will have some type of transit score for at least one geography. More details on how KMI is calculated are available upon request.
KMI is now available in our Service Provider Analytics package. Please do not hesitate to reach out to our team for a demo or to start your 30-day free trial.


