Summary
Kentik NMS is here to provide better network performance monitoring and observability. Read how to get started, from installation and configuration to a brief tour of what you can expect from Kentik’s new network monitoring solution.
In my last post, I explored the reasons why Kentik recently built and released an all-new network monitoring system (NMS) that includes traditional techniques like SNMP along with more modern methods of collecting telemetry like APIs, OpenTelemetry, and influx.
For this article, we’ll jump right into getting set up in Kentik NMS, from installation and configuration to a brief tour of what you can expect from Kentik’s new network monitoring solution.

Before you begin installation
There’s nothing more frustrating than being ready to test out a new piece of technology and then finding out you’re not prepared. So before you head down to the “Installation and Configuration” section, make sure you have the following things in hand:
- A system to install the Kentik NMS collector on. The collector is an agent that can be installed directly onto a Linux-based system or as a Docker container. Per the Kentik Knowledge Base instructions, you’ll want a system with at least a single core and 4GB of RAM.
- Verify the system can access the required remote sites:
- Docker Hub
- TCP 443 to grpc.api.kentik.com (or kentik.eu for Europe)
- Verify the system can access the devices you want to monitor:
- Ping (ICMP)
- SNMP (UDP port 161)
- Check that you have the following information for the devices you want to monitor:
- A list of IP addresses and/or one or more CIDR notated subnets (example: 192.168.1.0/24)
- The SNMP v2c read-only community string and/or SNMP version 3 username, authentication type and passphrase, privacy type, and passphrase
- You have a Kentik account. If you are just testing NMS out, we’d recommend not using an existing production account. (Not because NMS is unsafe, but because the possibility of accidentally triggering an event that the real Helpdesk will get and think they have to respond to is no fun. Be nice to your support folks. They know where all your data is kept.) If you don’t have an account, head over to https://portal.kentik.com/login and get one set up.
Once you’ve got all of your technical ducks in a row (which, to be honest, shouldn’t take that long), you’re ready to get started on this NMS adventure!
Is it time to migrate to a modern network monitoring system?
Installation and configuration
Whether you install the Kentik NMS collector on a Linux system (physical or virtual) or in a Docker container, you’ll start in the portal. Click the “hamburger menu” (the three lines in the upper left corner), which shows the full portal menu.


Click “Devices” and then select the friendly blue “Discover Devices” button in the upper right corner.
The next screen allows you to install the collector, either as a Docker container:

or on a full Linux system.

Shortly after doing that, you’ll see the agent name (or the name of the system the agent is installed on) show up in the “Select an Agent” area below.

Go ahead and click “Use this Agent.”
From the next screen, you’ll enter an IP address, a comma-separated list of IPs, or a CIDR-noted range (example: 192.168.1.0/24).

Trick: You can mix and match, including individual IPs and CIDR ranges.
Another trick: If there are specific systems you want to ignore, list them with a minus (-) in front.
Presuming this is your first time adding devices, you’ll probably have to click “Add New Credential.”


Let’s get this out of the way: You will never select SNMP v1. Just don’t.
That said, choose SNMP v2c or v3, include the relevant credentials, give it a unique name, and click “Add Credential.”
Then select it from the previous screen.
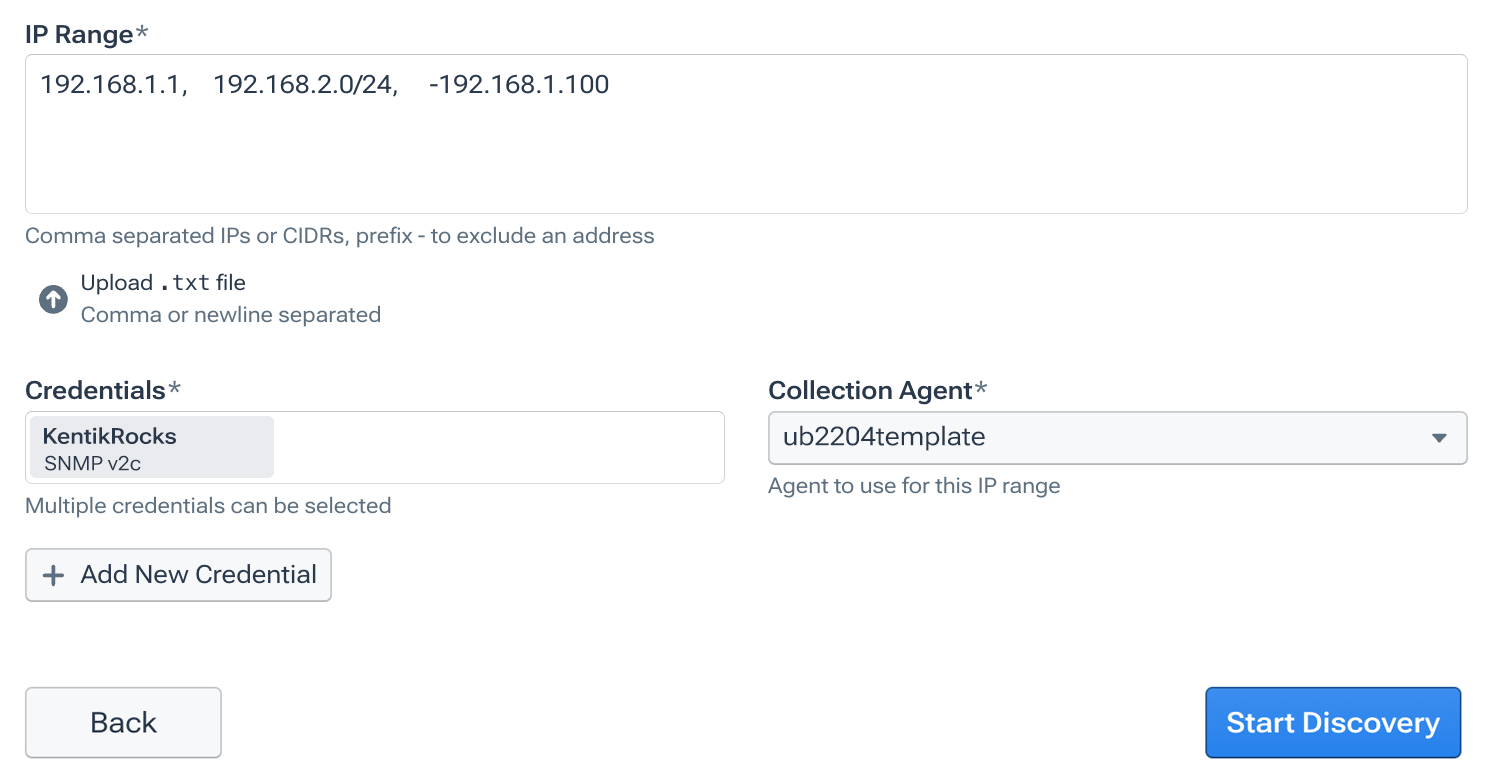
At that point, click “Start Discovery” to kick off the real excitement.
The collector will start pinging devices and ensuring they respond to SNMP. Once completed, you’ll see a list of devices. You can check/uncheck the ones you want to monitor and click “Add Devices.”

A brief tour
The main NMS screen
Now that we have some devices installed and are collecting data, let’s take a quick look around.
Back up in the main Kentik menu, click “Network Monitoring System.” That will drop you into the main dashboard.

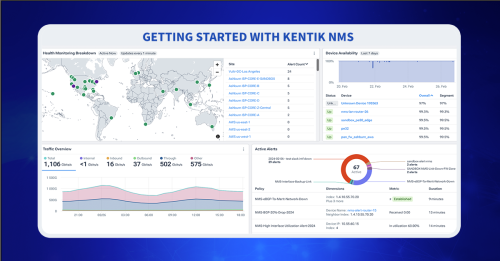
On the main screen, you’ll see:
- A geographic map showing the location of your devices
- A graph and a table showing the availability information for those devices
- An overview of the traffic (bandwidth) being passed by/through your infrastructure
- Any active alerts
- Tables with a sorted list of devices that have high bandwidth, CPU, or memory utilization
The Devices list
Returning to the hamburger menu, we’ll revisit the “Devices” list, but now that we have devices, we’ll take a closer look.

This page is exactly what it claims to be – a list of your devices. From this one screen, you have easy access to the ability to:
- Sort the list by clicking on the column headings.
- Search for specific devices using any data types shown on the screen.
- Filter the list using the categories in the left-hand column.
There are also some drop-down elements worth noting:
- The “Group By” drop-down adds collapsable groupings to the list of devices.
- The “Actions” drop-down will export the displayed data to CSV or push it out to Metrics Explorer for deeper analysis.
- The “Customize” option in the upper right corner lets you add or remove data columns.
And we’re already familiar with the friendly blue “Discover Devices” button.
The Interfaces list
Remember all the cool stuff I just covered about devices? The following image looks similar, except it focuses on your network interfaces.

Metrics Explorer
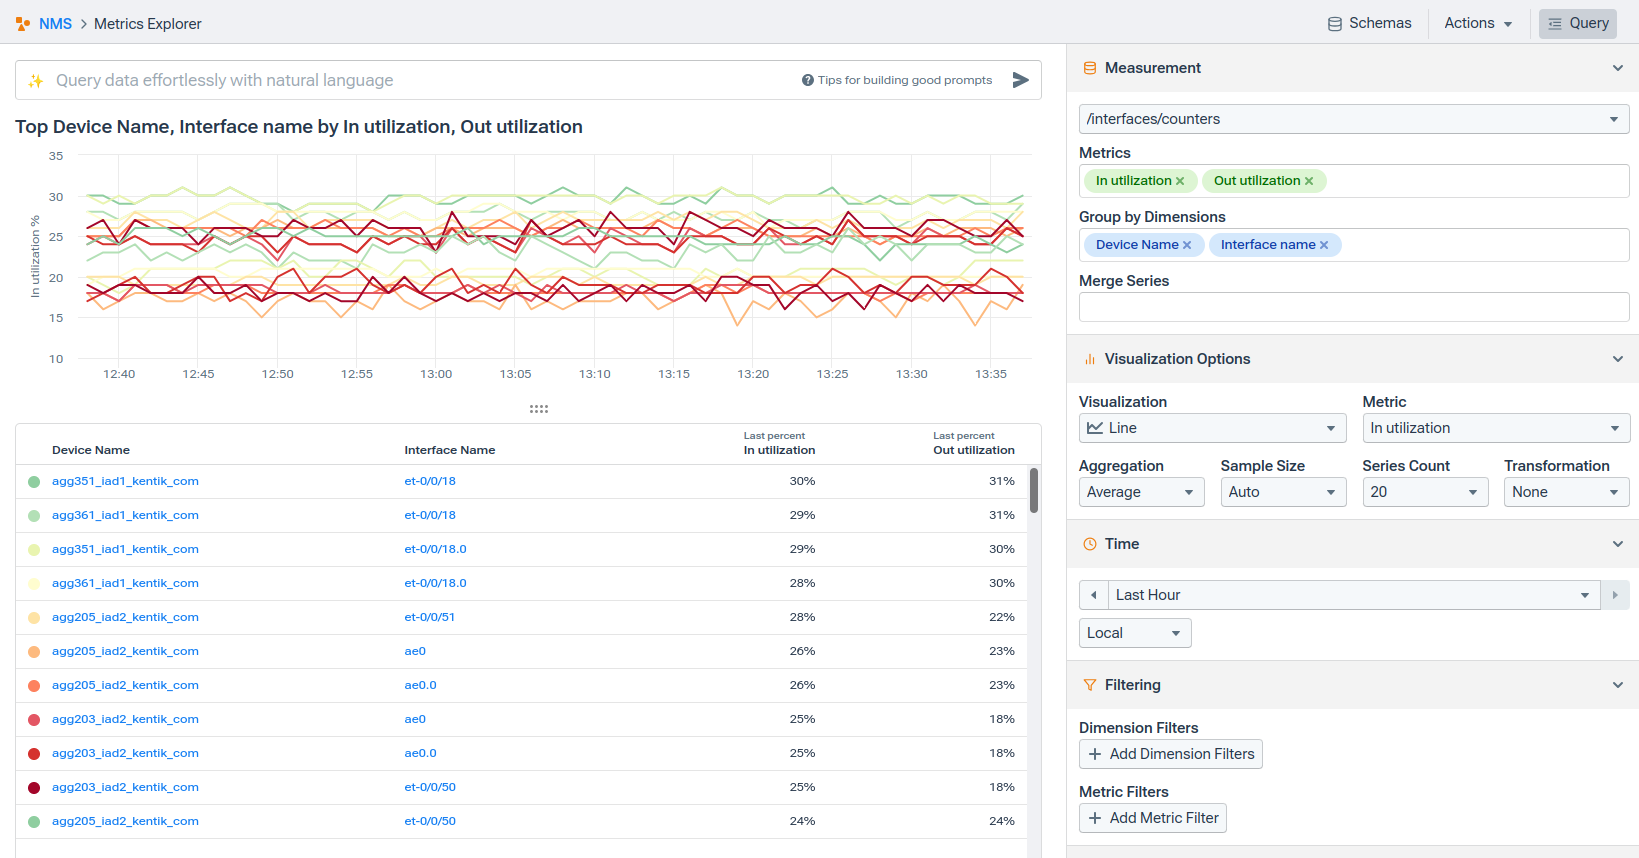
Metrics Explorer is, in many ways, identical to Kentik’s existing Data Explorer capability. It’s also incredibly robust and nuanced. So much so that it deserves, and will get, its own dedicated blog post.
For now, I will give this incredibly brief overview just to keep this post moving along:
First, all the real “action” (meaning how you interact with Metrics Explorer) happens in the right-hand column.
Second, it’s important to remember that the entire point of the Metrics Explorer is to help you graphically build a query of the network observability data Kentik is collecting.
With those two points out of the way, the right-hand area has five primary areas:
- Measurement allows you to select which data elements and how they are used.
- Visualization options: This section controls how the data displays on the left.
- Time: The period of time to display data from and whether to display time markings in UTC or “local” (the time of whatever computer is viewing the graph).
- Filtering: This will let you add limitations so that only data that matches (or does not match) certain criteria is included.
- Table options: These set the options for the table of data that displays below the graph and lets you select how many rows and whether they’ll be aggregated by Last, Min, Max, Average, or P95 methods.
And that ends our brief tour!
Parting words
We’ve only skimmed the surface of what Kentik NMS offers, but hopefully, you’re ready to start adding your own devices and interfaces. We’ll be back soon with more NMS tutorials and walkthroughs, but in the meantime, sign up now to get started with a 30-day free trial of Kentik and see Kentik NMS in action yourself.


