Using Kentik Journeys for Network Troubleshooting

Summary
Kentik Journeys uses an AI-based, large language model to explore data from your network and troubleshoot problems in real time. Using natural language queries, Kentik Journeys is a huge step forward in leveraging AI to democratize data and make it simple for any engineer at any level to analyze network telemetry at scale.
Kentik Journeys is a new way for engineers to dig deep into network telemetry using natural human language. Just like using ChatGPT to interrogate a dataset and ask a series of questions that build on each other, Journeys gives you the ability to leverage a large language model and natural language processing to explore data from your network and troubleshoot problems in real time.

Think about how we typically troubleshoot a network problem. Usually, it starts with asking, “What’s wrong?” followed by a series of follow-up questions based on what we learn each step of the way. In the same way, Journeys gives you the ability to perform root cause analysis easier and faster than ever before.
Rather than study graphs of device metrics, complex Sankeys of flow data, or the output of a dozen show commands, you can simply ask Kentik a question or ask it to show you some specific data, and the system will programmatically query device metrics and flow data for you. And because troubleshooting usually requires a series of probing questions, Kentik will remember what you asked and respond to your follow-up questions with previous questions and answers in mind.
Application delivery relies on many network and network-adjacent components and services, so we’ve designed Journeys to work across the entire Kentik product surface. So, let’s walk step-by-step through an example of using Journeys to troubleshoot a performance issue. Pay special attention to how follow-up questions are related to previous questions and how we can save our Journey to share with our team.
Scenario
In our scenario, people in one specific branch office are complaining about application performance. Specifically, the connection to the application breaks intermittently, which affects application performance and the user experience.
The location is connected to on-prem data centers and the public cloud by a Cisco SD-WAN, which the application’s local Postgresql mechanism uses to connect to the resources it needs.
We can begin troubleshooting by asking some basic questions because Kentik ingests device metrics, flow data, and contextual telemetry about the entire organization, including its public cloud environment.
Natural language troubleshooting with Journeys
Step 1

First, we select “New Journey” to start the process. Because we intend to keep this entire conversation to refer to later, we’ll give it a more useful name, in this case, “Postgres issue.”
Journeys currently supports any queries related to flow data, which would typically be visible in Data Explorer, as well as metrics from SNMP and streaming telemetry, which we’d normally see in Kentik NMS Metrics Explorer. Over time, expect this to expand to more telemetry from across your infrastructure and clouds.
Step 2
Since all our Cisco SD-WAN devices have “cedge” and the site name in their names, we can start by asking to see all the traffic traversing our SD-WAN edge devices in the last couple of hours when the issue was reported.
Type in the input query text box the following query:

Here, we’re using natural language to ask the system a question about traffic, which then turns into a query in the Data Explorer. The system interprets our natural language and turns it into a set of filters to give us the result below.
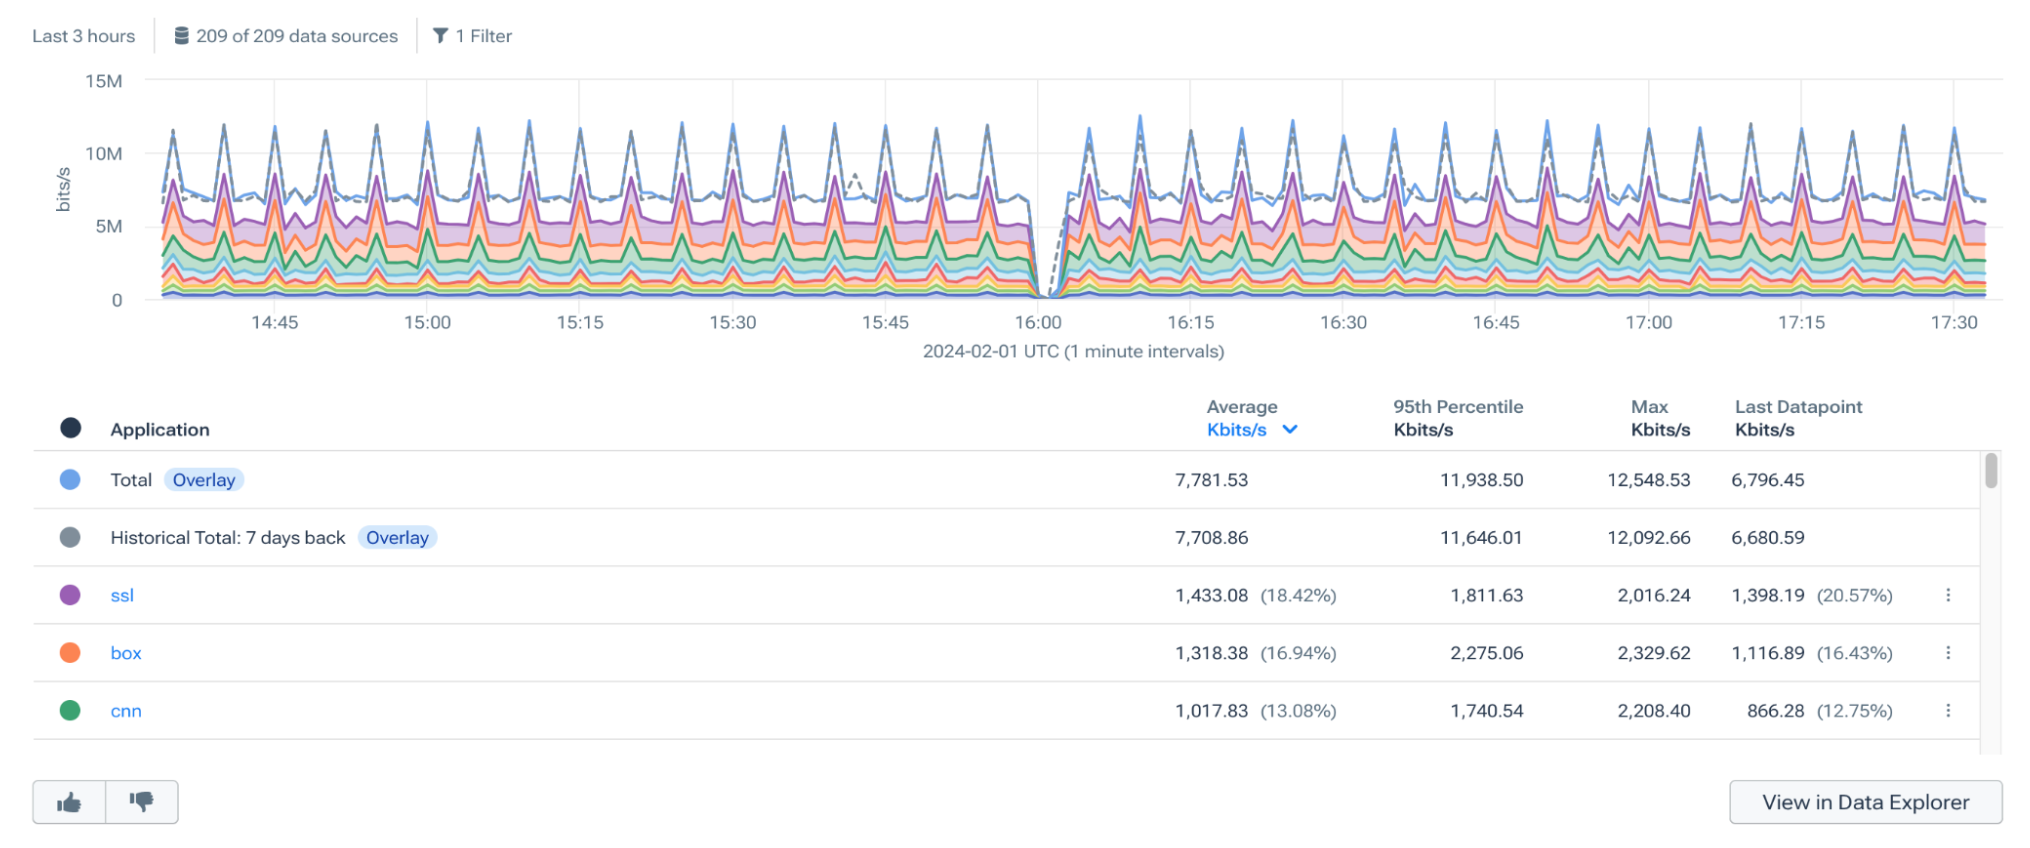
In this output above, we can see the applications traversing our cedge devices, which is a good start, but the application we’re interested in likely has low volume traffic, and it is not visible in the TOP applications.
We can drill down further and add filters using natural language that will look for our Postgresql application. Remember that the system remembers what we already asked, so as long as we stay in this Journey, we can ask a follow-up question in that context.
Step 3
We can add an additional filter for Postgresql by typing this query in the text box:
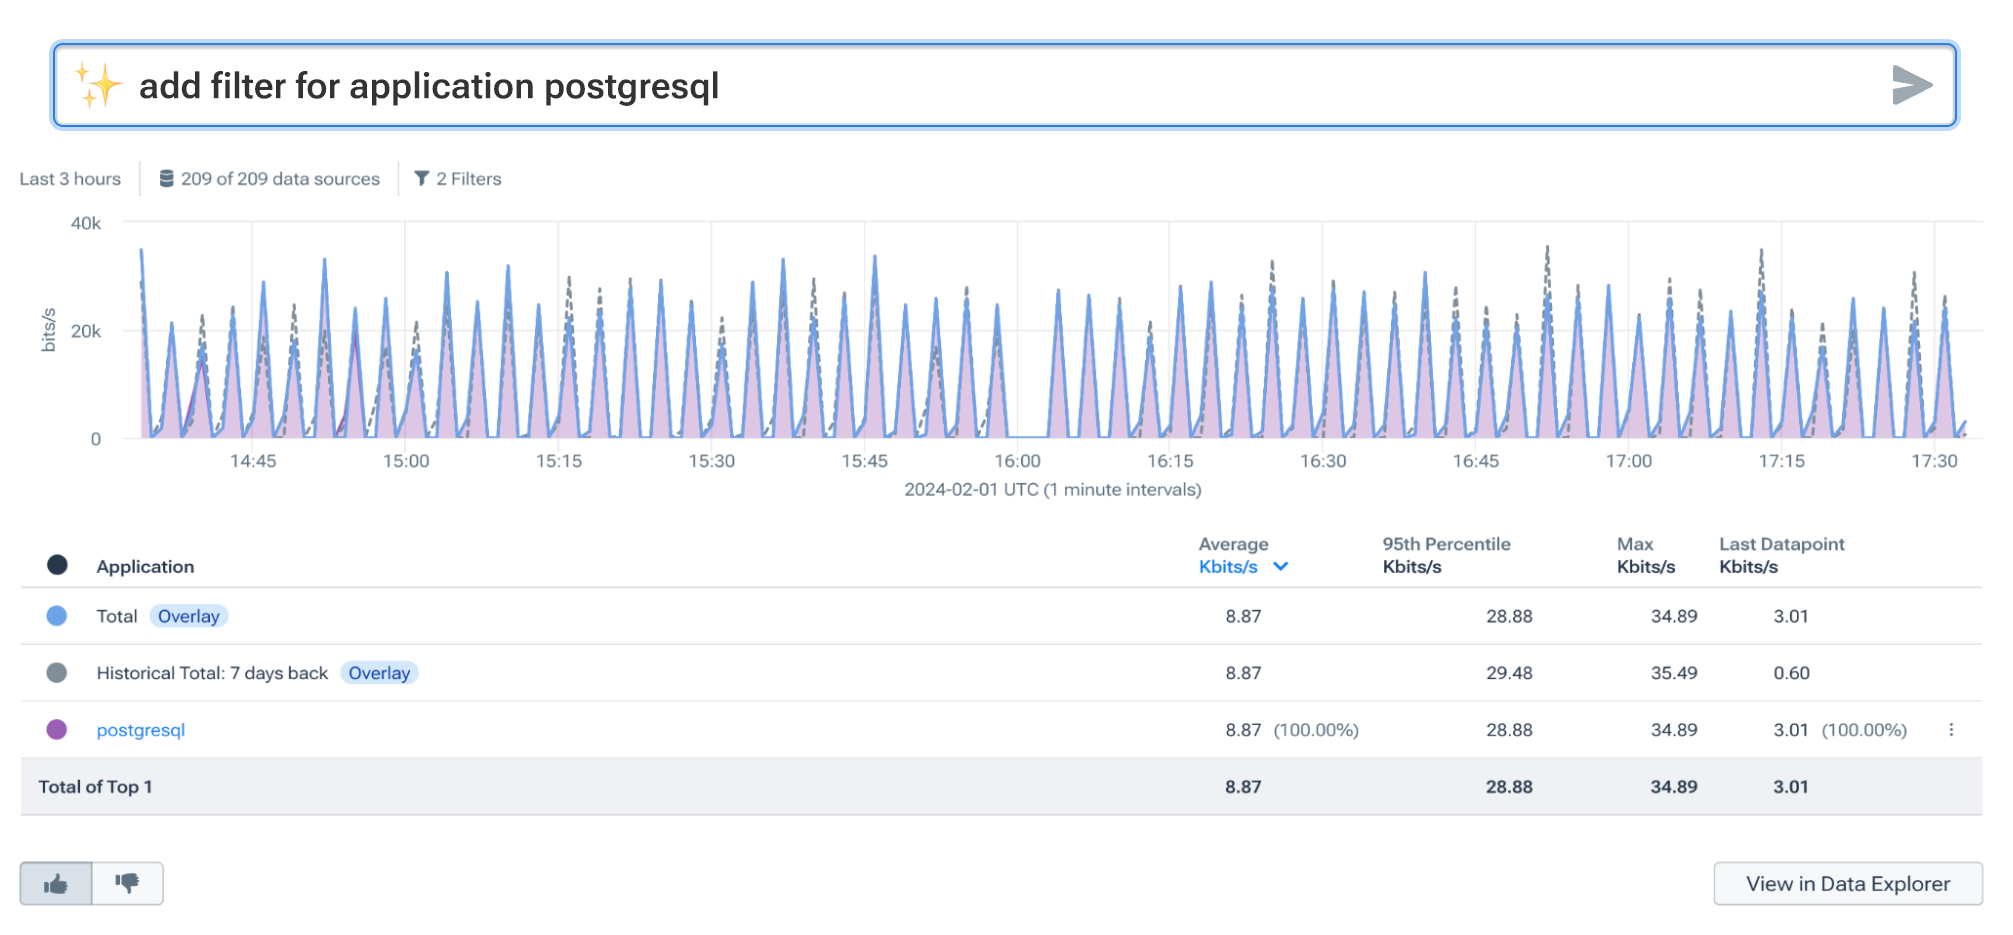
Notice the specific traffic for our Postgresql application in the results above. This is great, but we need more details to understand why it isn’t working correctly. We need to see which SD-WAN edge devices are actually seeing this traffic and learn that we can simply add that question to our growing journey.
Step 4
For our next step, we can add:
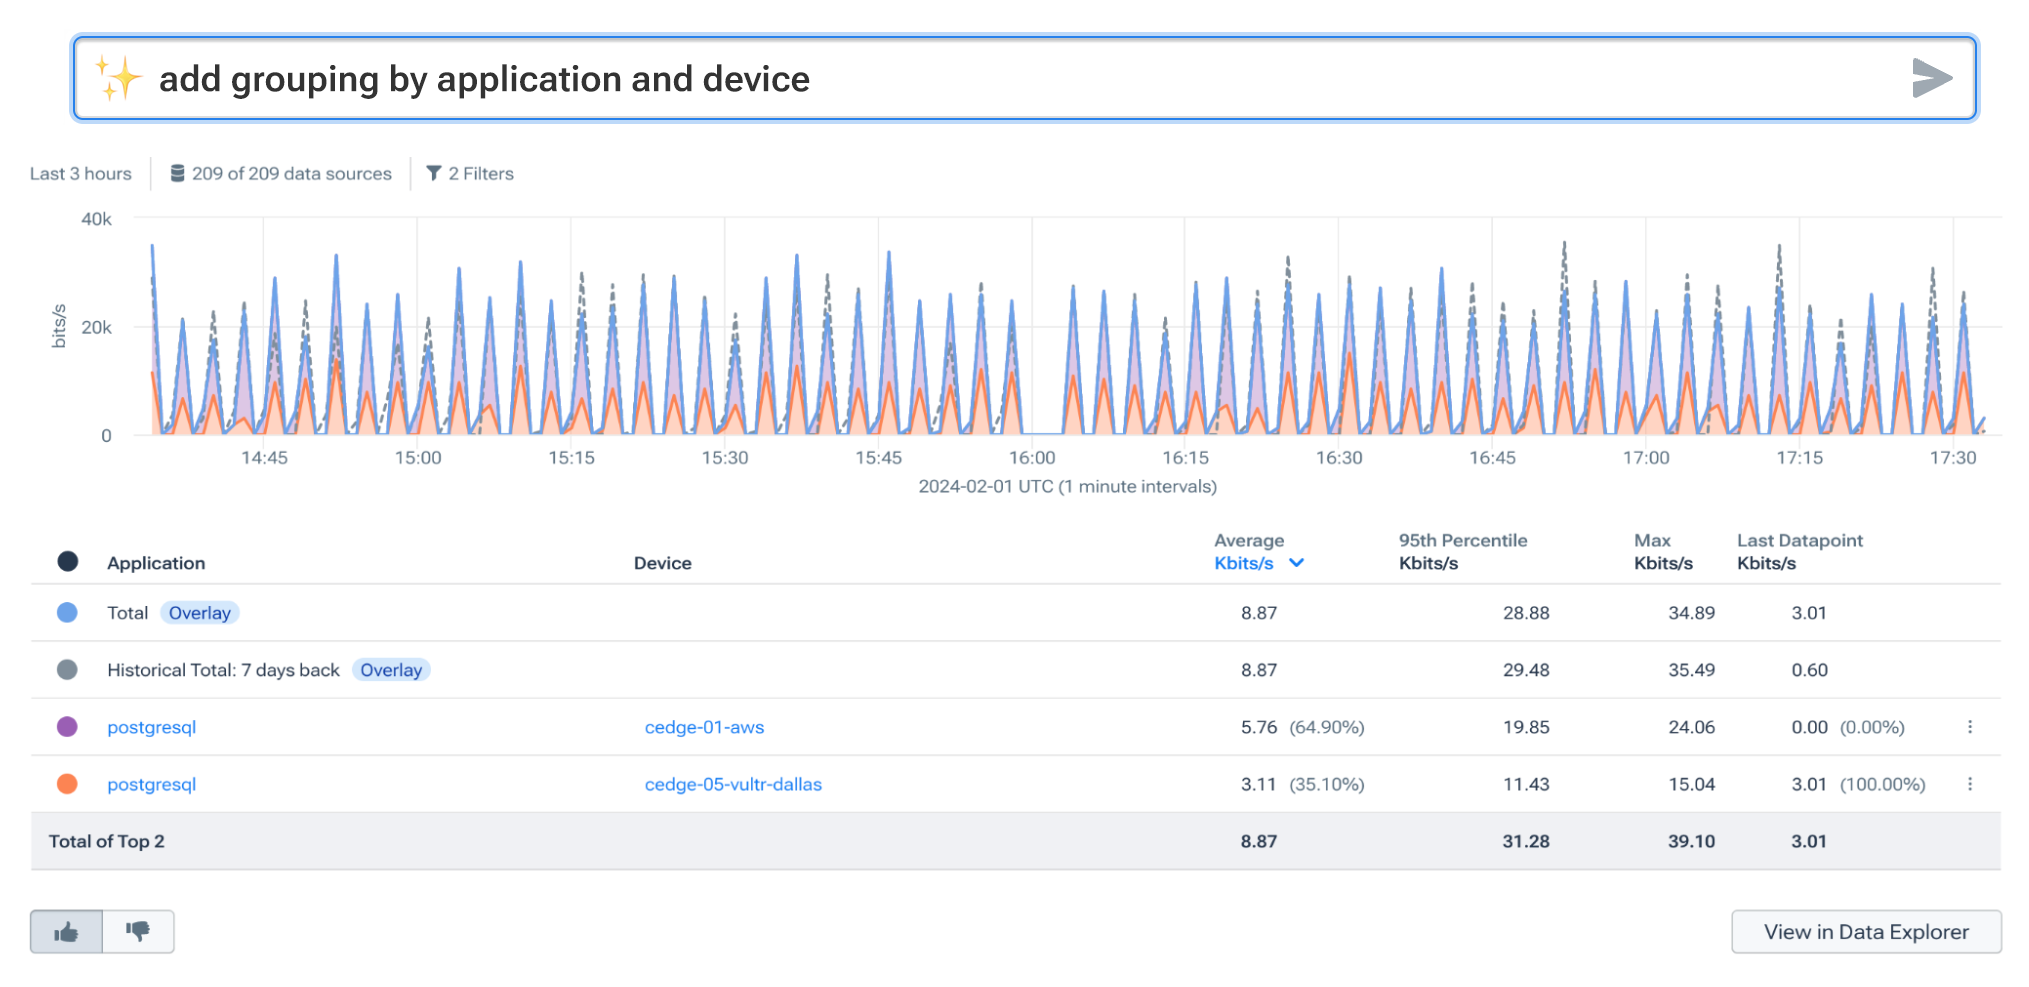
In the results, we can see that this traffic goes over multiple devices. However, since users reported the problem specifically for one location, Site 01, we need to filter our view to only the Site 01 edge device.
Our cedge has multiple connections to the internet, so we also need to filter our interfaces to see precisely which WAN link our application traffic is using. Remember that we’re using natural language query (NLQ), so we only need to group these results by destination interface using plain language.
Step 5
We can do that by adding our next input:

Ok, so the output above is interesting. The result of adding that filter shows us that traffic has been going over two WAN interfaces and not just one. One of the interfaces has the Cisco SD-WAN color of Silver and the interface Gold. Notice the two colors in the graph denoting two different interfaces, GigabitEthernet1 and GigabitEthernet2.
If we hover the mouse over the results in the table, the system will highlight the results on the chart for us. When we do that (see images below), notice that the traffic is alternatively routed over these two links in different time intervals. This is not the behavior we want or expect, and it’s so far the most probable cause of the intermittent application issues.


Now we’re really getting somewhere, but seeing the likely cause is one thing — understanding why is a different story. We need to keep digging further to figure out what’s happening.
It’s important to remember that rather than pouring over charts and graphs or running show commands on cedge devices, we’ve been using natural language to easily query our data and ask follow-up questions. This means even a novice network engineer can troubleshoot complex network problems; novice or not, anyone using this method will get to the answer faster.
Step 6
So, let’s keep digging to figure out what’s happening here. So far, we’ve learned that something is causing the cedge to switch the forwarding path from time to time. Usually, that’s because the cedge sees some sort of problem with the link, or in other words, loss, latency, jitter, etc., that exceeds the thresholds we set.
We can check the interface utilization, bitrate, and ensure there are no bottlenecks that would cause packet drops.
Since we’re now asking questions about device metrics, Journeys will automatically apply our natural language query to the underlying metrics dataset, Metrics Explorer.
Let’s add the following filter to our series of queries:

According to the output above, there isn’t a smoking gun we can point to. Utilization of each interface is relatively low, and there’s no apparent packet loss or other adverse behavior happening on the links connecting to our local service providers.
However, Cisco SD-WAN devices also track the quality, in terms of latency, of each SD-WAN tunnel. The good news is that Kentik Network Monitoring System (NMS) also collects this information, so we also have the metrics for SD-WAN tunnels.
Step 7
Let’s add latency grouped by remote IP and SD-WAN colors to our journey:

Take a look at that — latency on the Silver link toward Site 05 fluctuates over time from 10ms to over 300ms. And that frequent change in latency correlates directly with the path selection changes and, ultimately, application performance issues.
At this stage, we would examine the application routing policies on the SD-WAN controller and place a call to our service provider to ask what’s happening on their end that’s causing this latency fluctuation.
Root cause analysis using natural language
Being able to troubleshoot a network problem, especially one that’s intermittent, means analyzing data about devices, application flows, user behavior, service provider information, and so on. In other words, to get to the answer, it takes a lot of time and effort to mine through data, looking for clues, asking questions, and drawing conclusions.
Using large language models, specifically natural language processing, takes the burden off the engineer to click through multiple screens, mine through charts, and run show commands ad nauseam. Kentik’s heart is with the engineer working in the trenches to run networks day-to-day, so it’s been a goal to find ways to make network operations easier.
Kentik Journeys is a huge step forward in democratizing data, making it simple for any engineer at any level to analyze network telemetry at scale and in real time.
