DDoS Detection: Separating Friend from Foe

Summary
DDoS attacks impact profits by interrupting revenue and undermining customer satisfaction. To minimize damage, operators must be able to rapidly determine if a traffic spike is a true attack and then to quickly gather the key information required for mitigation. Kentik Detect’s Data Explorer is ideal for precisely that sort of drill-down.
Full traffic visibility to diagnose those nasty attacks
In many organizations, networks are at the core of the business, enabling not only internal functions such as HR, supply chain, and finance but also the services and transactions on which the business depends for revenue. That makes network availability critical. Any interruption of access from the outside world turns off the revenue spigot, impacting profit and creating a bad user experience that can damage customer satisfaction and result in permanent loss of patronage. The worse the outage, the worse the damage. That’s why speed is so important in detecting, diagnosing, and responding to Denial of Service (DoS) and Distributed Denial of Service (DDoS) attacks.

About DoS and DDoS
Just to be sure we’re on the same page, a DoS attack is an attempt to make computing or network resources unavailable for normal usage, such as interrupting a host’s access to the Internet or suspending its services to the Internet. DoS becomes DDoS when the source of the attack is distributed, meaning that the attack comes from more than one unique IP address. DDoS attacks are commonly launched from “botnets” of compromised hosts that can number up into the thousands.
DDoS attacks are rapidly increasing in both frequency and size.
It’s widely known that DDoS attacks are rapidly increasing in frequency and size. While mega attacks that last for many hours and reach 200 Gbps or more make the news, the vast majority of attacks last under an hour and are less than 1 Gbps in volume. Smaller attacks often happen without being noticed, though they may be harbingers of larger attacks to come. Mid-sized attacks are more readily felt, but distinguishing between a friendly surge in normal traffic and an attack is key to timely response. Large attacks are fairly obvious, and in these cases diagnosing the traffic is important to understand network entry points and sources. In all cases, a clear assessment is important to understand the best way to mitigate the attack.
The most common form of DDoS is the volumetric attack, in which the intent is to congest all of the target network’s bandwidth. Roughly 90% of all DDoS attacks are volumetric, with application-layer attacks making up the remaining 10%. According to Akamai’s Q1 2015 State of the Internet report, over 50% of volumetric attacks are IP flood attacks involving a high volume of spoofed packets such as TCP SYN, UDP, or UDP fragments. A growing percentage of attacks are reflection and amplification attacks using small, spoofed SNMP, DNS, or NTP requests to many distributed servers to bombard a target with the much more bandwidth-heavy responses to those requests.
In the last few quarters, both Akamai and other Internet security observers have noted rapid growth of reflection attacks based on spoofed Simple Service Discovery Protocol (SSDP) requests sent to IP-enabled home devices with poorly protected Universal Plug-n-Play (UPnP) protocol stacks. SSDP reflection now accounts over 20% of all volumetric DDoS attacks.
DDoS detection and analysis cases
Depending on your organization type (e.g. ISP, hosting company, content provider, or end-user organization), you may be concerned only with attacks that directly affect your resources. Or you might want to know about any attack traffic that’s passed — or is passing — through your network. Either way, there are two general cases of DDoS analysis:
- Diagnosing — You’ve already detected that something is amiss, for example one of your resources is experiencing service degradation, you’re seeing anomalous server log entries, or a circuit is unusually full. In this case, you’ll need to identify the traffic that’s causing the problem, and, if it’s not legitimate, to characterize the attack clearly enough to enable specific mitigating actions.
- Spelunking — In this case you’re not aware of any current attacks but you want to explore your network traffic data to learn more about previous attacks (and maybe even find an attack in progress). We’ll cover this second mode of DDoS analysis in a separate forthcoming post.
Kentik Detect’s big data datastore gives you many ways to analyze volumetric traffic
In both of these analysis cases, the NetFlow and BGP information in Kentik Detect’s big data datastore gives you many ways to analyze volumetric traffic. In the following examples we’ll look at how this data can help you separate an attack from an innocent spike.
Diagnosis by Destination IP
For this first example, let’s say that you’re suddenly being alerted — e.g. by server overload alarms from your network management software, or by alert notifications from Kentik Detect — that the IP address “192.168.10.22” (anonymized here to protect the innocent) is getting hammered by anomalous traffic, indicating that it is possibly under attack. You’ll want to rapidly drill down on key characteristics of the suspect traffic to determine if it’s actually an attack, and if so to gather information that will help you to mitigate the attack quickly.
As a starting point, we would go to the Data Explorer in the Kentik Detect portal. By clicking All in the device selection pane in the sidebar at left, and then the Apply button, we can see total network-wide traffic for all of the listed device(s). Since we know the IP address that we suspect is under attack, we’ll can then use the Filters pane in the left-hand sidebar to filter the total traffic for that address:

- Click Add Group. The Filters pane expands, showing the first filter group (Group 1).
- Define a filter for traffic whose destination IP is 192.168.10.22:
- From the drop-down metrics menu, we choose Dest IP/CIDR.
- We leave the operator setting at “=” (default).
- In the value field, we enter 192.168.10.22/32.
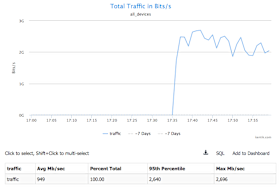
- The Filters pane then appears as shown at left. - Click the Apply button at the upper right of the page. A graph is rendered (Fig. 2) and a corresponding table is populated below the graph (Fig. 3).
Once we’ve applied this destination IP address filter, the resulting graph shows clearly that there is a significant, anomalous spike of traffic for over 20 minutes and continuing.
Viewing by Source IP
Now we need to characterize this traffic. An abnormally large number of source IP addresses from atypical countries is indicative of a botnet, so we’ll look at traffic by source country to unique source IP addresses:
- In the Group by Metric drop-down above the graph, choose Source » Country.
- In the Units drop-down, choose Unique Src Ip, then click Apply.
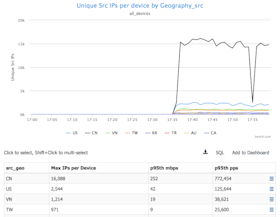
We can now see that there is a huge number of unique source IP’s from China, U.S., Vietnam and other countries that are generating nearly a million packets per second in aggregate. Since this IP happens to be the U.S. and doesn’t typically get traffic from Asia, that’s clearly suspicious. China is the biggest contributor to this suspect traffic, so we’ll isolate China and look at packets per second per source IP:
- In the Group by Metric drop-down, choose Source » IP/CIDR.
- In the Units drop-down, choose Packets/s, then click Apply.
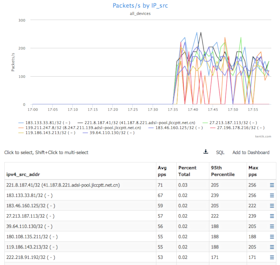
This view validates that we’re looking at a rather large number of source IP addresses that are sending equivalent packets per second, which is indicative of a botnet.
Additional attack characteristics
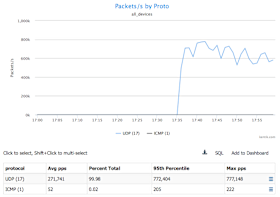
Now that we’re pretty sure we’re under DDoS attack, it would be helpful to know a bit more about the traffic we’re being hit with. So next we’ll look at the protocol and destination port # of the traffic. First, in the Group by Metric drop-down, choose Full » Proto. We can see that the traffic is primarily UDP:
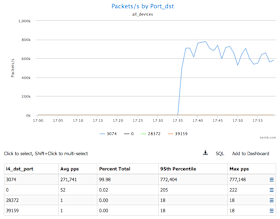
Next we’ll set the Group by Metric drop-down to Destination » Port to look at the destination port number.
Assessing mitigation options
When we look at the destination port # of the traffic, we can see that there is remarkable consistency, in that the vast majority of the UDP packets are going to port 3074, which is the Xbox protocol. Now we can be pretty certain that this is a botnet attack. Since this address otherwise doesn’t receive traffic from Asia, we can mitigate the majority of the attack by dropping this traffic from China and some of the other Asian countries.
Remember, though, that our look at source countries listed the U.S. right after China, with over a hundred thousand packets per second. So to develop a complete mitigation plan we need to explore that issue next. Since this IP gets traffic from the U.S. under normal conditions, simply dropping traffic from the U.S. isn’t a good idea. But what we can do is to look at packets by source IP, but this time instead of /32 host source IPs, we’ll look at /24s.
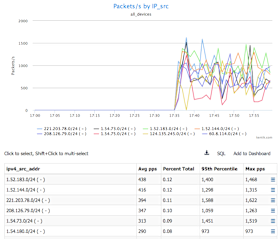
We can see that there is a good number of /24s that are sending a fair amount of pps. So, one possible mitigation approach would be to rate-limit the pps from each of these /24. Another mitigation would be to redirect traffic from these /24s to an internal or cloud-based scrubbing center.
Conclusion
There’s a large-scale dark market that trades in DDoS, and that market continuously innovates and evolves to meet new demand. With the nature of DDoS attacks constantly changing, network-centric organizations need an agile approach approach to DDoS detection. By offering complete visibility into network traffic anomalies, including both alerting and full-resolution drill-down on raw flow records, Kentik Detect enables operators to respond rapidly and effectively to each DDoS threat.
Read our solution brief to learn more about Kentik DDoS Detection and Defense.


