Website Performance and Transaction Monitoring with Kentik


Summary
Learn about website performance monitoring, why you need it, and how to set up automated transaction testing using Kentik’s network observability platform in this step-by-step tutorial. You can even follow along using the free trial version of Kentik.
In this article, you’ll learn more about website performance monitoring and why you need it. You’ll also learn how to set up automated transaction testing using Kentik’s synthetic monitoring tools.
What is website performance monitoring?
Website performance monitoring is the process of continually tracking and analyzing the performance of a website or web application, including metrics such as page load time, uptime, server response time, and error rates. Automating the performance monitoring process helps businesses identify and address issues impacting user experience, availability, search engine ranking, capacity, and scalability.
Why do you need website performance monitoring?
If you’re reading this article, chances are you know you need to use different tests and techniques to monitor a website’s performance. Tests like page load speed and HTTP response can help you monitor your website’s performance, but they don’t offer a comprehensive understanding of user behavior and its impact on performance. However, synthetic transaction tests provide a more effective solution by allowing you to monitor website performance based on the user’s digital experience, enhancing the observability of your system.
This is where website performance monitoring plays a vital role. By ensuring reliable and insightful performance monitoring, you can achieve lower bounce rates, improve customer retention, and enhance the overall user experience.
Most major search engines use multiple performance metrics as a ranking factor, such as Google’s Core Web Vitals and Bing Webmaster Guidelines. Improving your website’s performance can also help you achieve high search engine rankings and increase the discoverability of your website.
Additionally, performance monitoring helps to maintain web applications’ availability and to indicate the right time to scale. By leveraging the insights provided by effective monitoring tools, you gain valuable data that can inform business decisions regarding your development roadmap, capacity planning, and scalability.
Introducing Synthetic Transaction Monitoring
Synthetic transaction monitoring takes the monitoring process further by monitoring specific types of digital transactions, such as registration, form submission, and purchases. It can help you gain performance insights based on real user experience scenarios and identify issues that may arise during the transaction process, such as slow response times, bottlenecks, and browser errors.
Synthetic transaction monitoring involves monitoring user transactions from different geographical locations to help you focus on performance where most users are located. It can also provide accurate transaction performance metrics from a new location where a service will be launched.
Transaction monitoring is valuable in several scenarios, including e-commerce and software-as-a-service (SaaS) websites. For example, it can help e-commerce websites create an efficient checkout process and allow complex SaaS applications to provide a better user experience and determine scalability needs. Moreover, it can help maintain fast streaming speed for media and entertainment websites.
How to monitor website performance with Kentik
Now that you know why you need performance monitoring, set it up using Kentik’s synthetic transaction testing features. As previously noted, transaction tests help you monitor the real-time performance of specific user experience scenarios. Here, you’ll learn how to create tests that run periodically using testing agents from multiple locations.
With Kentik’s transaction monitoring, you’ll receive real-time alerts that help you visualize issues based on a monitored global digital experience. This can save you time and help you determine when and how to improve performance.
Before you begin, you need to have the latest version of the Chrome browser (version 113 was used here) and a free Kentik account.
Once you’ve opened an account, it’s time to get started.
Record a transaction in Chrome
To begin, you need to simulate users’ actions using the Chrome DevTools Recorder. This is a relatively new function that allows you to record a user’s digital experience and import it in several formats, including JSON, Puppeteer, or test tool scripts, such as Cypress and Nightwatch.
In your Chrome browser, press F12 (or Ctrl + Shift + I if you’re using Windows/Linux or Command + Shift + I on Mac) to open Chrome DevTools, then open the Recorder tab:

Click the Recording button, then navigate to the website or application you want to test and perform some actions. For instance, you can record navigating to your website and completing the registration process. If you’re testing an e-commerce website, you can mimic the shopping experience and add products to the shopping cart. Once you’re done, click Stop.
In this example, we navigated to a company’s website, clicked buttons that triggered JavaScript-animated scrolling, and submitted a contact form. This is what the recording results look like:
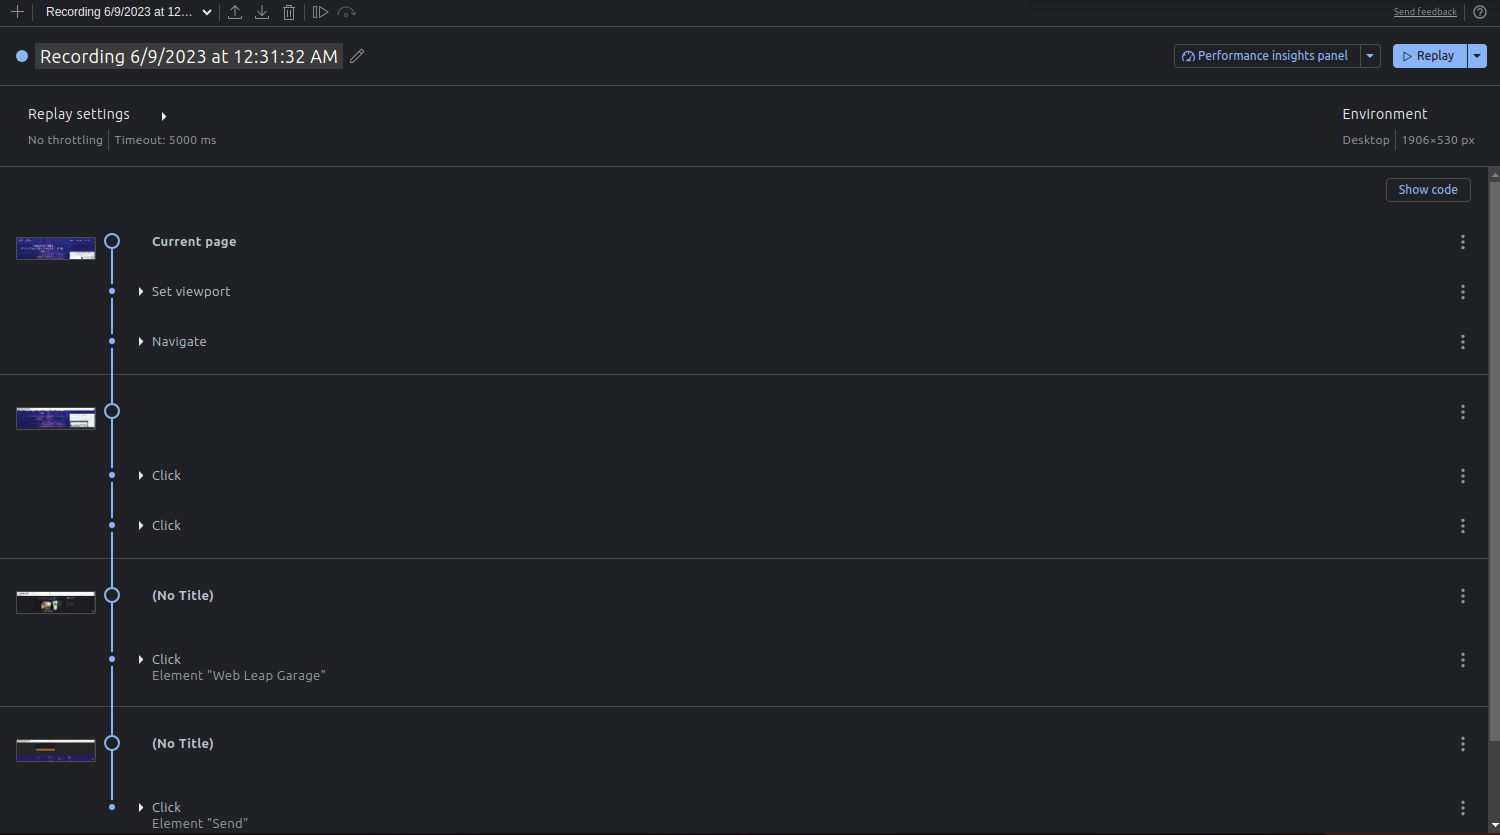
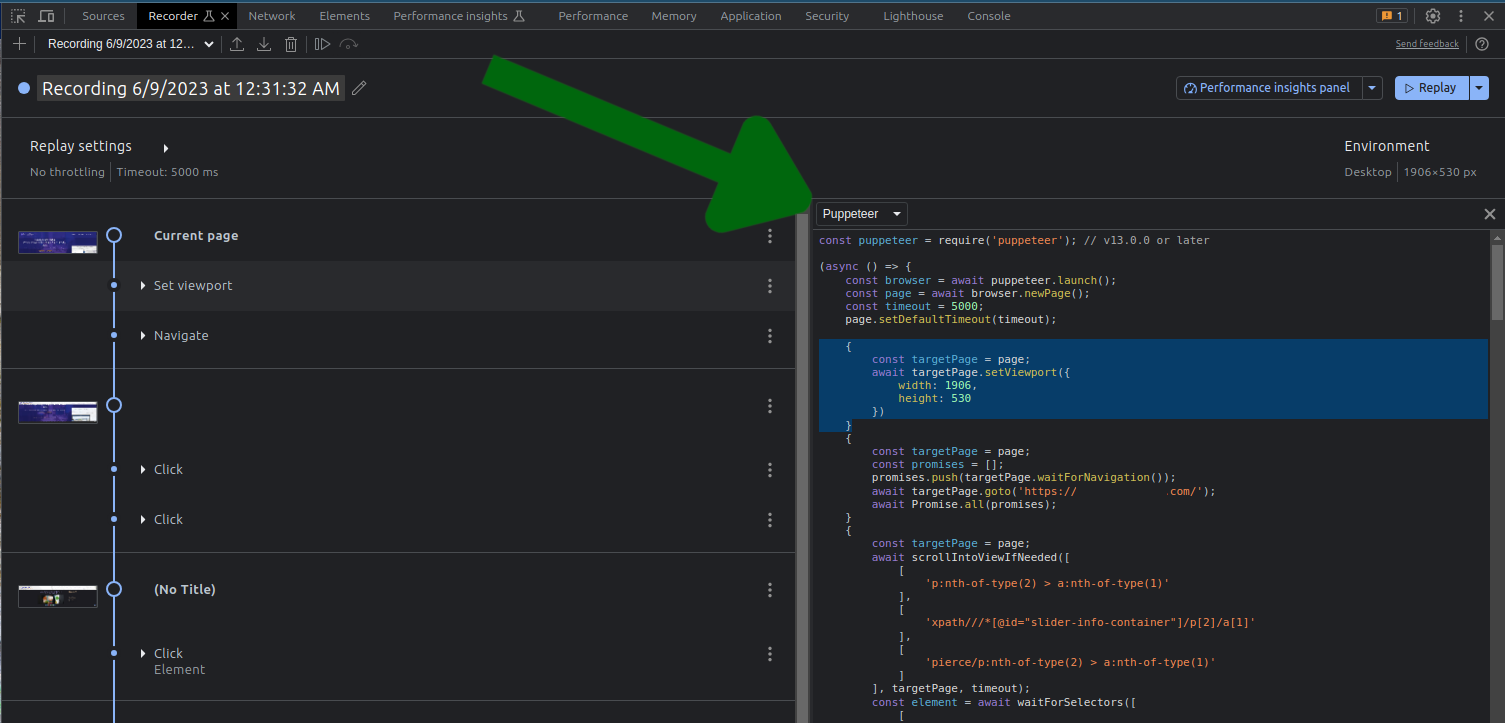
To use the Recorder with Kentik’s transaction testing, you need to export the recorded actions as a Puppeteer script. If you’re unfamiliar with Puppeteer, it’s a Node.js library that provides an API to create and control a headless Chrome browser.
To view the Puppeteer script, select Show code and then select Puppeteer from the drop-down menu and copy the code:
Edit the Puppeteer script
The imported Puppeteer script will include the code of the recording without screenshots. You need to manually add the code to take screenshots in order to see what the website looks like during the test.
To add screenshots, go through the script and paste await page.screenshot({ path: "screenshot1.jpg" }); after every event, such as a page load, an AJAX request, or a browser closing. Make sure every screenshot image has a unique name, and that every image has a .jpg extension, like this:
{
        const targetPage = page;
        const promises = [];
        promises.push(targetPage.waitForNavigation());
        await targetPage.goto(’https://yourwebsite.com/’);
        await page.screenshot({ path: "screenshot1.jpg" });
        await Promise.all(promises);
}
Here’s an example of what adding a screenshot would look like for a JavaScript scrolling event:
await element.click({
          offset: {
            x: 98,
            y: 34,
          },
        });
await page.screenshot({ path: "screenshot2.jpg" });
await Promise.all(promises);
Ensure that the viewport size of the browser instance is big enough to capture a large part of the screen. Your code for that should look something like this:
{
        const targetPage = page;
        await targetPage.setViewport({
            width: 1906,
            height: 600
        })
}
Create a Kentik test
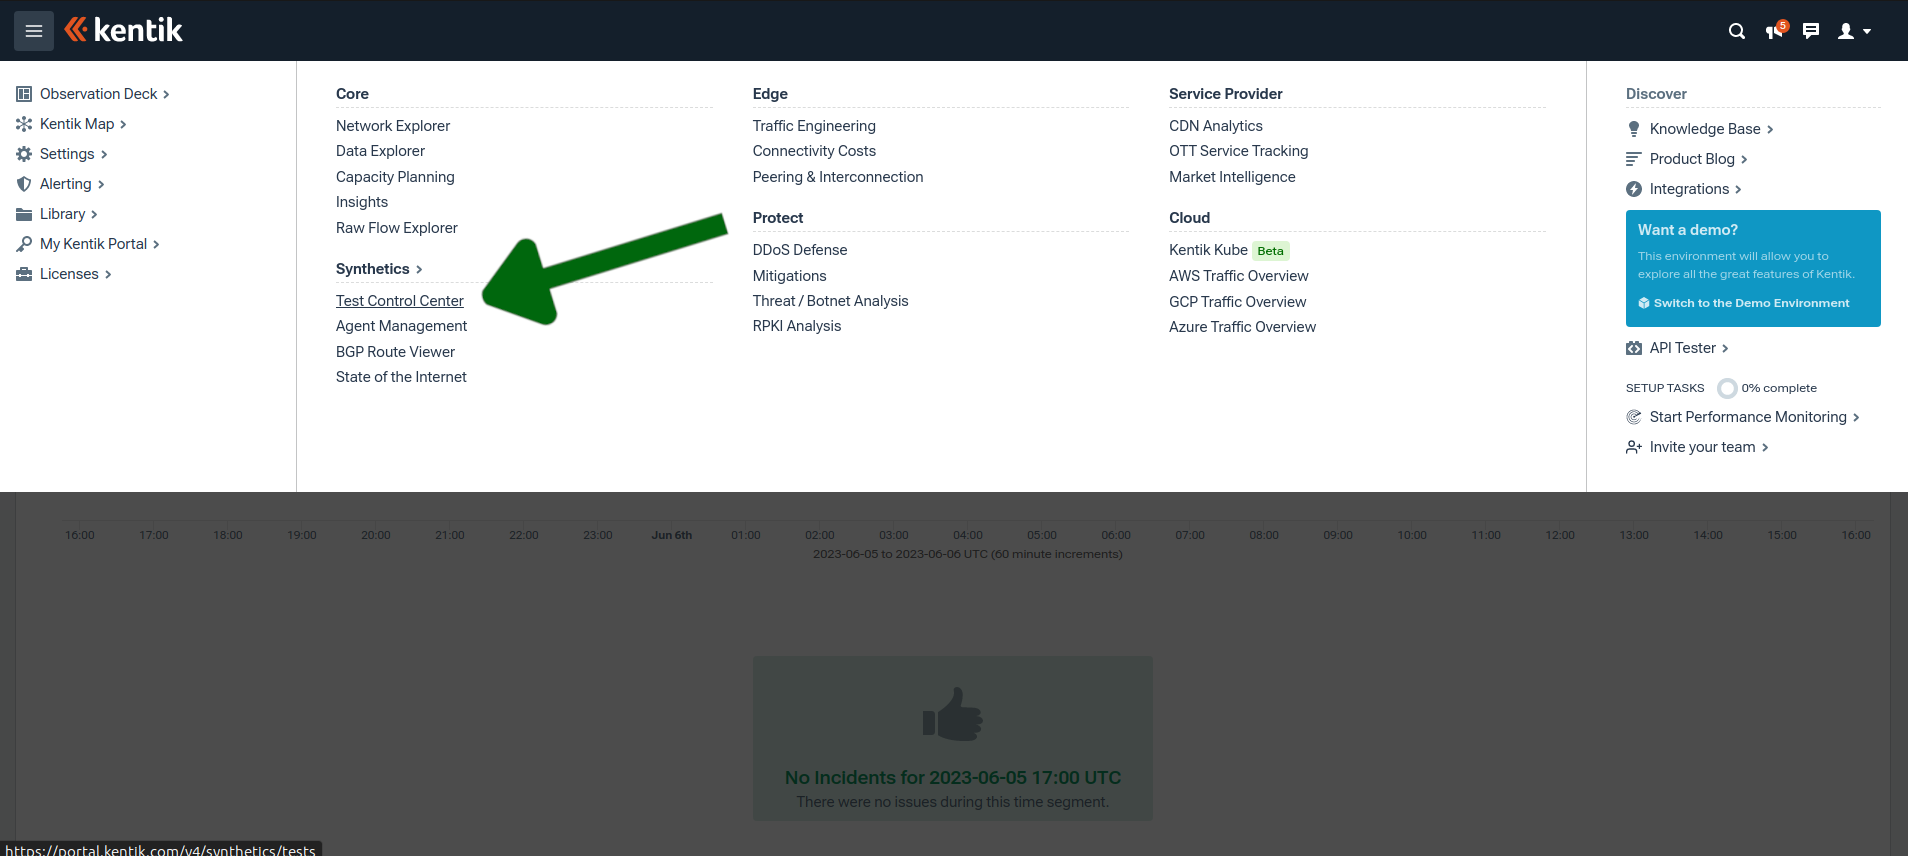
To create a new test, log into your Kentik account and navigate to the Test Control Center under the Synthetics menu:
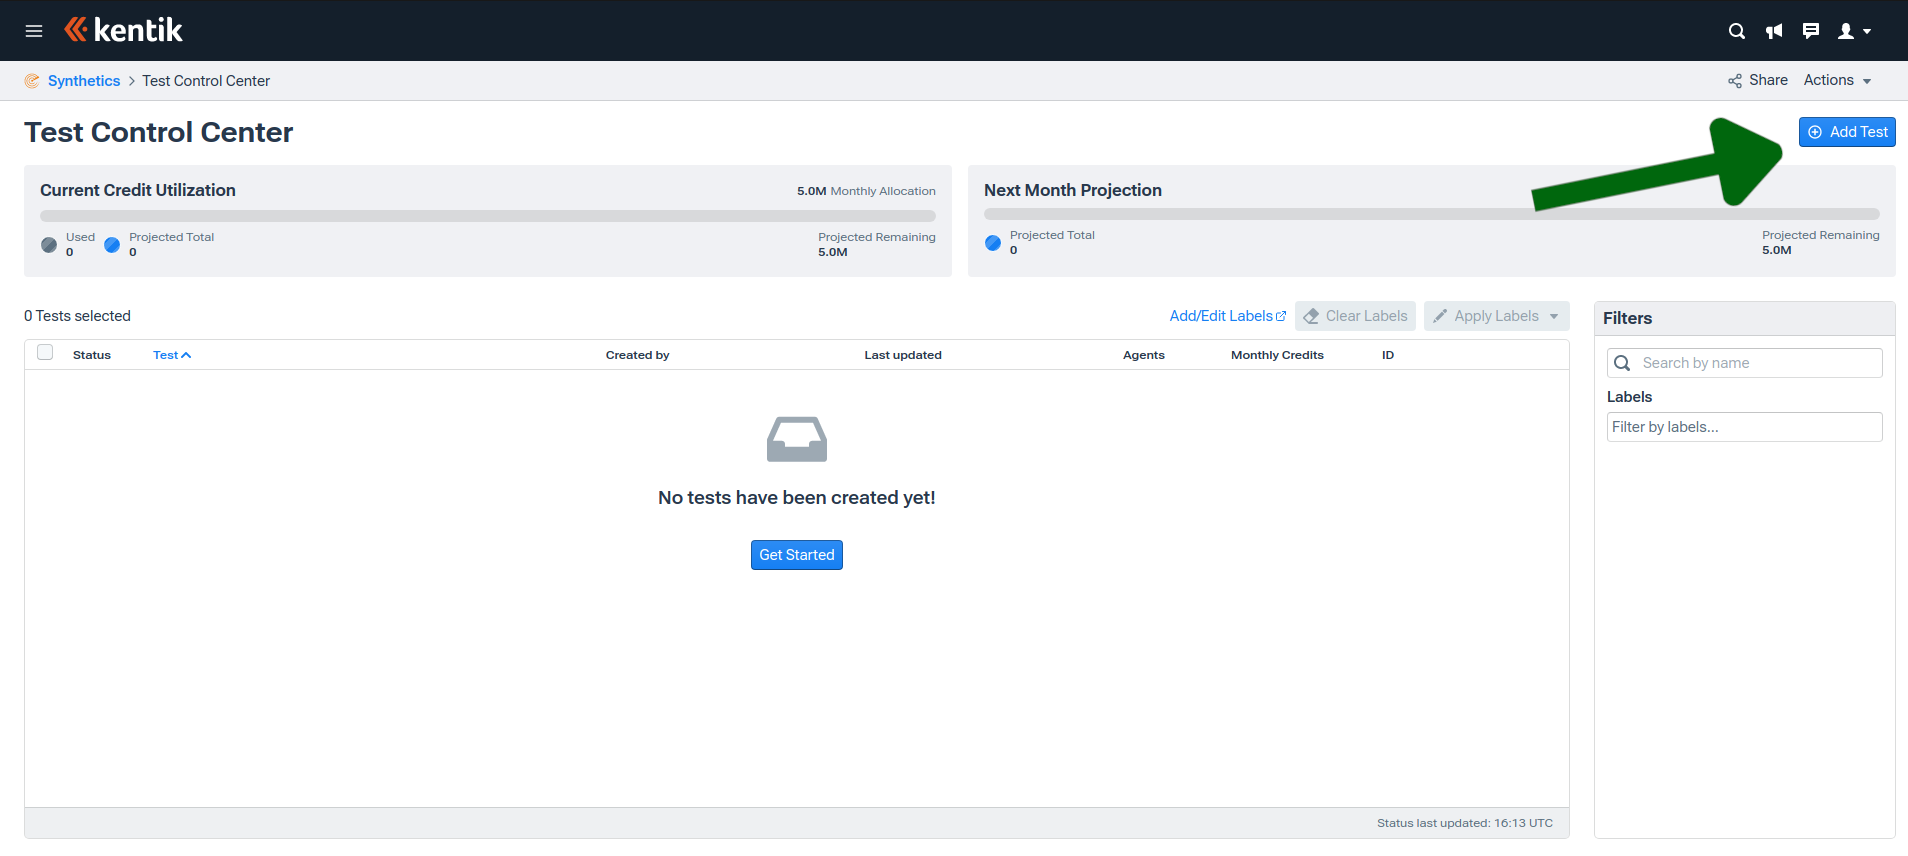
On the Test Control Center page, click Add Test in the top-right corner and select Transaction:
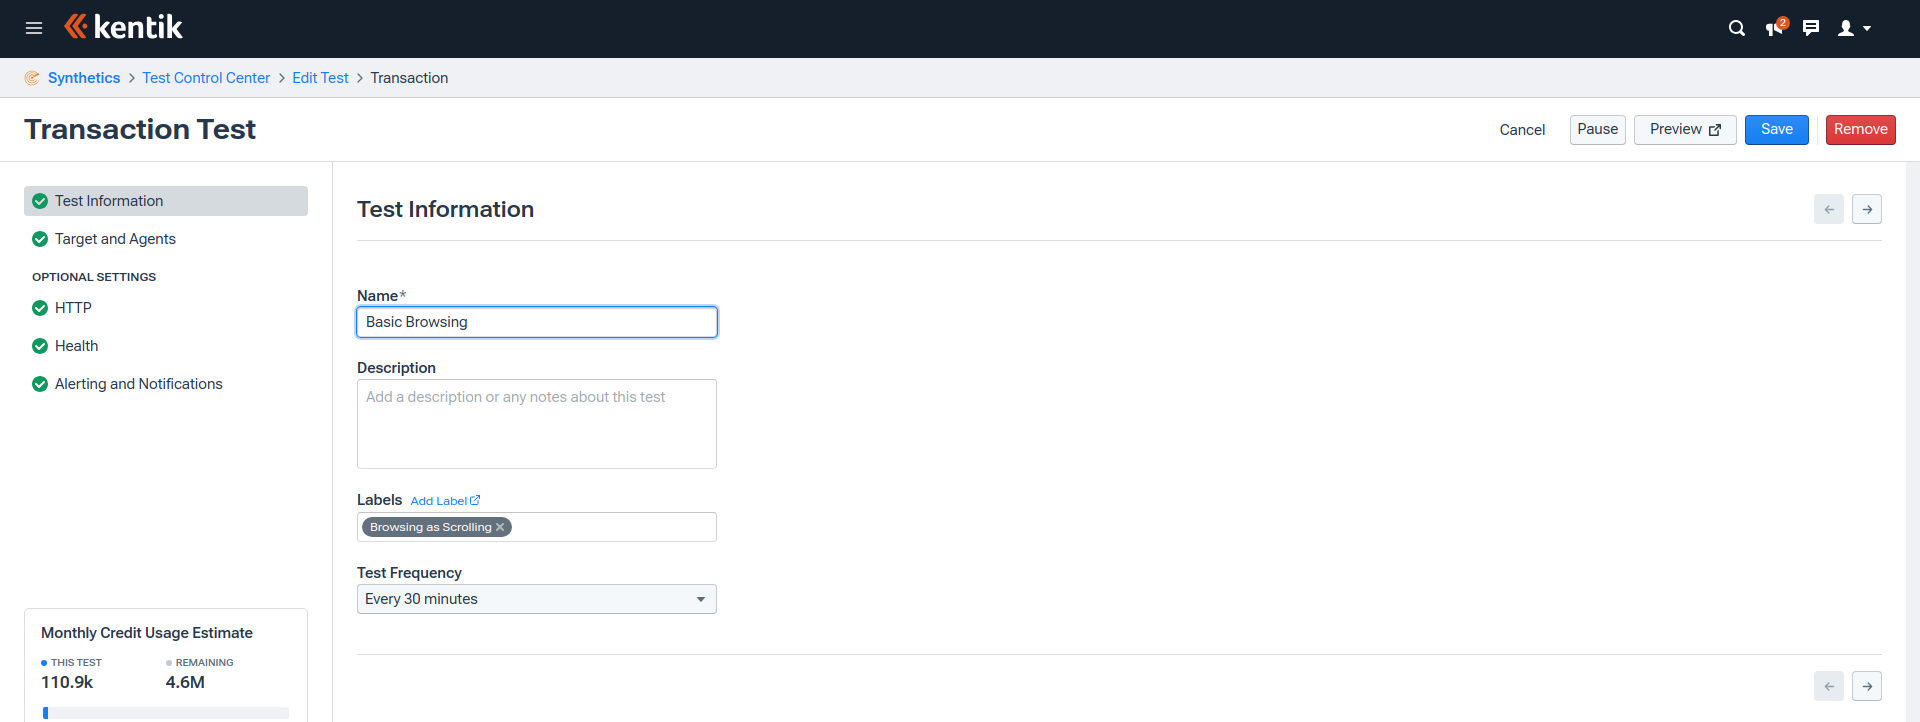
Now you need to enter the following basic information and test frequency:
- Test name: A name to identify the test. In this example, it is named “Basic Browsing.”
- Test description: A description of the test.
- Labels: You can create and assign labels for each test to help your group identify tests for future reference. In this example, the test is labeled “Browsing and Scrolling.”
- Test frequency: The period between each test. You can choose from five, ten, fifteen, thirty, sixty, and ninety minutes.
Target and agents
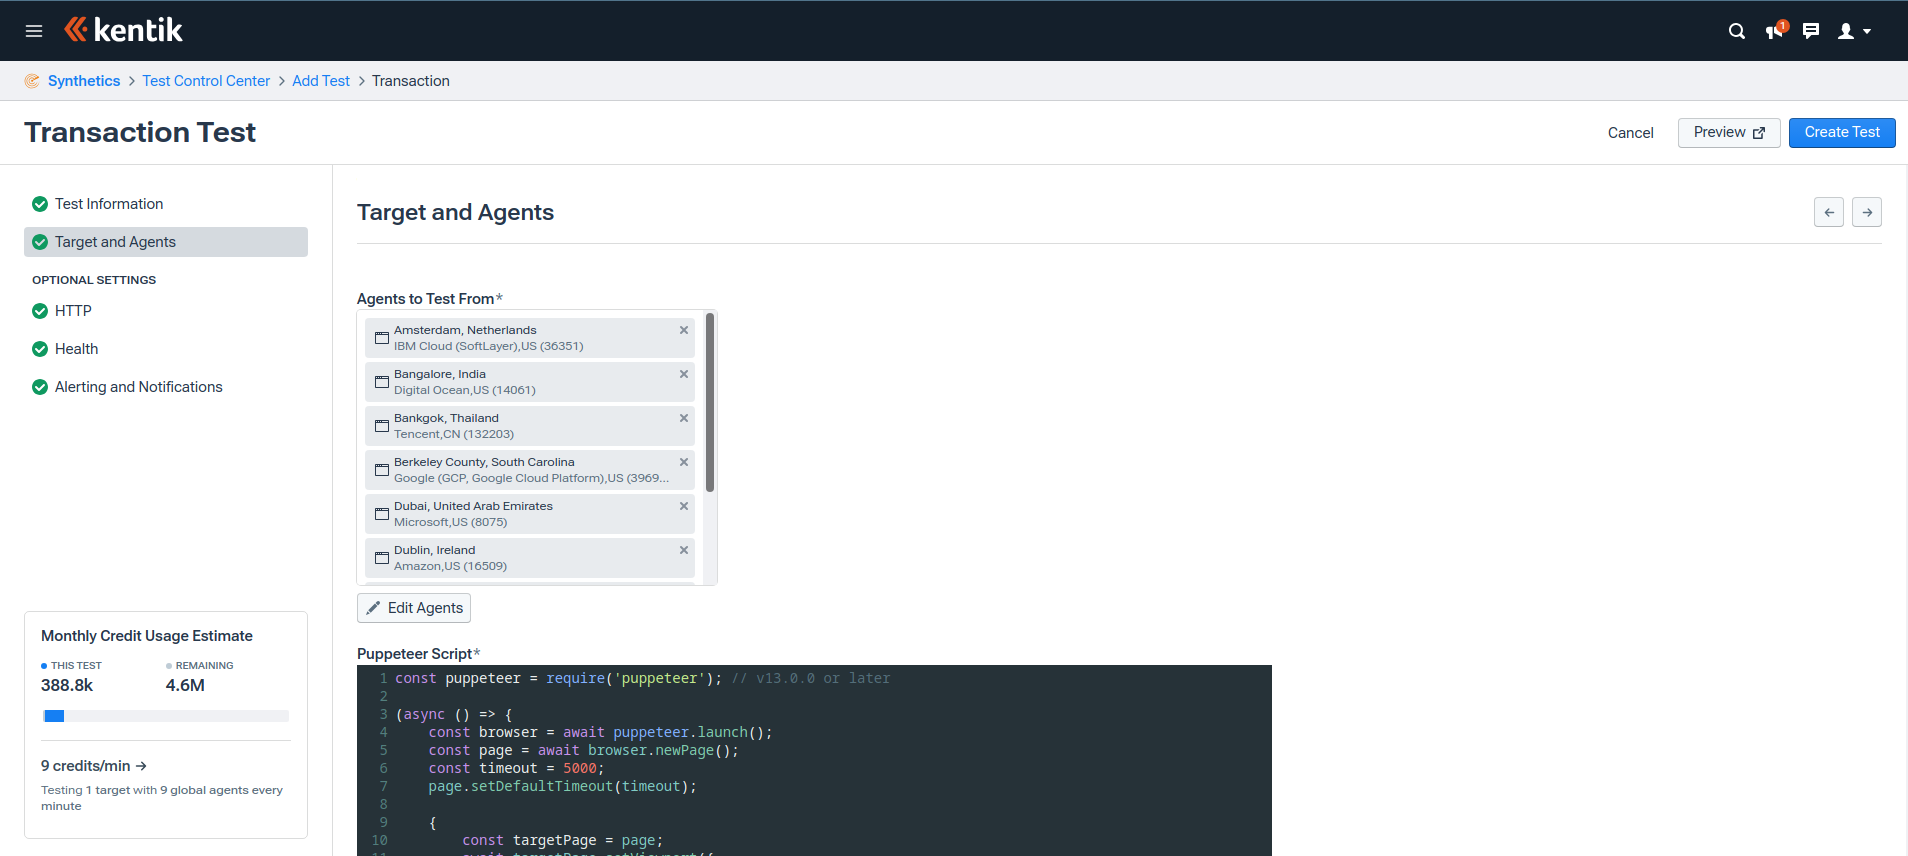
Test agents in Kentik are test servers maintained in various data centers worldwide. You can select agents from the geographic locations where most of your website users are from or from a location where you’re planning to launch your service.
Then paste the Puppeteer script you exported and customized from the Chrome DevTools Recorder:
Optional settings
The next three steps are optional settings that can help you customize the HTTP timeout, test health metrics, and alert settings.
If you want to create the test now to see how it works, you can skip these settings, click the Create Test button, and move to the Viewing the Test Results section. You can come back to edit these settings anytime by clicking the Edit icon next to the test in the Test Control Center.
HTTP requests settings
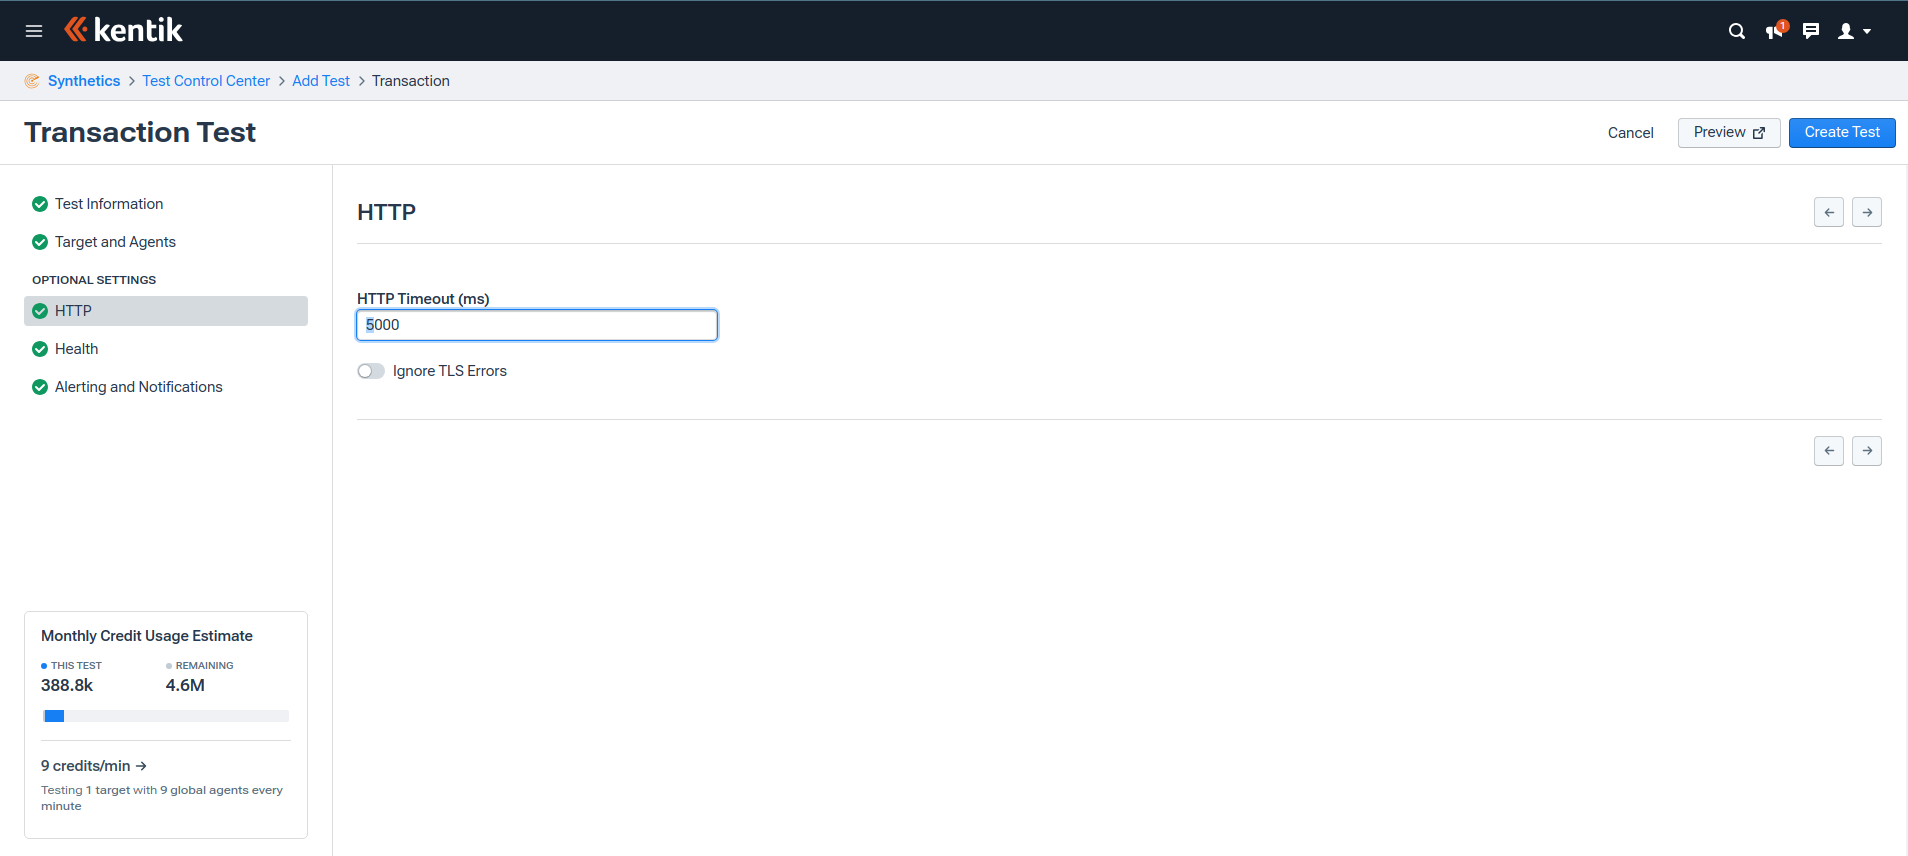
The HTTP settings enable you to set the HTTP request timeout and choose if you want to ignore TLS errors. The HTTP Timeout is set at 5000ms by default. If you’re creating this test for a staging or development environment, you can enable Ignore TLS Errors:
Health metrics
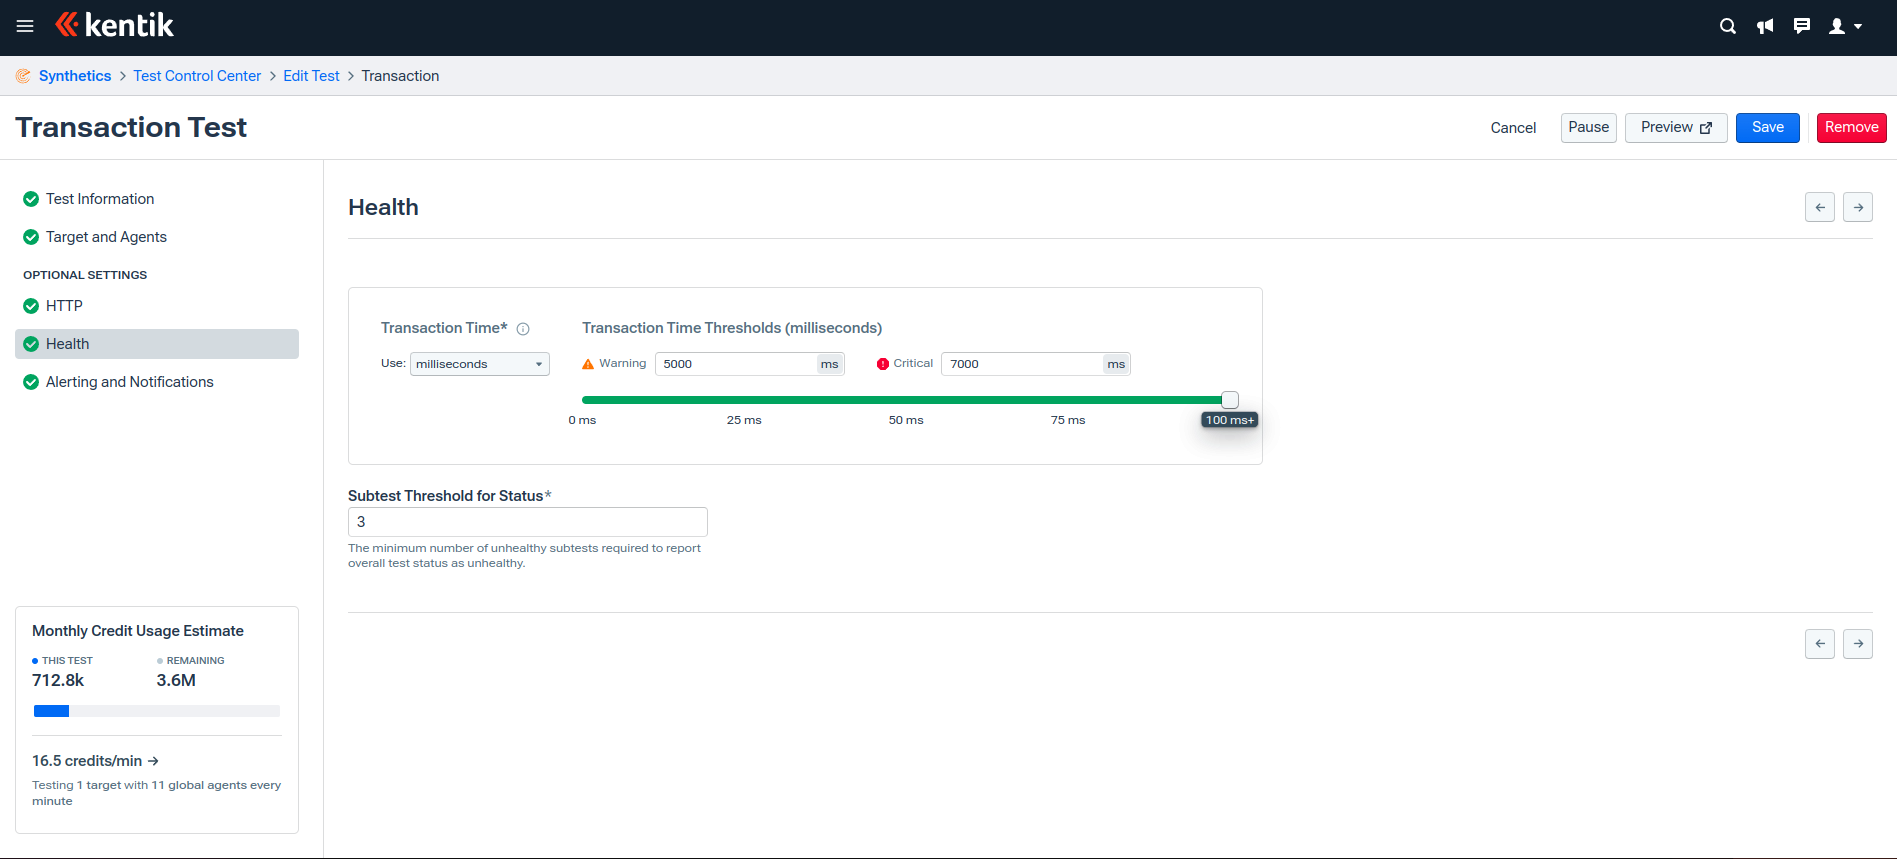
The health status of each agent subtest is divided into three categories: healthy, warning, and critical. Based on the length of your recorded transaction, you can set the Transaction Time Threshold on which the test status is measured. You can specify this threshold value either in milliseconds or as a standard deviation based on a baseline computed by Kentik. Then you can set the minimum number of unhealthy subtests to determine whether to classify the overall test as unhealthy.
Here, the threshold is set to five seconds for Warning and seven seconds for Critical. The test will be determined as unhealthy if three subtests exceed this time threshold:
Configure alerts and notifications
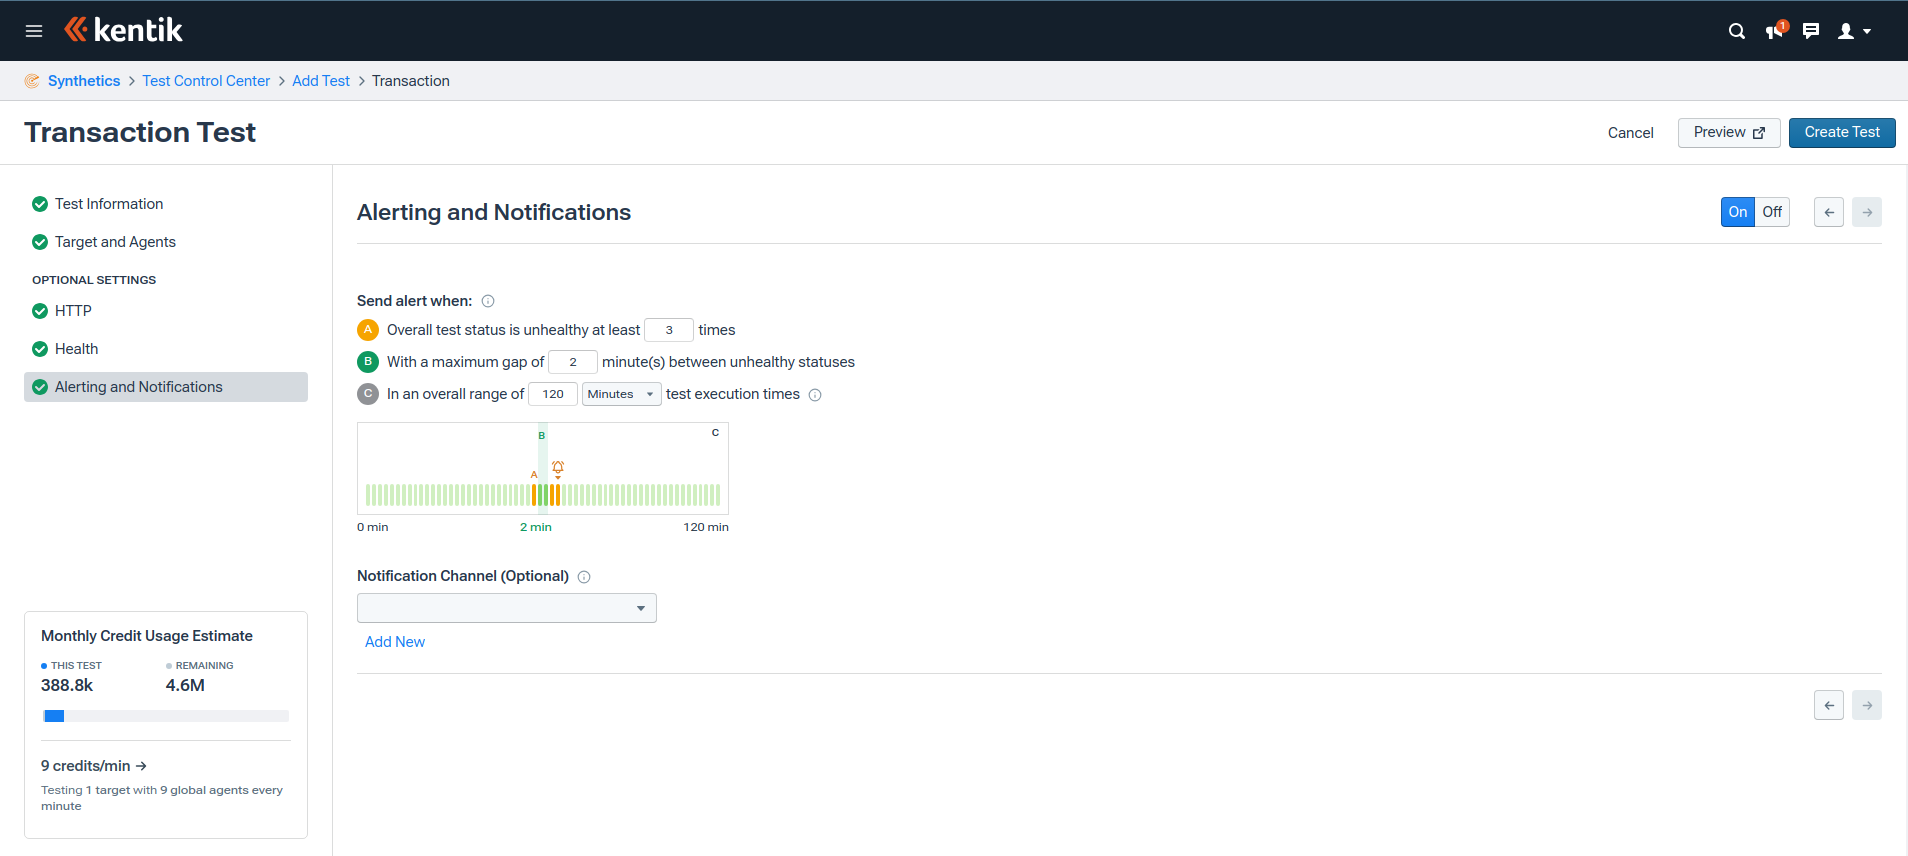
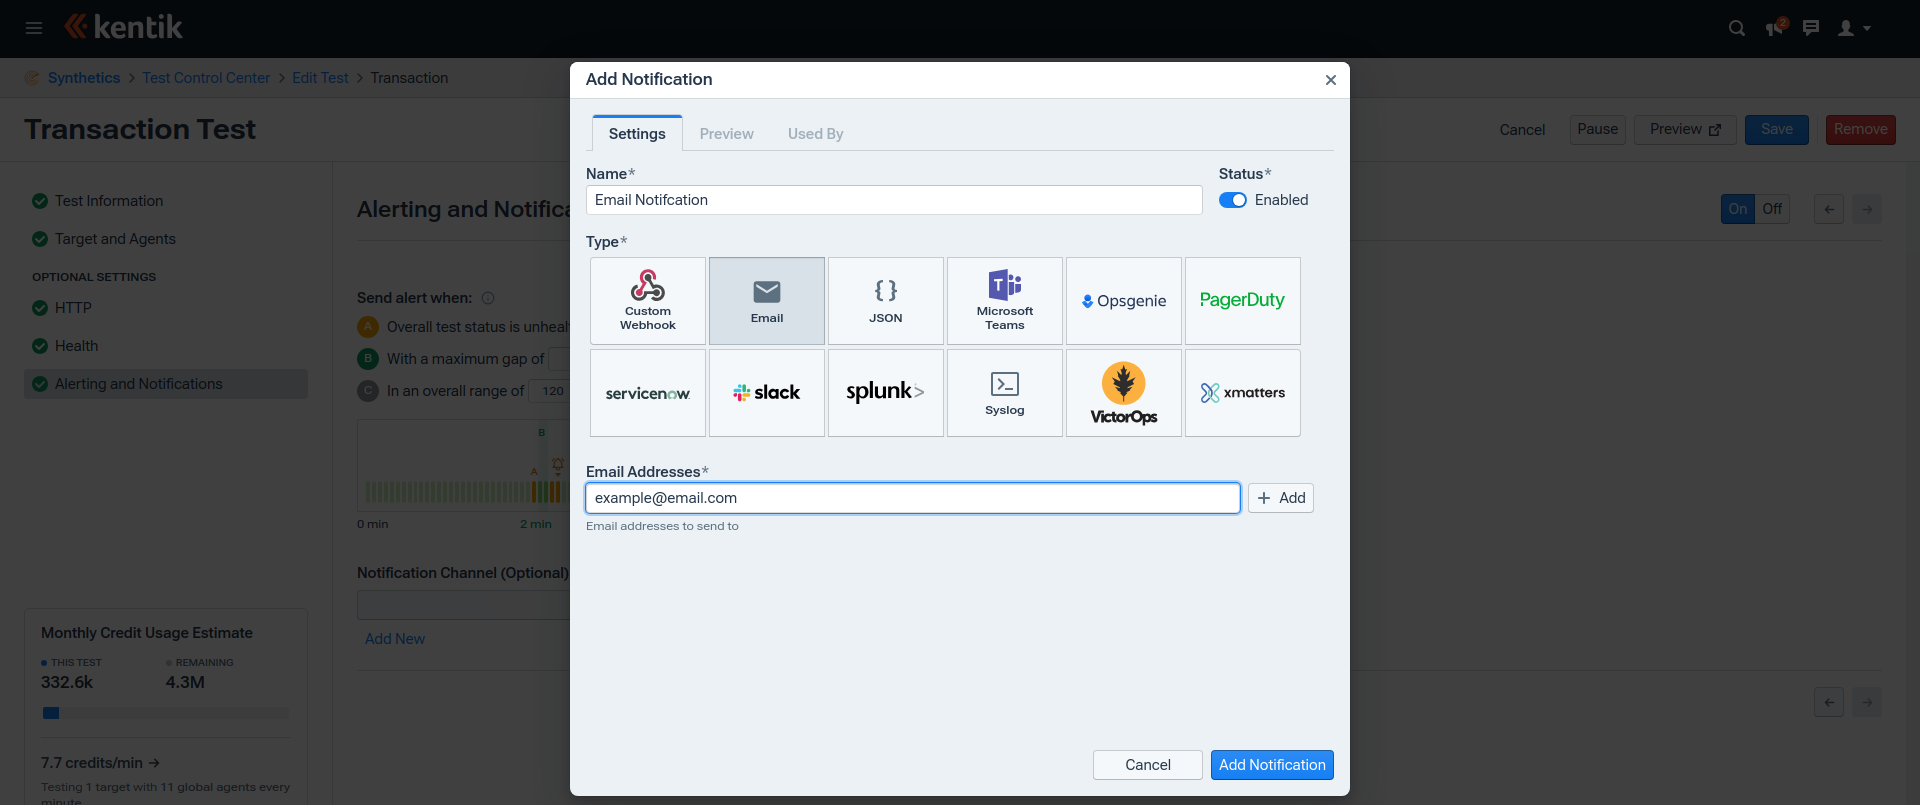
You can also set alerts and notifications based on the number of unhealthy tests, the time gap between them, and the overall time range of test execution. You can add your preferred notification channels from the available options, including Slack, Microsoft Teams, email, or custom webhooks:
Once you’ve curated your optional settings, click Create Test. You’ll be redirected to the Test Control Center, where you can see the test you just created. The test result will show as pending. Wait a few minutes until the first test is executed, and then open the Test Results page.
View and analyze the results
The Test Results page shows the latest test run using each assigned agent. The following are the metrics included for each test:
- Health status is based on the threshold set during the test creation.
- Total transaction time is the total time of the transaction.
- Transaction completion shows if the transaction was completed.
- Screenshots show the number of screenshots taken during the test.
In this sample result, one subtest failed to run, another exceeded the warning threshold, and one didn’t run:
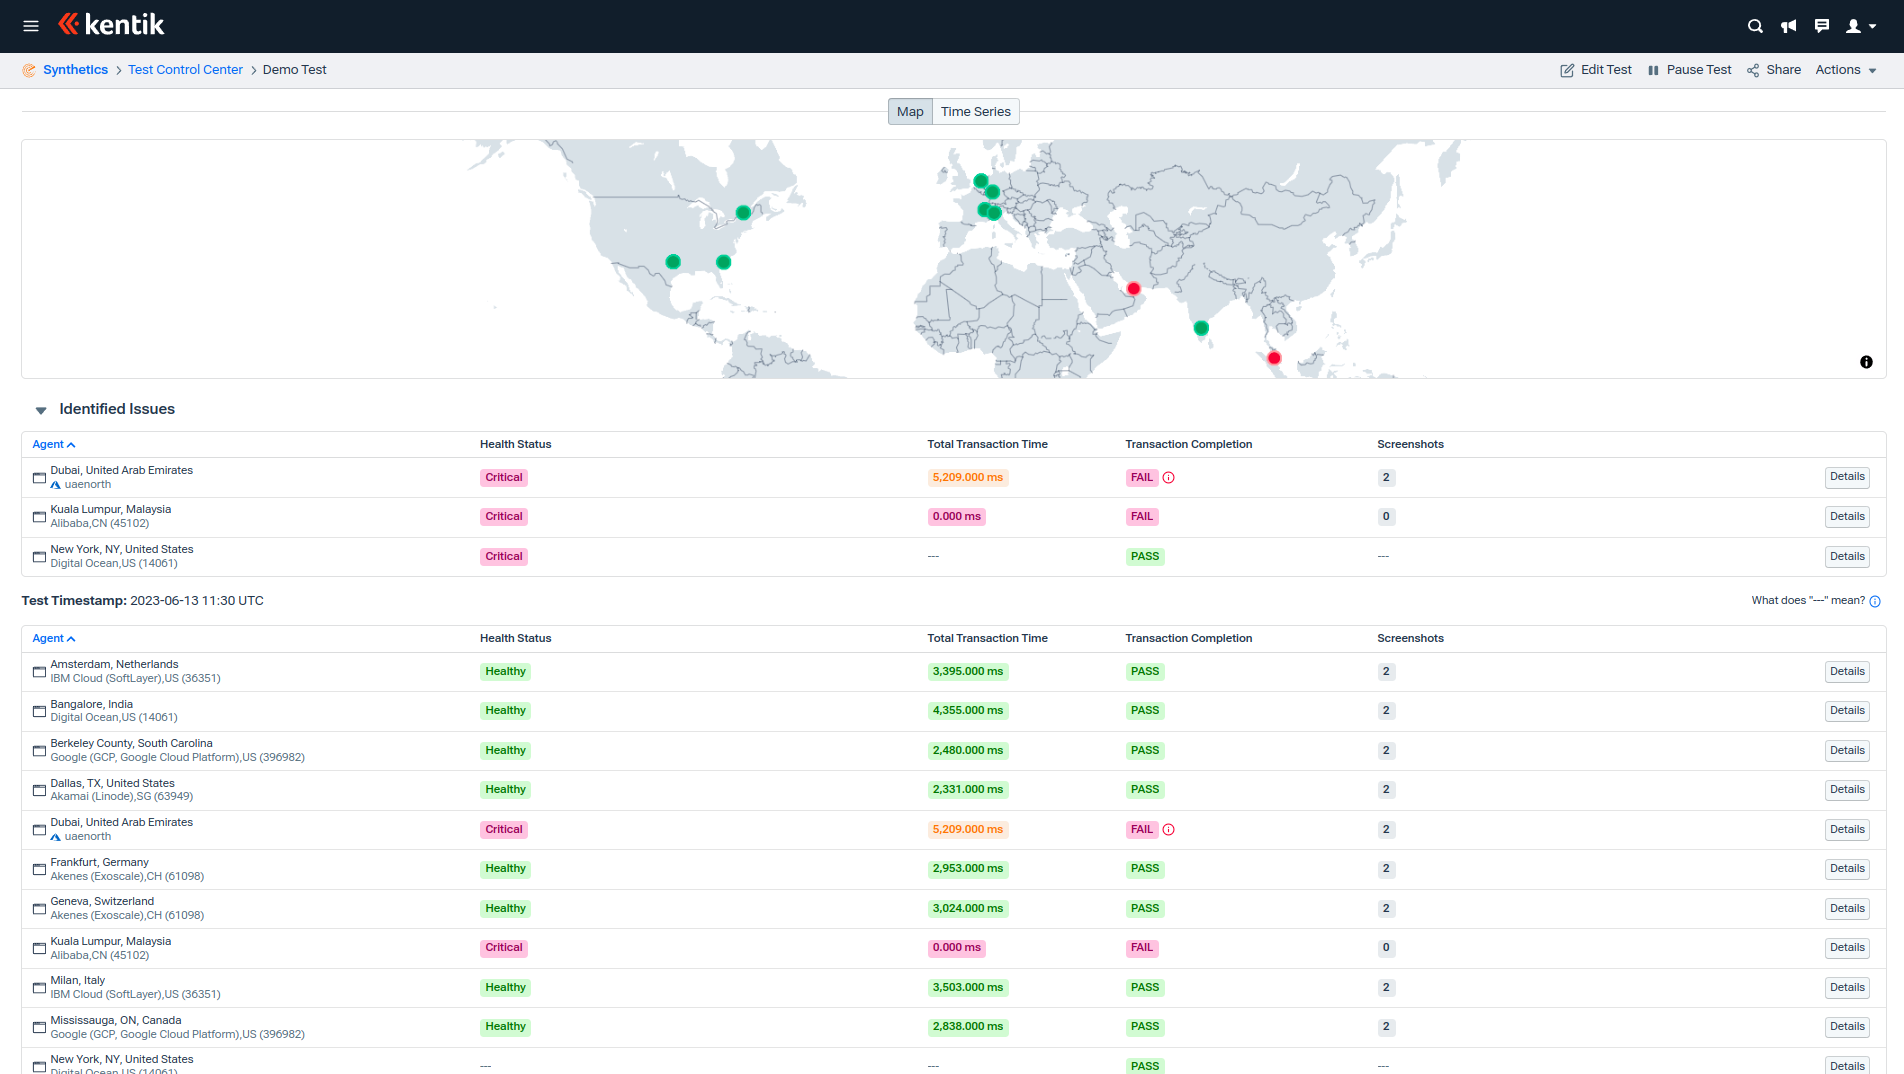
The health status of this test will appear as healthy because the number of subtests exceeding the threshold value was set to three, and only one subtest failed.
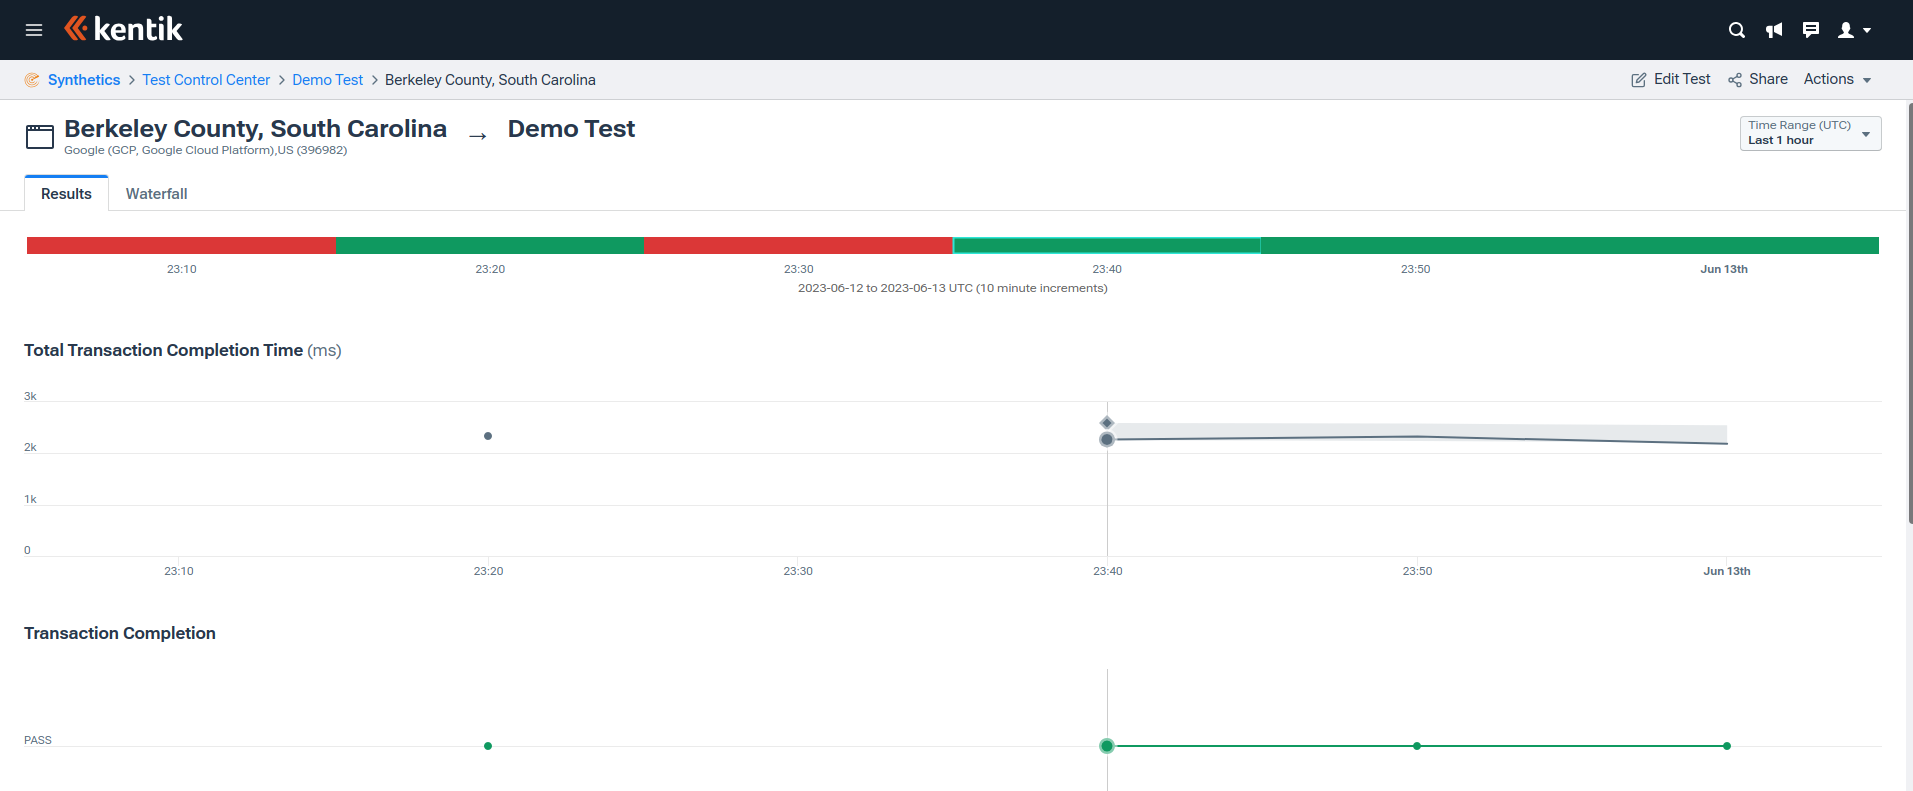
To compare test results over a period, wait for a few more tests to run, then switch to the Time Series view. This view shows the result of tests within a specific time range that you set in the Input field at the top-right corner. When you examine the test results within a time series, you can identify an issue if a test continually fails from a specific agent:
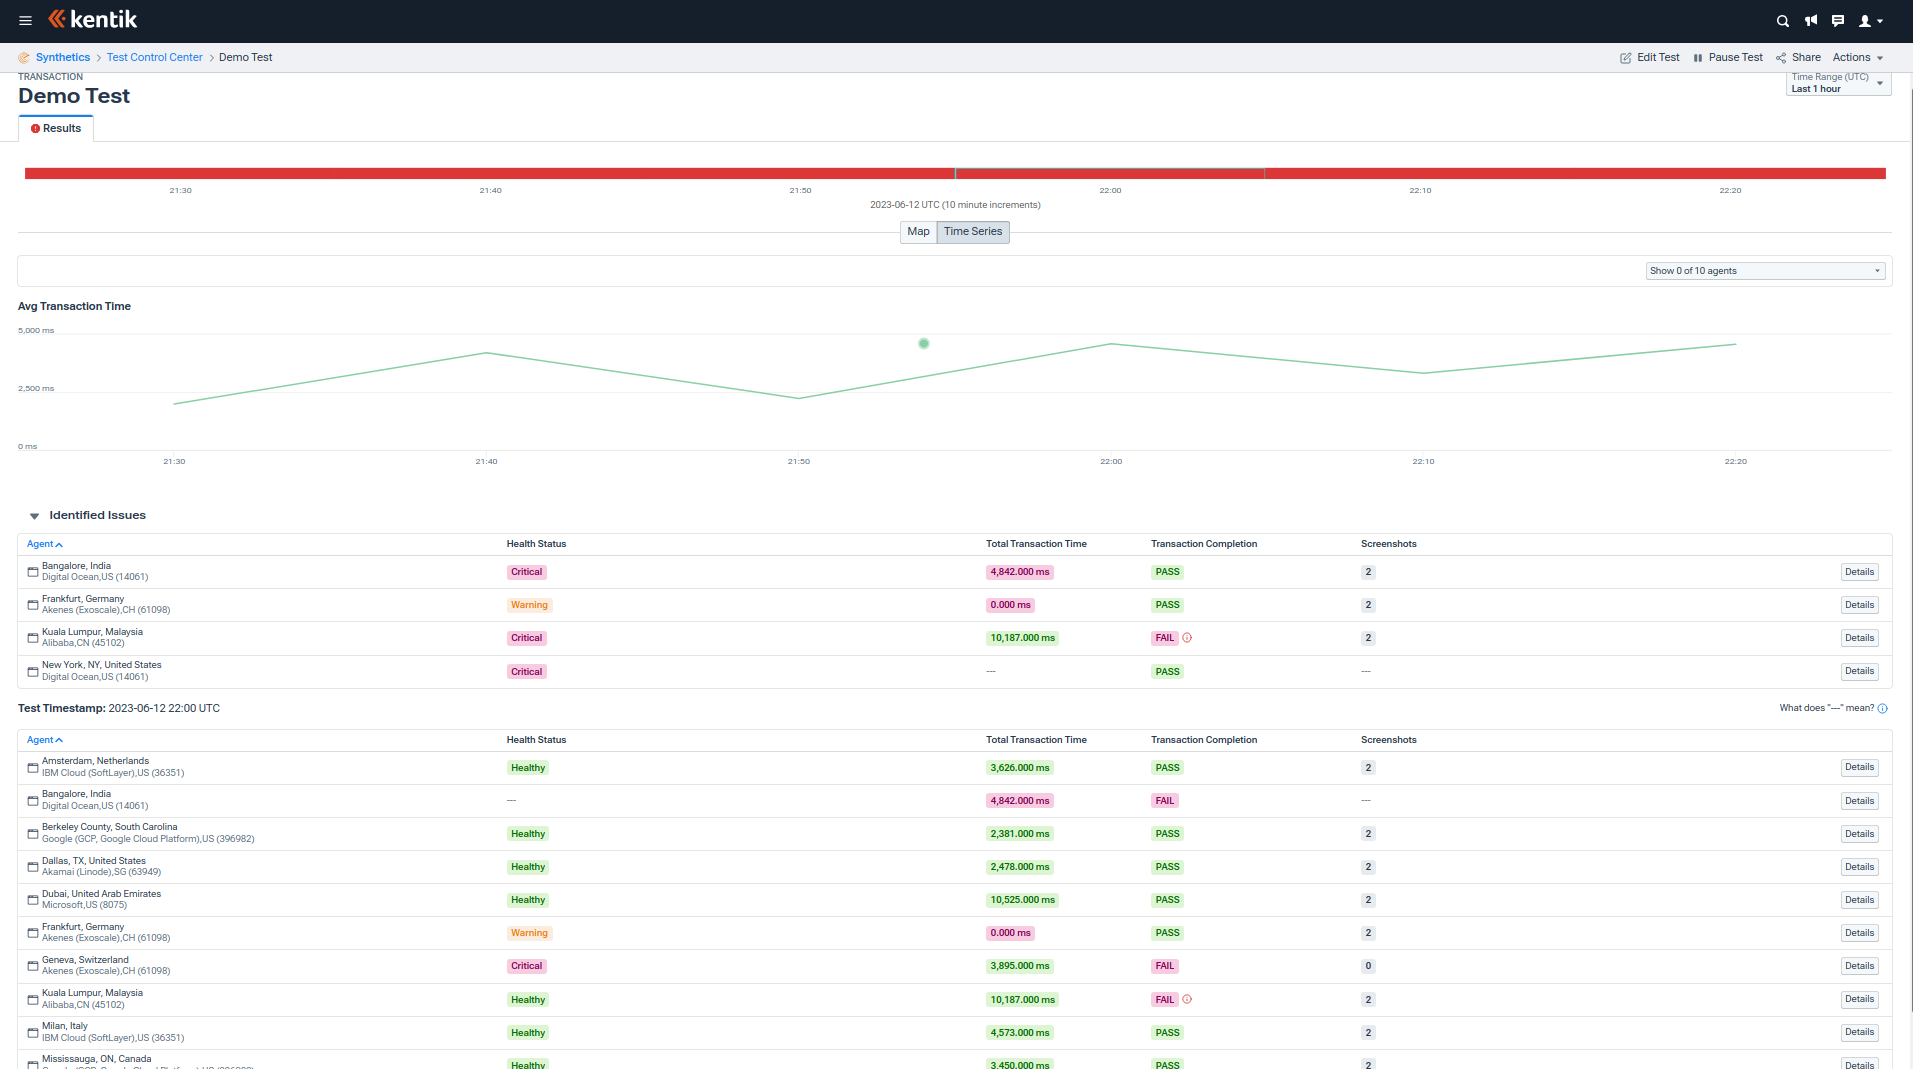
To view an individual agent’s test results, click the Details button. This page shows you the recorded transaction’s timeframe and the screenshots taken. In this view, you can identify performance bottlenecks and plan the appropriate actions to fix them:
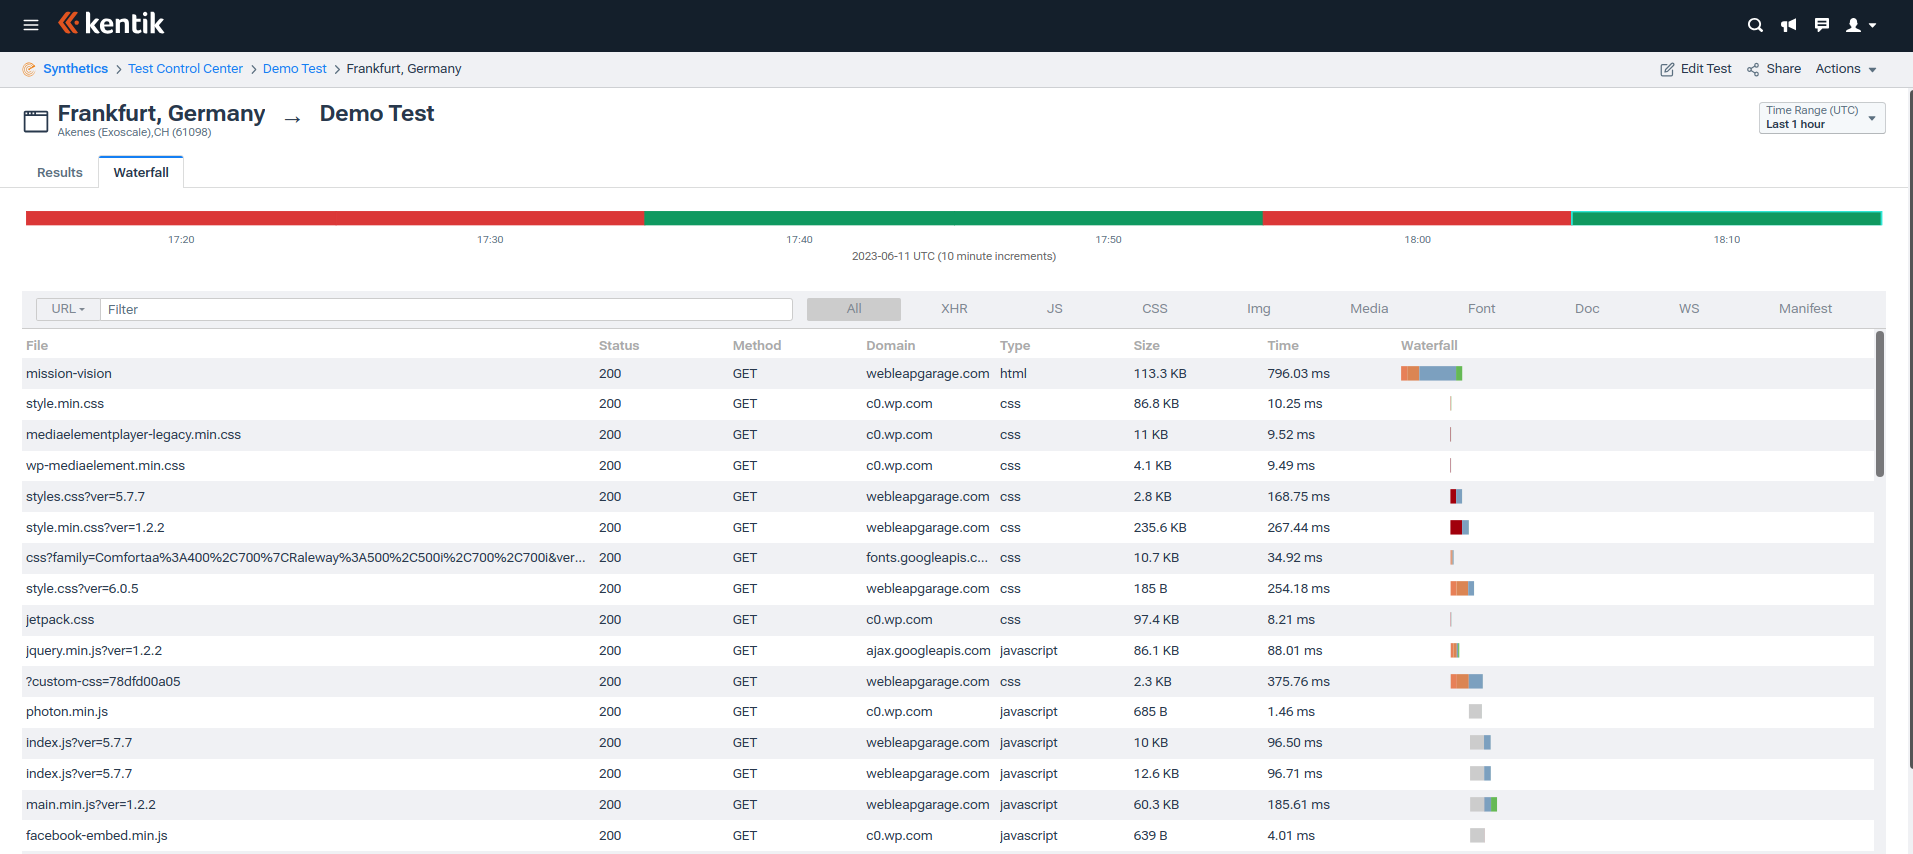
The Waterfall view (located in the menu at the top) shows specific data about all the resources loaded during the transaction test to help you determine if a particular resource is slowing the user experience:
To share the test result with your team members, you can turn on Alerting and Notification, one of the optional settings you went through while creating the test. If you skipped the optional settings, go to the Test Control Center and click the edit icon next to the test. Then click Alerting and Notification at the left side menu:
Conclusion: Web and transaction monitoring in Kentik
Transaction testing is a method used to monitor website performance based on realistic digital user experience transactions. Using the right tool can help you set up an efficient monitoring process that can help you improve your website or application.
In this article, you learned about the importance of website performance monitoring and explored how to set up transaction monitoring using Kentik, a cloud-native network observability platform. You also learned how synthetic transaction monitoring increases the observability of your system and detects issues as soon as they show up by monitoring the real-time performance of user transactions.
In the current market, improving website performance is crucial, and setting up a free Kentik account is an easy way to improve end-user experience and search engine rankings while staying ahead of your competitors. Kentik’s free trial comes with more than enough test credits to explore how synthetic transaction monitoring can benefit your own sites or apps.
Additionally, Kentik’s network observability solution can help your business improve its digital experience monitoring, peering and interconnection, clouds and hybrid connectivity monitoring, DDoS detection and network security, network troubleshooting, capacity planning, and network business analytics.

