Synthetics 101 - Part 2: Protecting and growing revenue with proactive monitoring
Summary
In the second post of this multi-part series, Kentik’s Anil Murty will share how Kentik Synthetics helps you proactively monitor applications and services and troubleshoot the root cause of issues faster.
In part 1 of our synthetics series, we looked at tracking network performance to drive better business outcomes. Here in part 2 of our series, we’ll dig into the very first and most basic business outcome of using digital experience monitoring (DEM). That is, we’ll look at how to protect and grow revenue by proactively monitoring the health, availability and uptime of your critical applications and services, so you can fix issues before your customers’ experience suffers.
Every type of business benefits from proactive monitoring
Whatever type of business you run these days, it likely has one or more digital components to it. And if these digital components involve interactions with customers, then your business directly depends on them being responsive and performant. If your “customers” are internal employees, then slow applications or services lead to frustration and interruptions, impacting business operations and productivity. If they’re external customers, slowness can lead to direct loss of revenue. Let’s look at some examples of the way Kentik’s customers, including network engineers, operators and administrators, in different organizations (corporate, digital businesses and service providers) use Kentik Synthetics to ensure their customers get the best digital experience.
Corporate IT teams
Monitoring SaaS applications proactively
Think about the various applications you use today for your daily work: two out of three (if not more) are likely software-as-a-service (SaaS) applications. Apart from reducing the amount of capital expenditure (CapEx) cost that a company needs to take on, the SaaS delivery model has done amazing things for worker productivity. It significantly shortens the time it takes to onboard new employees to the organization, ensures the right level of access and security (through SSO), and provides the best features (through auto-app updates). The challenge, though, is that for the network teams that have to support the organization, the burden of ensuring connectivity and quality of service shifts from the local/controlled network to the local/controlled network plus the “general internet.” Throw remote work into the mix, and the challenge becomes even more daunting.
When an issue occurs, the first question on the corporate IT team’s minds is: “Is it us? Or is the <insert SaaS application name> down for everyone?”
To simply answer this question, Kentik runs synthetic performance tests to the most common SaaS applications, from 15 global locations, every minute and makes this data available to all Kentik customers for free!
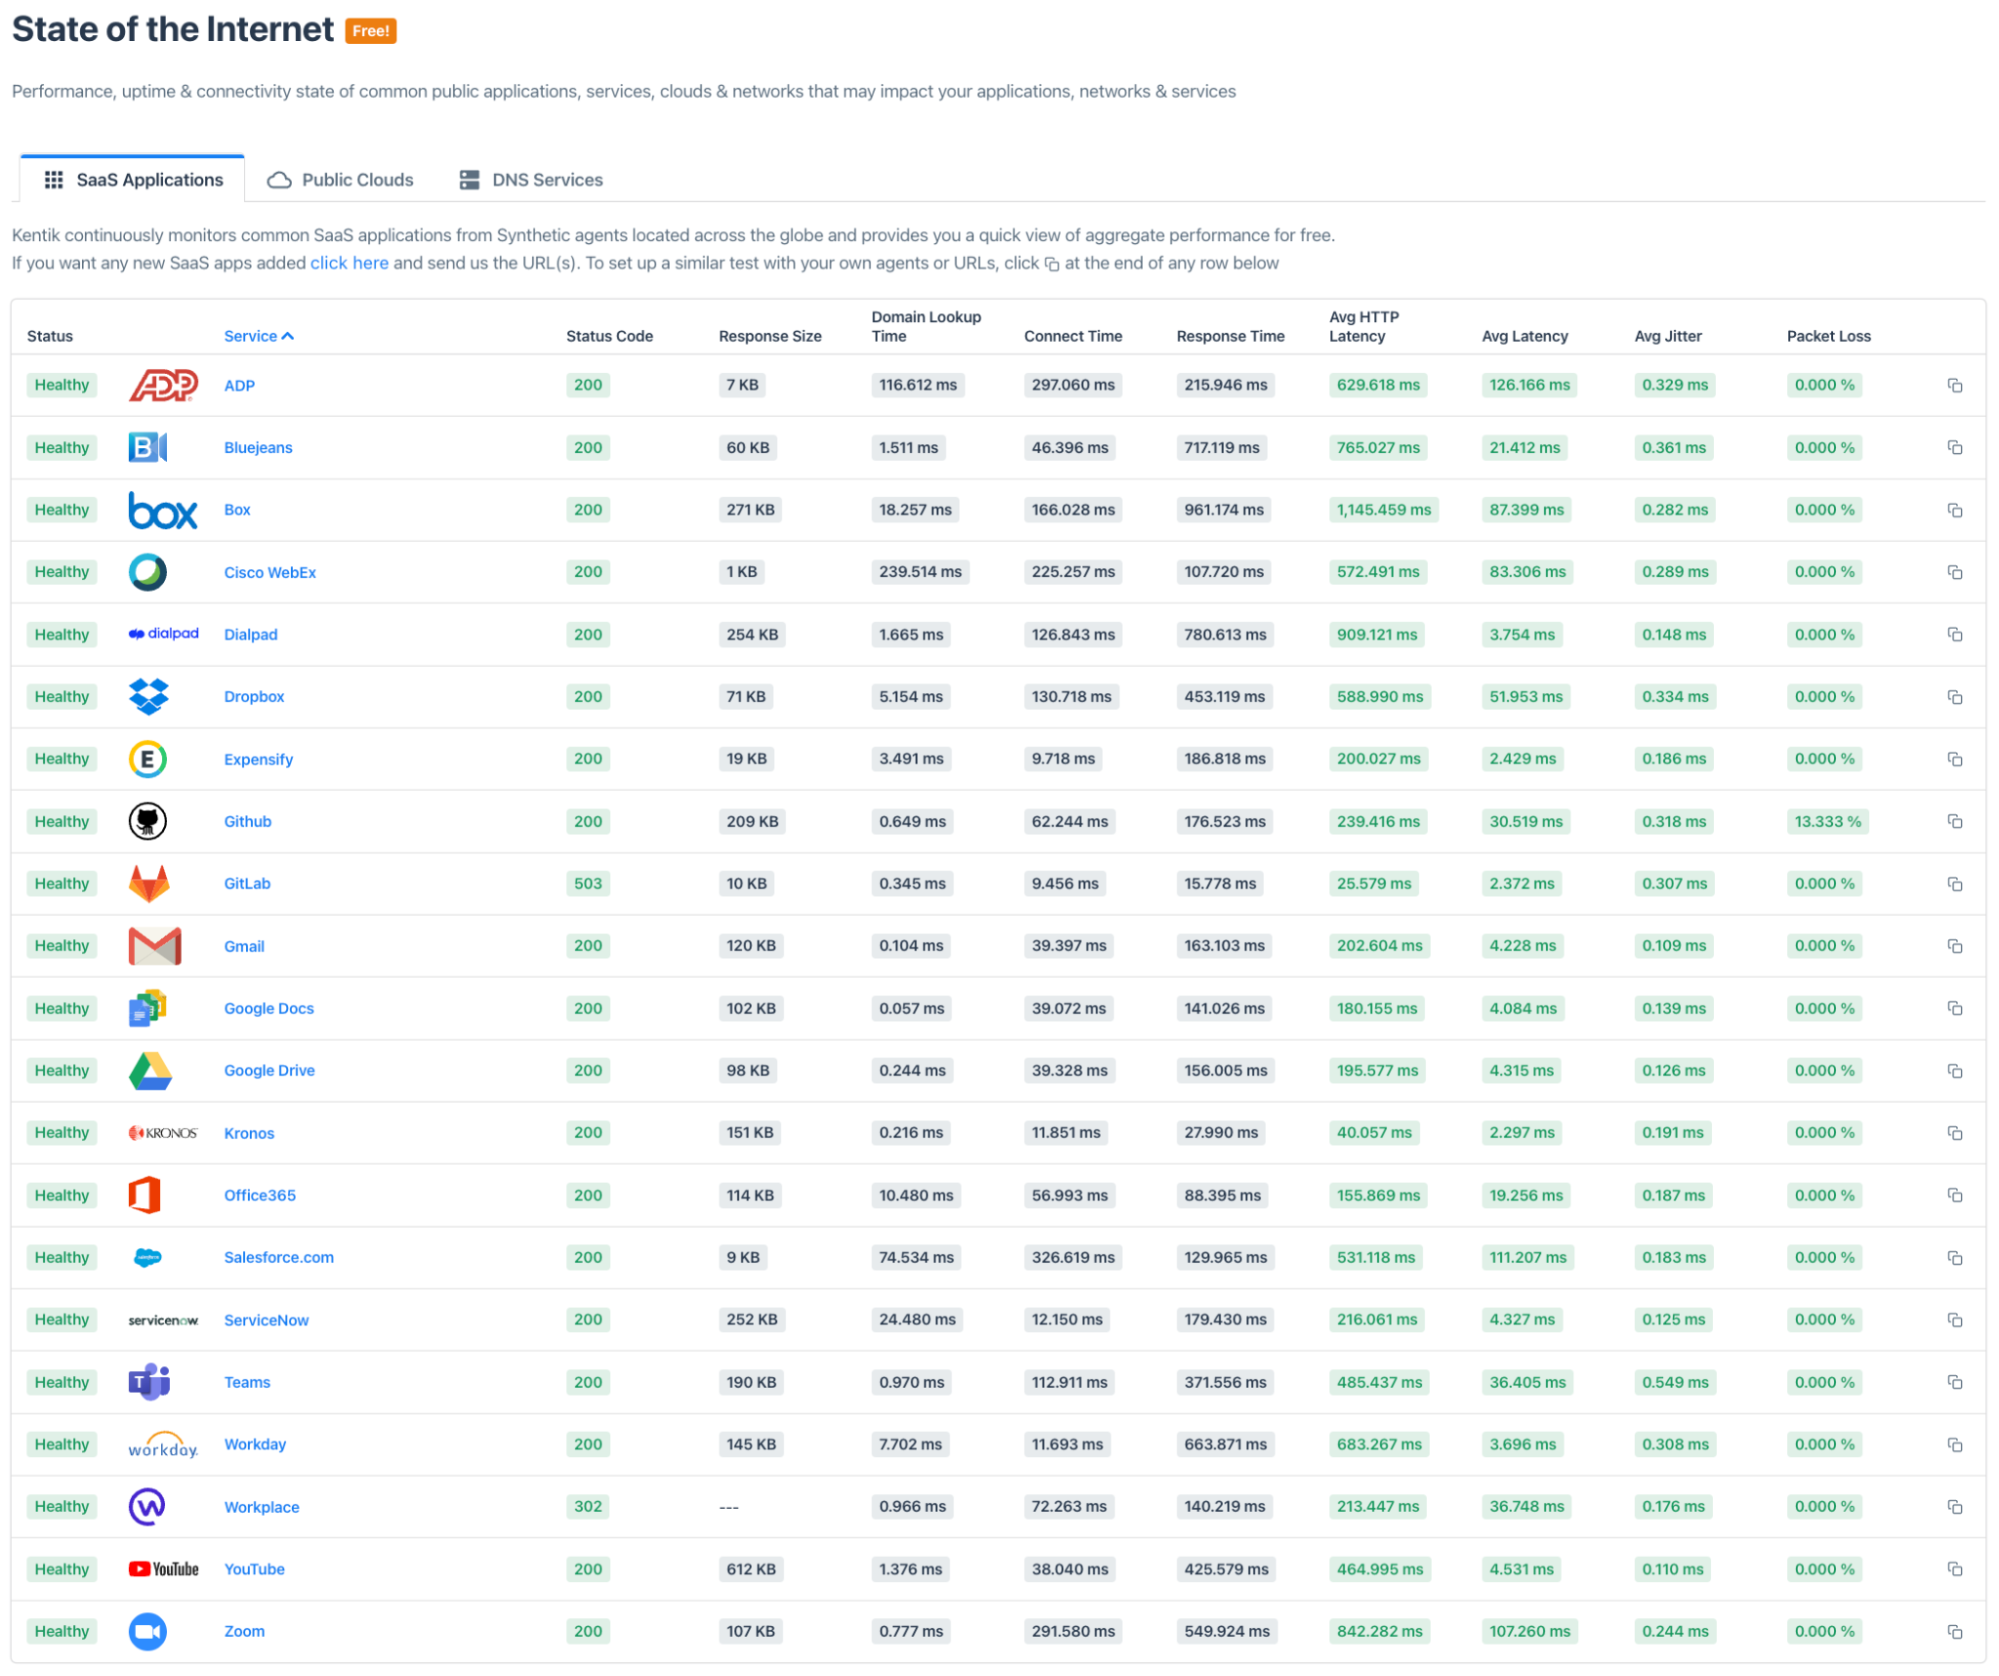
Each test above is performing a GET request to the HTTP endpoint that the user (employee) would access for the specific application. In addition, the test is also performing a network layer (ICMP ping + traceroute) to the IP address resolved for the host that the HTTP server is running on or behind. If any part of that stack (network, DNS or HTTP layer) slows down or fails, the test catches it immediately and is able to show you whether the failure was due to the network or at a higher layer.
Monitoring VPN connectivity proactively
With the rise of remote work, VPN connections have become critical to connecting employees to mission-critical applications. Suboptimal network paths to a VPN gateway can impact network performance, which in turn can cause employee productivity to suffer.
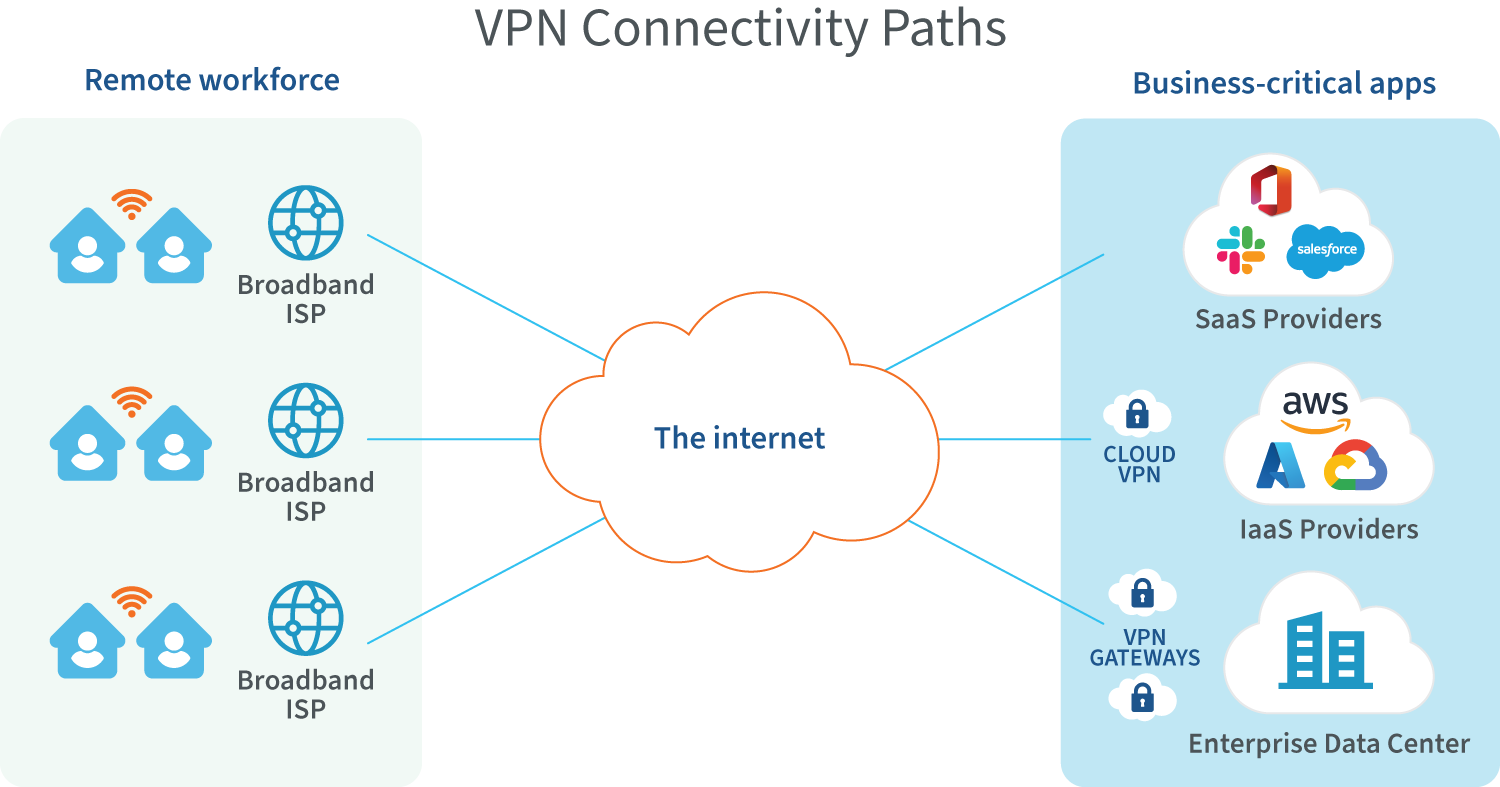
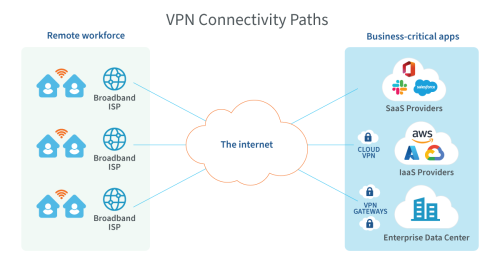
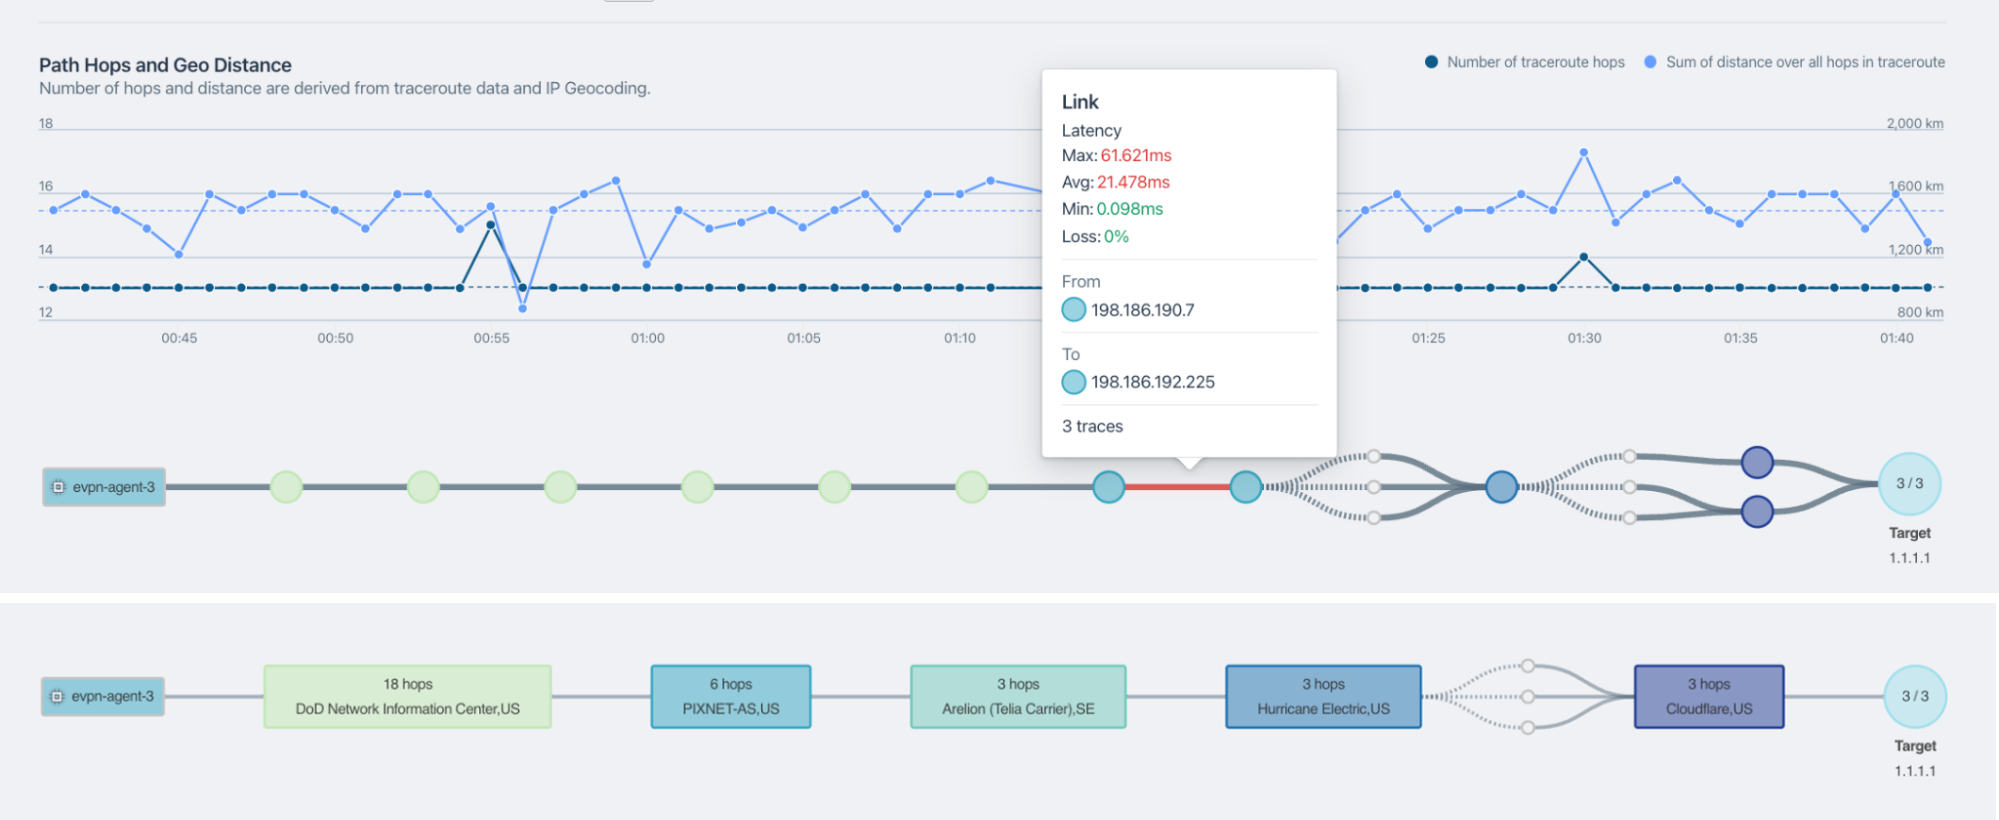
Kentik offers both private and public agents that can be used to test connectivity from the VPN gateway to the upstream services, as well as from the VPN gateway downstream to agents located in the broadband ISP networks where the employees reside. In addition to running IP connectivity checks, these tests also provide a view into the paths that the packets take and show points of failure or slowness (grouped by ASN) so that you know who to file that ticket for!
Digital enterprises
Tracking and optimizing page-load time
Research from Google indicates that as page load time increases from one second to 10 seconds, the probability of a mobile site visitor bouncing increases by 123%. Further, the probability of bounce increases by 32% when page-load time increases from one second to three seconds. Think about that. A mere two seconds of slowness could potentially be costing you one-third of your potential new customers. Page-load delays cost you money! Stay ahead of them with synthetic monitoring:

Troubleshooting root cause of end-user latency
Large web-scale companies like our customer Dialpad rely on a global network of data centers to ensure that their end users experience the minimum amount of latency possible when connecting to their voice and video services. They use synthetic tests to monitor circuits from their data centers to customer locations. Doing so not only lets them get alerted as soon as latency increases between their data centers and customers, but the traceroute-based path view lets them quickly get to the root cause of the problem. In Dialpad’s case, one of their carriers was routing traffic from Hong Kong all the way to the U.S. before sending it back to India, which significantly increased the latency their users experienced getting to Dialpad’s service.

Service providers
Monitoring PoP-to-PoP connectivity and performance
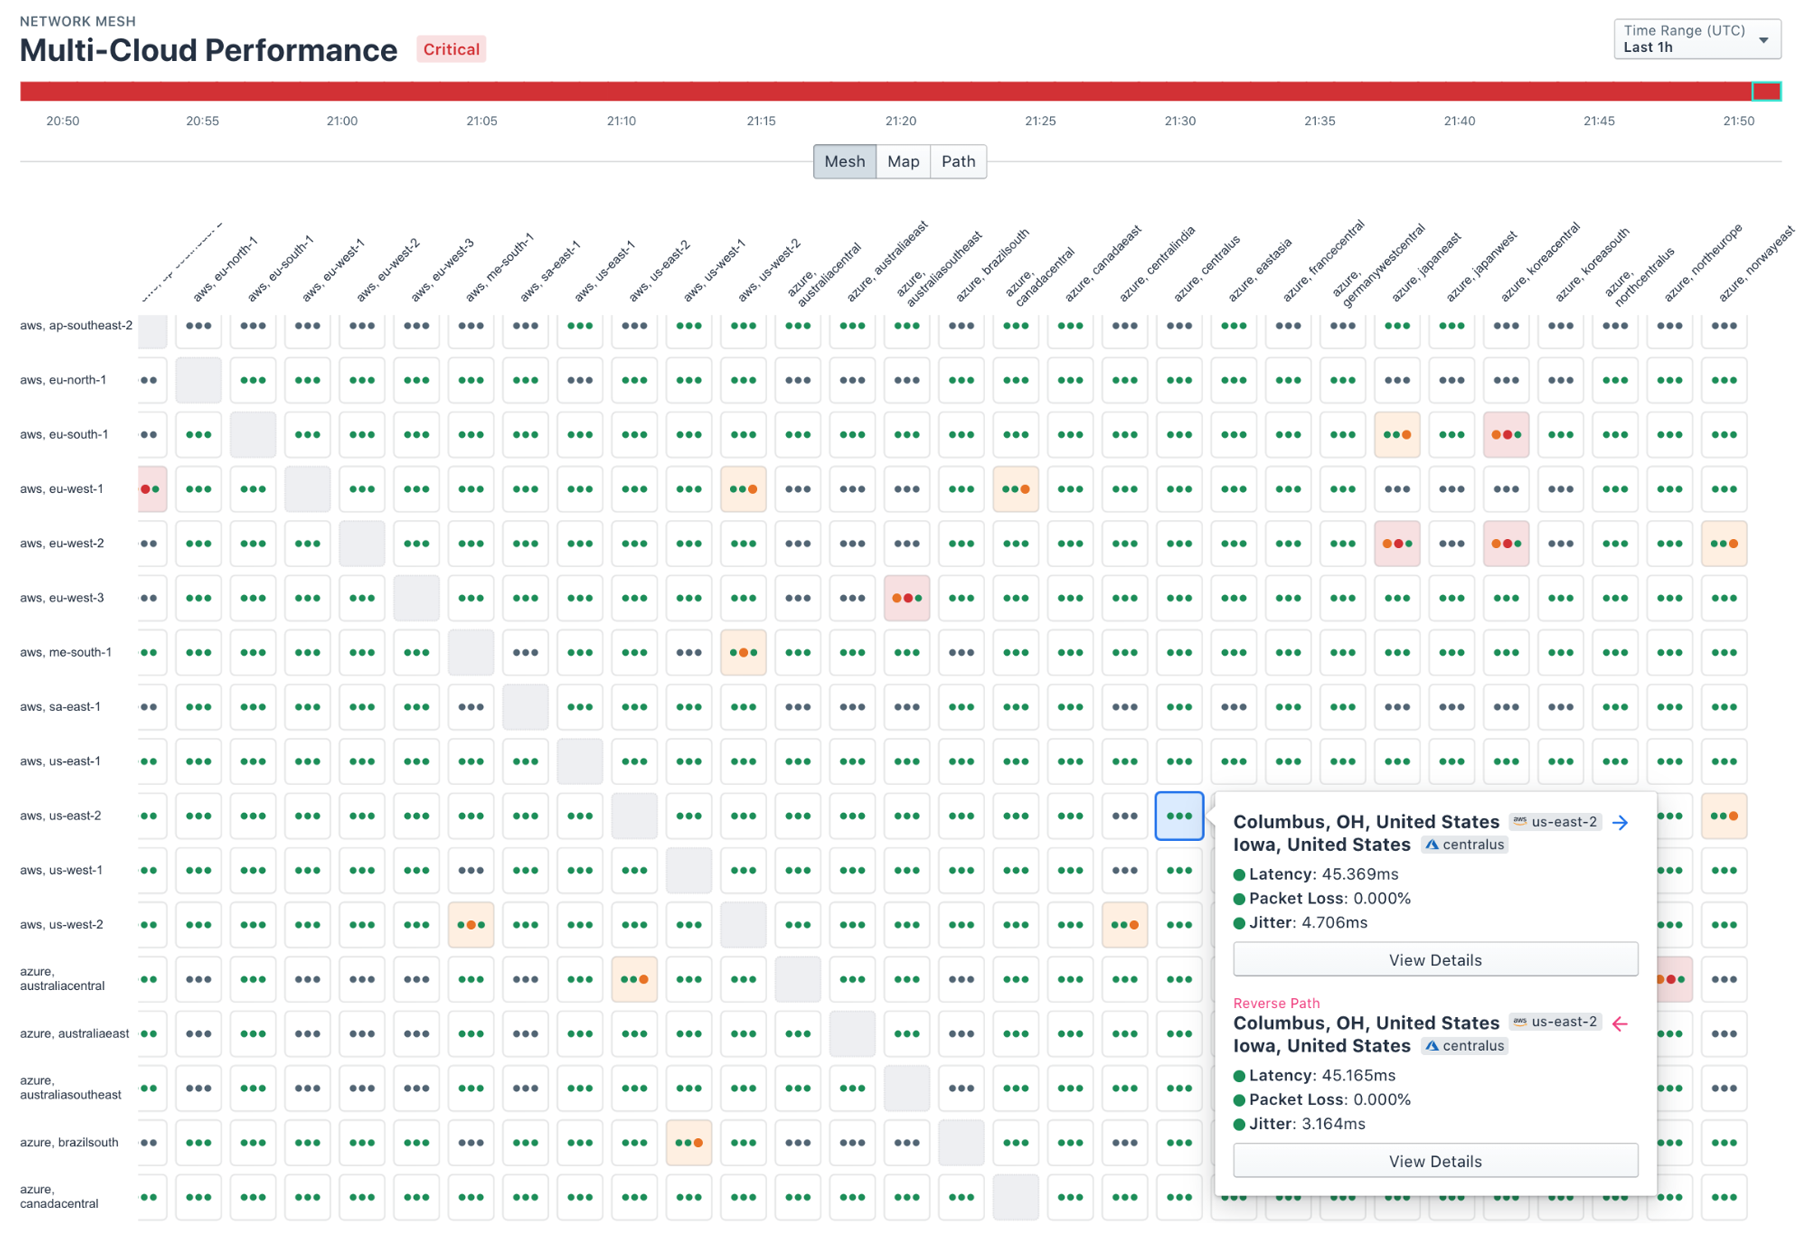
Service providers with tens if not hundreds of global points-of-presence (PoPs) need to know when connectivity between any of those PoPs suffer and, if so, they need to be able to quickly know where the point of failure is and who is responsible for it (what device, which network, etc.). Traditionally, the challenge has been that setting up such tests can be tedious and the results (which can be hundreds of test results) can be overwhelming. High-density meshes, like the one shown below, are a great way to get a bird’s-eye view of PoP-to-PoP performance across all PoPs while quickly being able to zoom into points of failure.
Monitoring performance based on traffic (autonomous testing!)
As a service provider with “on-net” CDNs, transit and peering routes to other ASNs, and user traffic to various parts of the world, it can be overwhelming to know where to focus your proactive-monitoring tests. Being able to see traffic patterns to know where the most user traffic is coming from and going to can help in this situation.


While that in itself reduces the time needed to plan tests, imagine if the platform was smart enough to not just recommend setting up tests to specific locations, but to also help set up and maintain such tests? This is essentially the idea with autonomous testing. Kentik’s platform identifies pingable targets within the target network destination you choose, sets up tests automatically, and then refreshes the tests periodically as hosts change.

It’s very likely that one of the proactive monitoring use cases applies to your business, but this is just one of the many high-level use cases for synthetic monitoring. There is a lot more to come in this series, so stay tuned.
If you don’t want to wait, reach out to our team for a demo or start your 30-day free trial, or sign up for our educational sessions on synthetics:
- Virtual Design Clinics — sessions offered every two weeks:
- Thursday, April 7 at 8am PT - Synthetics: PoP edition
- Thursday, April 28 at 8am PT - Synthetics: Latency edition

