Synthetic Testing and Monitoring
Test and monitor everything. Investigate what matters.
Ensure amazing digital experiences
- Monitor digital experience across network infrastructure, multi-cloud, and SaaS applications.
- Run page load and web transaction tests on intervals that you choose.
- Constantly monitor application performance between end users, offices, data centers, and public clouds.
Network monitoring and testing made simple
- See real and test traffic in the one window for monitoring clarity and reduced workload.
- Plan synthetic tests based on your actual network traffic and have them update when patterns change.
- Auto-configure tests without the toil of documenting addresses, parsing lists, or tracking changes.

Troubleshoot performance problems
- Be alerted to performance problems and know they’re based on your real traffic patterns.
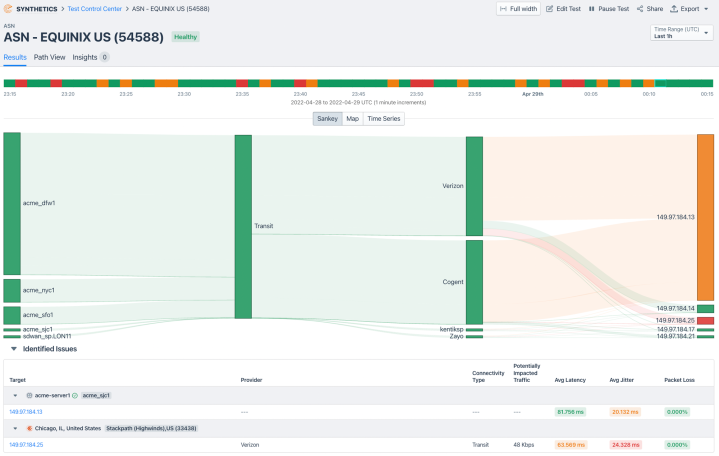
- Quickly zoom into specific tests and learn details of your traffic’s path so you can narrow down to the source of problems.
- Immediately see nodes with excessive latency or packet loss and/or jitter.
- Monitor BGP events including hijacks and path changes, route leaks, and invalid RPKI status.
Monitor user experience from anywhere
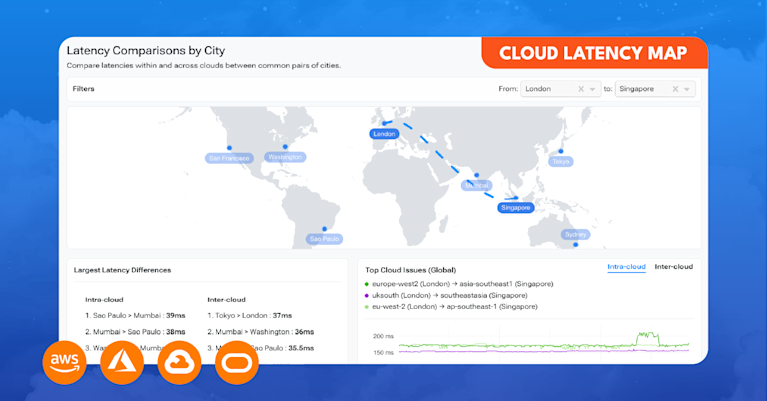
- Emulate the performance of your global users from any region in public cloud providers.
- Use any of our 200+ public agents and augment with private agents in your own network.
- Test web apps using app agents, page loads, and transactions.
- Manage agents, tests and data with an API.
See the Kentik Global Synthetic Network.

Unmatched BGP monitoring for enhanced security
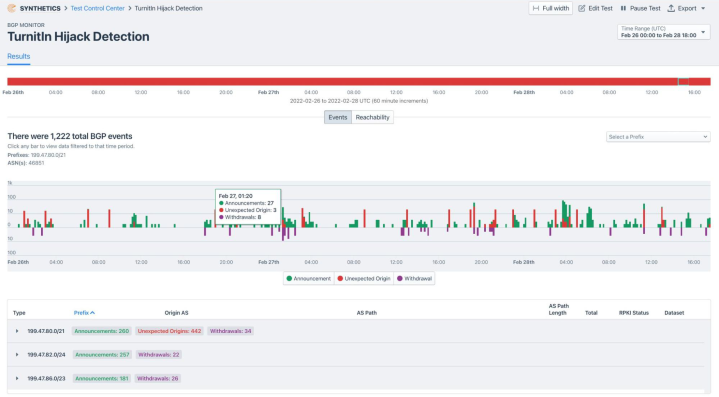
- Monitor BGP events related to your network including hijacks and path changes, reachability problems, route leaks and invalid RPKI status.
- Collect BGP data related to your network from thousands of vantage points.
- Click once to create BGP monitor tests and set your custom alerts.
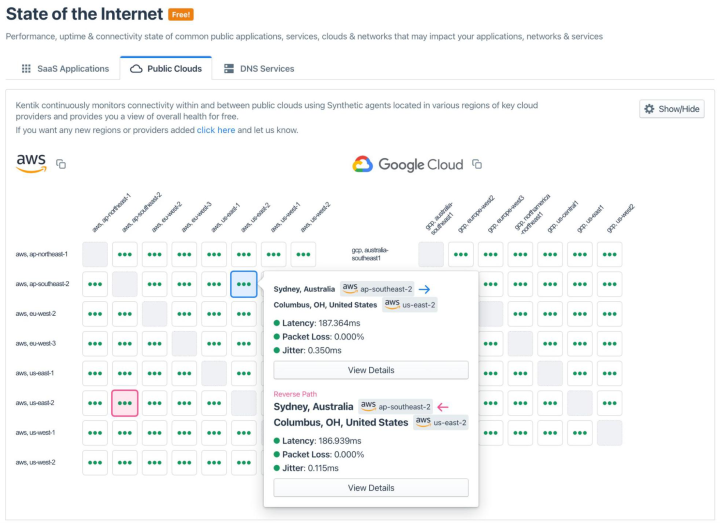
Understand the State of the Internet at a glance
- Monitor the state of SaaS applications, in and between public clouds, DNS service providers.
- Use our hundreds of agents located across the globe or easily deploy your own so that you can monitor what’s important to you.
- Quickly identify root cause — is it my infrastructure, the cloud, or an application?
- No additional cost to see all our State of the Internet results.
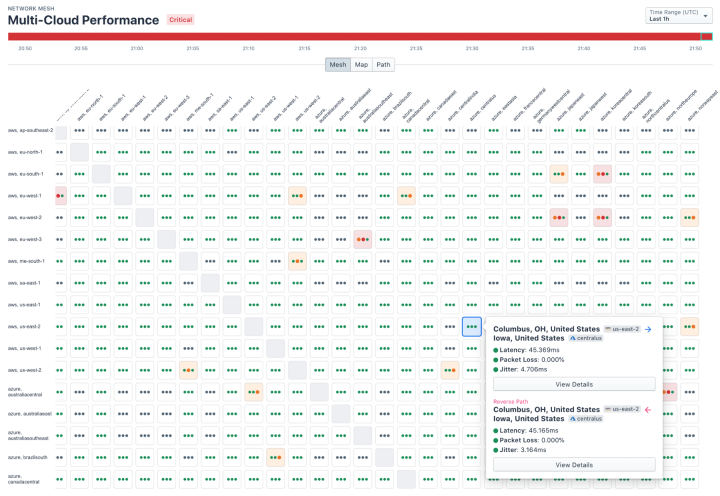
Performance mesh test at scale
- Set up complex, multi-site performance mesh tests with just a few clicks and view hundreds of results simultaneously.
- Our mesh view and visual cues show you problems at a glance.
- Click any cell to view performance metrics and drill down to the root cause of issues.
- See how you are running applications between data centers and public clouds.
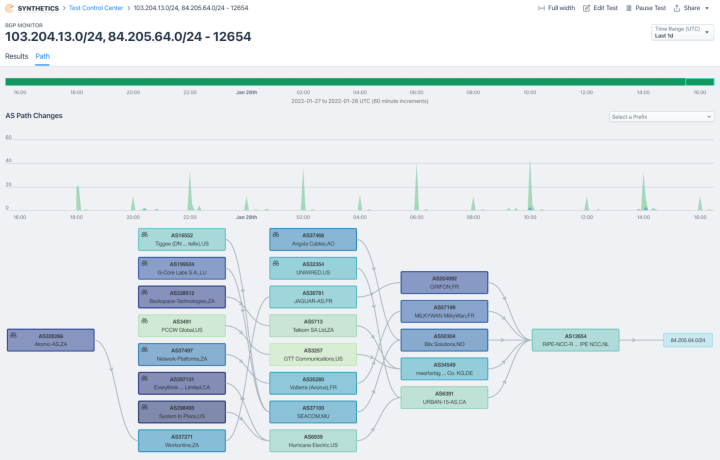
Clear AS path visualization
- By monitoring BGP, you can see the AS paths currently and at any point in time.
- Logical topology maps allow you to see AS path changes that may indicate instability.
- Monitor route announcement frequency and get alerted to changes.
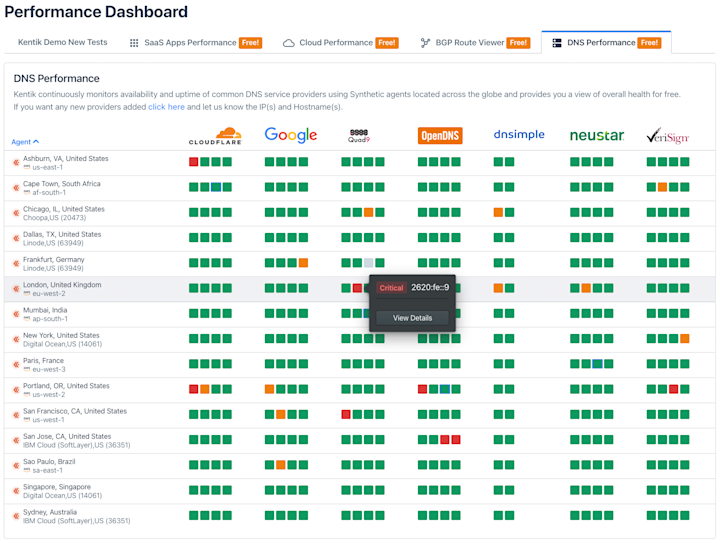
DNS and website availability at a glance
- Make sure your DNS and web servers are always up so that your websites and web-based applications are always available.
- Select agents for an accurate picture of server availability, resolution time and returned results, including IP addresses and MX records.
- Intelligently configure alerts for failures, query time deviations or anomalies over time.

“Kentik’s network observability includes synthetic testing for data center and edge, in addition to flow monitoring. It’s an entire suite for the network.”
Explore solutions
Synthetic Testing and Monitoring FAQs
How can I test private connectivity like Direct Connect and ExpressRoute?
Test private connectivity by deploying private synthetic agents on both sides of the interconnect and running continuous latency, loss, jitter, and reachability tests. Kentik Synthetics supports private agents and scheduled tests (ping/traceroute/HTTP) so you can baseline Direct Connect/ExpressRoute performance and alert immediately when the link or path degrades.
How do I identify which AS path is causing increased latency?
Use traceroute-based synthetic testing with AS-path visibility. Kentik Synthetics includes path views in the Test Control Center, where you can review latency over time and visualize the current AS paths at a specific time slice to see which AS path changes or hops correlate with increased latency.
What’s the best method to measure page load performance due to network?
Use synthetic page-load and transaction tests from multiple geographies and networks to measure DNS/HTTP/TLS timing and end-to-end load performance, then alert on regressions. Kentik Synthetics supports page load and web transaction tests from public and private agents so you can isolate whether slowdowns are caused by the network path, upstream providers, or destination-side issues.
How can I test DNS, TLS, and HTTP performance from global agents?
Use Kentik’s global agents to run DNS and HTTP(S)/API tests from multiple internet cities and cloud regions. Track DNS resolution time and results, HTTP latency and status codes, and TLS handshake and certificate-related signals, then alert when thresholds are breached or behavior deviates from baseline. Add private agents when you need inside-out testing from branches, VPN edges, or cloud networks.
How do I monitor and optimize traffic to public cloud edge locations?
Monitor cloud edge performance by measuring user-to-edge reachability and latency from many vantage points, then correlating changes in DNS results and network paths with shifts in response time. A practical approach is to run continuous DNS + HTTP tests (and traceroute when latency spikes) to your edge endpoints, compare results across regions and ISPs, and alert when specific geographies start landing on slower paths or distant edge locations. Kentik supports this with global synthetic agents located in major Internet hubs and public cloud regions plus optional private agents, so you can test from the same places your users and workloads sit, spot routing or edge-mapping changes quickly, and validate improvements after you adjust traffic steering, interconnect strategy, or CDN/edge configuration (Synthetic Monitoring “Learn more about Synthetic Monitoring from Kentik”).
How can I detect path MTU issues across hybrid networks?
Path MTU (Maximum Transmission Unit) issues usually show up as “small packets work, larger payloads fail,” often due to ICMP filtering or an unexpected low-MTU segment that prevents PMTUD from working end-to-end. A practical workflow is to (1) reproduce the failure with a controlled test, (2) use hop-by-hop path tooling to locate where fragmentation/PMTU breaks, and (3) confirm whether policy or encapsulation changes introduced a lower effective MTU. Kentik supports faster triage by running continuous ping/traceroute-style synthetic tests between global and private agents so you can pinpoint when packet loss begins, correlate it to a path change, and narrow the suspect segment before doing deeper MTU-specific validation.
How can I test private connectivity like Direct Connect and ExpressRoute?
Test private connectivity by deploying private synthetic agents on both sides of the interconnect and running continuous latency, loss, jitter, and reachability tests. Kentik Synthetics supports private agents and scheduled tests (ping/traceroute/HTTP) so you can baseline Direct Connect/ExpressRoute performance and alert immediately when the link or path degrades.
How can I alert on degraded performance before users are impacted?
Use continuous synthetic tests along your critical paths (branch to SaaS, VPC-to-VPC, interconnects, edge to origin) and alert on early warning signals like rising latency, jitter, DNS response time, TLS handshake time, or packet loss before the outage becomes user-visible. Kentik supports this by letting you set health thresholds per metric on synthetic tests and route notifications through your preferred channels so teams are alerted as soon as performance deviates from baseline.
How do I set SLOs for network performance and track compliance?
Define network SLIs that reflect real experience (for example: p95 latency, packet loss percentage, DNS response time, HTTP/API response time) measured from the same vantage points your users and services depend on, then set SLO targets and monitor burn against those targets over a fixed window. Kentik supports SLO-style tracking by providing synthetic time series for those SLIs from global and private agents, health thresholds for “good vs bad” behavior, and APIs to export results if you want to compute error budgets and compliance in an external SLO system.
What methods can verify SaaS availability from multiple geographies?
Use synthetic network and application tests from multiple internet cities and cloud regions to validate reachability and performance for SaaS endpoints, including DNS resolution time, HTTP/API status codes, TLS handshake timing, and end-to-end response time. Kentik supports this with the Kentik Global Synthetic Network (global agents) plus optional private agents for inside-out testing, so you can compare regions, isolate whether issues are ISP/path-specific, and alert when a subset of geographies degrade.
How can I test application reachability from private and public agents?
Test from public agents to emulate “outside-in” user experience and from private agents inside your own VPCs, data centers, or branches to validate internal and hybrid reachability. Kentik supports both global agents and customer-deployed private agents, so you can run the same ping/traceroute/HTTP/DNS/API tests from both perspectives and quickly determine whether an issue is internet-path-related or inside your network. Additionally, Kentik’s State of the Internet feature gives all Kentik customers real-time performance metrics for the most popular SaaS applications.

