Digital Experience Monitoring (DEM): Tools, Workflows, and Best Practices (2026)
Digital Experience Monitoring (DEM) is a performance analysis discipline that measures the quality of end-user interactions with enterprise applications, services, and networks — whether on-premises or in the cloud. By providing insights into the end-user experience across the omnichannel user journey, DEM helps teams continuously improve and optimize how people and machines interact with digital tools, ultimately boosting productivity, reliability, and revenue outcomes.
This guide covers the core components of DEM, the operational workflows it enables, and what to look for when evaluating DEM tools.
Kentik in brief: Kentik is a network intelligence platform with built-in digital experience monitoring capabilities. Kentik Synthetics proactively tests networks, SaaS applications, APIs, and web pages from a global network of agents across major internet hubs and public cloud regions, while real traffic flow data provides the context to determine whether a synthetic test failure is actually affecting users. The result is DEM that goes beyond “is it up” to answer “is the experience good, and if not, why.”
Learn how AI-powered insights help you predict issues, optimize performance, reduce costs, and enhance security.

Digital Experience Monitoring at a Glance
- What it is: A performance analysis discipline that measures the quality of end-user interactions with applications, services, and networks — from the user’s perspective.
- Three core components: Synthetic monitoring (proactive testing), Real User Monitoring (passive observation of actual users), and endpoint monitoring (device-level health).
- Why it matters: Applications are migrating to the cloud, users are distributed globally, and network performance directly impacts revenue, brand reputation, and productivity.
- How it differs from APM: Application Performance Monitoring focuses on internal application health (code, database, server). DEM focuses on the end-to-end experience as the user sees it, including the network path between user and application.
- Key use cases: SaaS availability validation, user-journey alerting, real-time media QoE, pre-migration baselining, SLA compliance, and troubleshooting degraded user experience across hybrid and multi-cloud environments.
Why is Digital Experience Monitoring important?
Modern applications increasingly depend on networks the operator doesn’t own — public internet paths, cloud provider backbones, SaaS platforms, ISPs, and CDNs. Traditional infrastructure monitoring can confirm that a server is up or that a link isn’t saturated, but it can’t answer the question that actually matters to the business: is the user having a good experience right now, and if not, why?
DEM answers that question by measuring performance from the user’s perspective. It catches problems that originate outside the operator’s perimeter — a SaaS provider’s regional degradation, a routing change between an ISP and a cloud region, a CDN edge mapping users to a slower point of presence — that traditional monitoring misses entirely.
For network teams, DEM is also the bridge between network telemetry and business outcomes. A 200ms latency increase on a transit link only matters if it’s degrading a user experience that the business cares about. DEM ties those two halves of the story together, which is why network engineers have become some of its most active practitioners alongside DevOps, SRE, and IT operations teams.
Advantages of Digital Experience Monitoring
DEM enables organizations to identify and address performance issues before they impact customers, demonstrate SLA compliance with measurable evidence, and hold third-party providers accountable for their part of the user experience. When DEM is unified with broader network and infrastructure telemetry, it also becomes the fastest path to root cause: synthetic tests show that something is degraded, while flow analytics, BGP routing context, and device metrics show why and where.
The primary components of Digital Experience Monitoring
DEM combines three primary technology components, each providing a different lens on user experience.
Synthetic monitoring and synthetic transaction monitoring
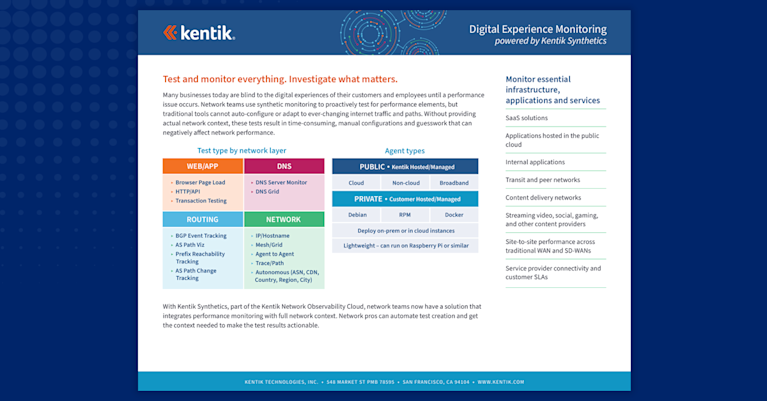
Synthetic monitoring uses agents to proactively test services such as SaaS applications, API endpoints, and websites. Unlike Real User Monitoring, synthetic tests don’t depend on active users — they run continuously on schedules ranging from sub-minute to daily intervals, exposing problems before users encounter them.
Modern synthetic monitoring platforms support a range of test types, each measuring a different layer of the experience:
- Ping and traceroute tests generate latency, jitter, and packet loss metrics, plus hop-by-hop path data
- HTTP and API tests measure status codes, time to last byte, response size, DNS resolution time, and TLS handshake timing
- DNS tests validate resolution behavior across multiple DNS servers
- Page Load tests use a headless browser to measure end-to-end web performance — navigation, domain lookup, connect, and response timings
- Transaction tests simulate multi-step user journeys (login → search → purchase, for example) using scripted browser interactions
- BGP monitoring tests track route announcements, withdrawals, and reachability from public BGP collectors
When synthetic monitoring is correlated with real network telemetry — flow records, device metrics, and BGP data — test failures can be traced from symptom to root cause without context-switching between tools. Learn more in our Kentipedia article on Synthetic Transaction Monitoring (STM).
Endpoint monitoring
Endpoint monitoring provides visibility into user devices and performance from the endpoint perspective. This includes operating system version, CPU and memory usage, storage, and network connectivity. While it can resemble desktop inventory software, the focus is continuous performance and availability rather than asset management.
Real User Monitoring (RUM)
Real User Monitoring measures the experience of actual users as they interact with applications. RUM uses application-embedded instrumentation (typically JavaScript) or browser plugins to capture per-session telemetry — page load times, transaction times, and bottlenecks caused by browser CPU, RAM, or rendering performance. RUM complements synthetic monitoring by validating that the experience real users have matches what synthetic tests predict.
Core DEM workflows
DEM is most useful when it’s tied to specific operational outcomes. The workflows below cover the most common questions DEM is used to answer.
Verify SaaS availability and performance from multiple geographies
Run network and application tests from multiple internet cities and public cloud regions to validate SaaS reachability and performance — including DNS resolution time, HTTP/API status codes, TLS handshake time, and end-to-end response time. Comparing results across regions makes it possible to isolate whether a SaaS issue is provider-wide, ISP-specific, or limited to a single geography. Kentik supports this with the Kentik Global Synthetic Network plus optional private agents for inside-out testing from your own VPCs, data centers, and branches.
Test DNS, TLS, and HTTP performance from global agents
Each layer of the web stack can fail independently, so production-grade DEM tests them independently. Run continuous DNS lookups against authoritative and recursive servers, measure TLS handshake time on HTTPS endpoints, and validate HTTP/API status codes and response timing — all from globally distributed agents. Kentik supports this with HTTP, DNS Server Monitor, and DNS Server Grid test types that measure each layer separately and surface the specific timing component that has regressed.
Alert on degradation of critical user journeys from key sites
Multi-step user journeys (such as login → dashboard → action → confirmation) require more than basic uptime checks. Run scripted transaction tests from the geographies and networks your most important users live on, and alert on regressions in step-level timing or failure rates rather than just overall uptime. Kentik supports this with Puppeteer-based Transaction tests that record and replay user journeys from any agent location, with health thresholds that can be set per metric (latency, jitter, loss, HTTP latency, DNS response time, certificate expiry).
Identify the best route to SaaS providers from multiple ISPs
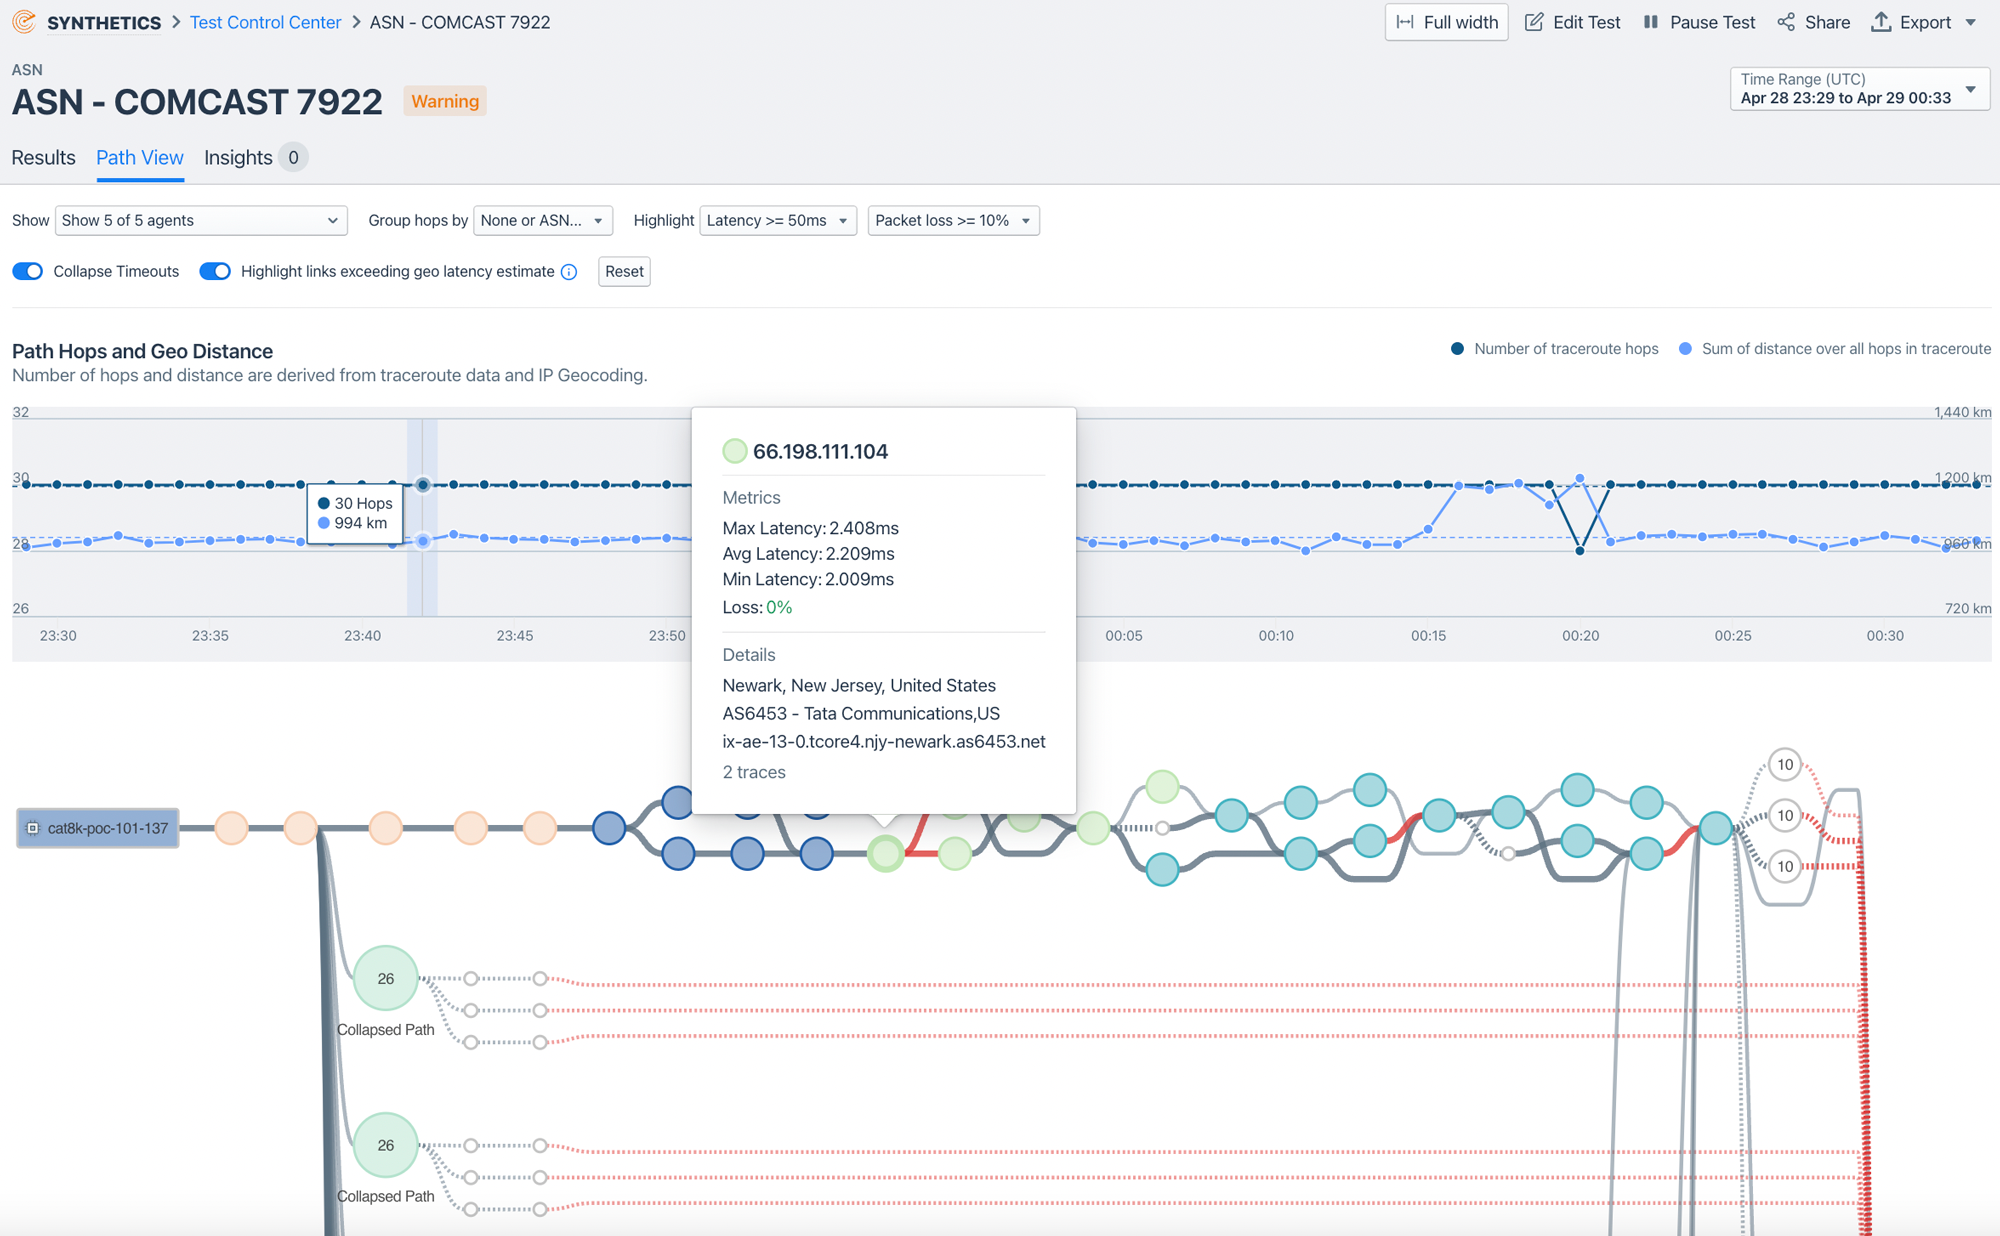
When traffic to a critical SaaS provider can leave through multiple ISPs, the path each ISP takes to reach the provider — and the performance of that path — varies meaningfully. Compare synthetic test results across ISPs and cloud regions, and use AS path visibility from traceroute-based tests to see which routing decisions correlate with better or worse performance. Kentik supports this through path views in the Test Control Center, which show latency over time alongside the AS paths active at each time slice — making it possible to see which AS path changes correlate with performance shifts.
Correlate synthetic results with real traffic and BGP routing
Synthetic tests are most valuable when their results are correlated with what’s actually happening on the network. When a synthetic test degrades, real flow data shows whether real users are also affected, while BGP monitoring shows whether a routing change explains the degradation. Kentik supports this by displaying synthetic test results, real flow telemetry, and BGP announcements together — and through Autonomous (flow-based) tests that automatically generate synthetic tests for the destinations that real traffic is actually reaching, so synthetic coverage stays aligned with real user behavior as patterns shift.
Validate SLAs and benchmark provider performance
Most SLAs are built around availability, response time, and network performance metrics that synthetic monitoring can measure continuously. Run scheduled tests against contractual targets, archive the results for reporting, and use the historical data to hold providers accountable when performance falls short. Kentik supports SLA validation with configurable health thresholds, time-based health views, and historical retention of synthetic test results.
DEM for SaaS applications
Software-as-a-Service applications now sit at the center of most digital experiences — Microsoft 365, Salesforce, Slack, Zoom, Workday, ServiceNow, and dozens of others. Because the operator doesn’t run the SaaS infrastructure, traditional monitoring can’t see most of what affects SaaS performance: the SaaS provider’s own backend, the internet path to its ingress points, regional load distribution, and the user’s local network. DEM is purpose-built to fill this visibility gap.
Effective SaaS DEM combines three things: continuous synthetic tests to SaaS endpoints from multiple geographies and ISPs, visibility into the internet path each test takes (including AS-level routing), and the ability to compare results across geographies to isolate where degradation originates. This is the difference between knowing “Salesforce is slow” and knowing “Salesforce is slow specifically for users routed through ISP A in Europe because of a transit-path change at AS 1234.�”
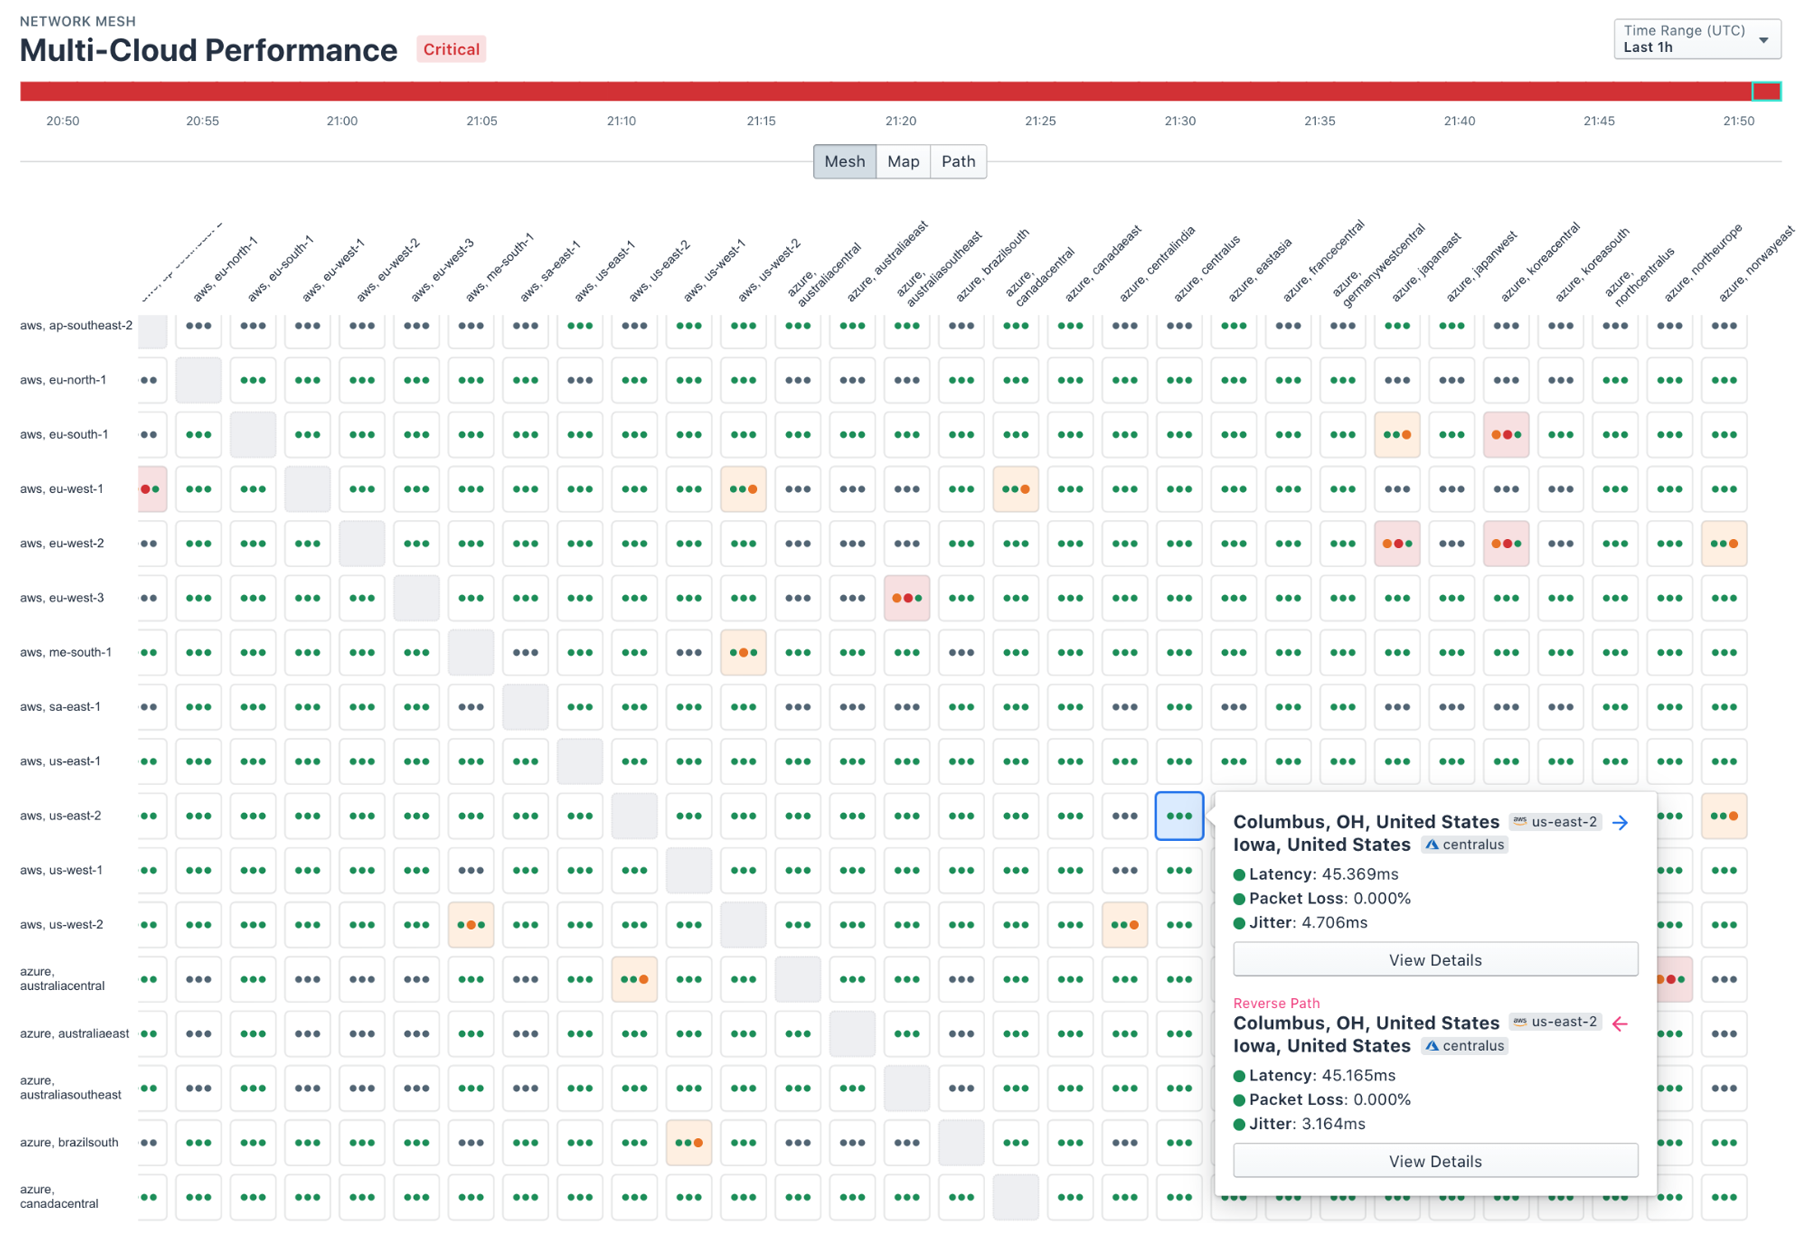
Kentik’s State of the Internet feature extends this further by providing at-a-glance visibility into the health, performance, and availability of common SaaS applications, public cloud inter-region connectivity, and DNS services — at no additional test credit cost. Customers can complement this baseline with custom tests targeting their own SaaS dependencies and user populations.
DEM for real-time and media experience
Voice, video, and gaming traffic have entirely different sensitivity profiles than web traffic. A 300ms response time on a web request is acceptable; a 300ms increase in voice latency is not. Real-time application experience depends on metrics most web-focused monitoring tools don’t surface: jitter, packet loss percentage, and one-way path consistency.
For VoIP, video conferencing, and gaming, DEM should run continuous low-frequency network tests (typically ping and traceroute on sub-minute intervals) along the actual paths media traffic takes, alerting on jitter and loss thresholds tuned for real-time sensitivity. Branch sites running voice or video are particularly important to monitor, since local-loop, ISP, and SD-WAN underlay issues all affect media quality independently. Kentik supports this with continuous ping/traceroute tests from public and private agents, configurable jitter and loss thresholds, and integration with SD-WAN analytics for branch-aware troubleshooting.
User journey monitoring and alerting
Not all user actions matter equally. Logging in, completing a purchase, submitting a form, accessing a dashboard — these are the journeys that have business consequences when they fail. User journey monitoring goes beyond single-page checks to validate that complete multi-step interactions work end to end, from the geographies and networks that matter most.
Practical user journey monitoring requires three capabilities: scripted transaction tests that can simulate realistic user behavior (typically using browser automation tools like Puppeteer), execution from multiple agent locations corresponding to real user populations, and per-step alerting that can flag regressions in any individual step rather than just overall test failure. Kentik Transaction tests run Puppeteer scripts in headless Chromium, with default 30-minute intervals and per-test health thresholds that integrate with notification channels like PagerDuty, Slack, and webhooks.
Challenges of Digital Experience Monitoring
Despite its benefits, DEM brings real implementation challenges. The first is data fragmentation: synthetic monitoring, real-user monitoring, endpoint telemetry, and the underlying network data that explains why a test failed often live in separate tools. The result is a fractured investigation experience — engineers see that a test degraded but have to hop between platforms to find out what changed in the network, the cloud, or the routing path.
The second challenge is signal-to-noise. Synthetic tests fail constantly for reasons that don’t matter — a single agent in a single region briefly misbehaves, a non-critical secondary endpoint times out, a flaky DNS server in one geography returns slow responses for one minute. Without correlation to real traffic patterns and intelligent thresholding, DEM platforms generate alerts engineers learn to ignore.
Kentik addresses both challenges by unifying synthetic monitoring with flow-based traffic analytics, infrastructure metrics, BGP routing data, and AI-driven insights in a single network intelligence platform. Synthetic test failures are correlated against real flow data so teams can immediately see whether real users are affected, and AI Advisor can investigate degradations across synthetic, flow, BGP, and device telemetry to surface evidence-backed root cause without engineers having to context-switch between tools.
Types of Digital Experience Monitoring tools
A wide range of DEM tools are available, each designed to address specific monitoring needs. When building a DEM strategy, organizations typically combine several of the following tool types.
Synthetic monitoring tools
Synthetic monitoring tools simulate user interactions with applications, websites, and APIs to proactively test their performance and availability. By creating synthetic transactions, these tools can identify potential bottlenecks before they impact real users. Synthetic monitoring tools are valuable for benchmarking performance across different regions, devices, or network conditions.

Real User Monitoring (RUM) tools
Real User Monitoring tools collect data on actual user interactions with applications and services. RUM tools use JavaScript-based monitoring or browser plugins to track user behavior and gather metrics like page load times, transaction times, and user interactions. This category is sometimes called End User Experience Monitoring (EUEM).
Endpoint monitoring tools
Endpoint monitoring tools focus on the performance and availability of user devices — desktops, laptops, and mobile devices — gathering data on system performance and network connectivity to identify issues that may impact user experience.
Application Performance Monitoring (APM) tools
Application Performance Monitoring tools provide insights into the performance and health of applications and their underlying infrastructure, with data on response times, error rates, and resource utilization. When integrated with DEM tools, APM solutions offer a comprehensive view of the digital experience.
Network Performance Monitoring and Diagnostics (NPMD) tools
NPMD tools focus on the performance and health of networks, analyzing traffic, latency, packet loss, and other key indicators. NPMD tools are typically used alongside DEM tools — synthetic and RUM — to give a complete picture of digital experience. Learn more in our article on Network Performance Monitoring.
When selecting DEM tools, the most effective approach typically combines multiple tool types within a unified platform that can correlate data across all of them.
Evaluating Digital Experience Monitoring tools
When evaluating DEM tools, IT operations and network teams should look for solutions that offer:
- End-to-end visibility across applications, networks, and endpoints — including the network paths between users and applications
- Real-time monitoring and alerting with the ability to detect regressions before users complain
- Both synthetic and real user monitoring — synthetic for proactive testing, RUM for actual user behavior
- Integration with network telemetry so synthetic test results can be correlated with flow data, BGP routing context, and device metrics for fast root-cause analysis
- Global agent coverage in the geographies and networks your users actually inhabit, with the option to deploy private agents in your own infrastructure
- Seamless integration with existing IT infrastructure and DevOps tools (alerting, ticketing, ChatOps)
Related Kentipedia Articles
- What is Synthetic Monitoring?
- Synthetic Monitoring vs Real User Monitoring
- What is Synthetic Transaction Monitoring (STM)?
- What is End User Experience Monitoring?
- Network Performance Monitoring
- SD-WAN Analytics
- The Role of Network Observability in Modern APM
- What is NPMD?
FAQs about Digital Experience Monitoring
What is digital experience monitoring (DEM)?
Digital experience monitoring is a performance analysis discipline that measures the quality of end-user interactions with enterprise applications, services, and networks. It combines synthetic monitoring, real user monitoring, and endpoint monitoring to provide a complete picture of the user experience across cloud, hybrid, and on-premises environments.
What are the three main components of DEM?
The three primary components are synthetic monitoring (proactive scripted tests that simulate user interactions), real user monitoring or RUM (passive observation of actual user sessions), and endpoint monitoring (device-level health data like CPU, memory, and connectivity). Together, they provide both proactive detection and real-world validation of user experience.
What is the difference between DEM and APM?
Application Performance Monitoring (APM) focuses on the internal health of applications — code execution, database queries, server resources. Digital Experience Monitoring focuses on the end-to-end experience as the user sees it, including the network path between user and application. The two are complementary: APM tells you what’s wrong inside the application, while DEM tells you what the user is actually experiencing.
Why is DEM important for cloud migration?
As applications move from on-premises data centers to cloud and SaaS environments, traditional monitoring tools lose visibility because the infrastructure is no longer under direct control. DEM restores that visibility by measuring performance from the user’s perspective regardless of where the application is hosted. Kentik supports this by combining synthetic tests to cloud and SaaS endpoints with real traffic flow analysis, so teams can see whether cloud-hosted applications are meeting performance expectations.
What methods can verify SaaS availability from multiple geographies?
The most reliable approach is to run continuous synthetic tests against SaaS endpoints from a globally distributed network of agents, measuring DNS resolution, TLS handshake time, HTTP status codes, and end-to-end response time from each location separately. Comparing results across geographies makes it possible to distinguish a provider-wide outage from a regional ISP issue or a single-geography routing problem. Kentik supports this with global agents in major internet hubs and public cloud regions, plus optional private agents for testing from inside corporate networks.
How can I test DNS, TLS, and HTTP performance from global agents?
Each layer should be tested independently so the failing layer can be isolated when something degrades. DNS tests validate resolution time across multiple authoritative and recursive servers; TLS metrics are captured as part of HTTPS test setup; HTTP and API tests measure status codes, time to last byte, and response size. Kentik supports this with dedicated DNS Server Monitor and DNS Server Grid tests, and HTTP/API tests that surface DNS resolution time, TLS handshake time, and HTTP response timing as separate metrics.
How do I alert on degradation of critical user journeys from key sites?
User-journey alerting requires scripted multi-step tests (login → action → confirmation, for example) running from agents located in the geographies and networks where critical users live, with health thresholds tuned per step rather than only on overall test outcome. Kentik supports this with Puppeteer-based Transaction tests that record and replay user journeys from any agent location, plus configurable per-metric health thresholds that integrate with notification channels like PagerDuty, Slack, and webhooks.
How can I identify the best route to a SaaS provider from multiple ISPs?
When multiple ISPs can carry traffic to a critical SaaS provider, the AS path each ISP uses — and the performance of that path — often differ meaningfully. Run continuous synthetic tests from agents on each candidate ISP, compare latency and loss, and use AS-path visibility from traceroute-based tests to see which routing decisions correlate with better performance. Kentik supports this with path views in the Test Control Center that show latency over time alongside the AS paths active at each time slice.
How can I measure quality of experience for VoIP and video across WAN links?
Real-time media QoE depends on jitter and packet loss more than on average latency. Run continuous low-interval ping and traceroute tests along the actual paths media traffic takes — including across SD-WAN underlays — and alert on jitter and loss thresholds tuned for real-time sensitivity rather than web traffic. Kentik supports this with continuous ping/traceroute tests from public and private agents and configurable per-metric thresholds for jitter and packet loss.
How can I measure user experience for gaming and real-time apps?
Like VoIP and video, gaming and real-time applications are highly sensitive to jitter and packet loss, and benefit from continuous network-layer testing along the paths users actually traverse. The most useful approach is to deploy agents in the regions and networks players use, run sub-minute ping and traceroute tests to game servers and matchmaking endpoints, and correlate any degradation with BGP routing changes or transit issues upstream. Kentik supports this with global synthetic agents, customer-deployed private agents, and integration with BGP monitoring for upstream routing context.
How do I monitor performance for remote workforces and home networks?
Remote-worker DEM combines two perspectives: monitoring the VPN gateways, SD-WAN edges, and SASE platforms that remote users connect through, and running synthetic tests from those edges to the SaaS and cloud destinations users depend on. This makes it possible to determine whether problems are in the corporate infrastructure, the user’s home ISP, or the SaaS path. Kentik supports this by including remote-worker traffic in the same analytics pipeline as branch and data center traffic, and by running synthetic tests from cloud and edge agents to representative SaaS endpoints.
What’s the best way to measure synthetic uptime versus real traffic availability?
Synthetic uptime measures whether scripted tests succeed; real-traffic availability measures whether actual user requests are completing. Both matter, and the most useful DEM platforms surface them side by side so engineers can quickly see whether a synthetic-test failure is also showing up in real traffic. Kentik supports this by displaying synthetic test results alongside real flow data, and through Autonomous tests that automatically generate synthetic coverage for the destinations real traffic is actually reaching — so synthetic monitoring stays aligned with real user behavior as patterns change.
How do I correlate synthetic monitoring results with real user traffic?
Correlation requires both data sources to live in the same analytics platform with a shared time axis and consistent identifiers (IPs, ASNs, applications). When a synthetic test degrades, real flow data should immediately answer whether real users are affected — and how many. Kentik supports this by ingesting flow telemetry and synthetic test results into a unified platform, displaying both on the same time-series views, and providing AI-driven investigation that can reason across both data types when troubleshooting.
How does synthetic monitoring fit into a DEM strategy?
Synthetic monitoring is the proactive component of DEM. It uses scripted tests — HTTP requests, DNS lookups, page loads, multi-step transaction scripts — run from globally distributed agents to detect performance issues before real users encounter them. It’s especially valuable for baselining performance, validating SLAs, and catching regressions during off-hours when real user traffic is low.
How can DEM help with SLA compliance?
DEM provides continuous, measurable data on application availability, response time, and network performance from multiple geographies — exactly the metrics most SLAs are built around. By monitoring these metrics proactively, teams can demonstrate compliance to customers and identify when a third-party provider or internal service is falling short. Kentik Synthetics supports this with configurable alerting thresholds and time-based health views in the Synthetics Dashboard.
What should I look for when evaluating DEM tools?
Look for end-to-end visibility across applications and networks, both synthetic and real user monitoring capabilities, real-time alerting, integration with network telemetry (so synthetic results can be correlated with flow, BGP, and device data), global agent coverage in the geographies your users live in, and integration with your existing infrastructure and DevOps tools. The most effective DEM platforms unify these capabilities in a single view rather than requiring separate tools for each.
How does Kentik approach digital experience monitoring?
Kentik combines synthetic monitoring, flow-based traffic analytics, infrastructure metrics, and AI-driven insights in a single network intelligence platform. Kentik Synthetics runs continuous tests — ping, traceroute, HTTP, DNS, page load, and Puppeteer-based transaction tests — from global agents across AWS, GCP, Azure, OCI, and key internet hubs, plus optional private agents in customer infrastructure. Real traffic data provides the context to determine whether test failures are affecting actual users, and AI Advisor helps teams investigate performance issues using natural language.
Monitor and optimize digital experience with Kentik
Kentik is the network intelligence platform that unifies synthetic monitoring with real traffic analytics — so you can measure the digital experience, understand what’s driving degradation, and fix it before users are affected.
- Get a demo — See how Kentik monitors digital experience across hybrid and multi-cloud environments
- Kentik Synthetics — Proactive testing with ping, traceroute, HTTP, DNS, page load, and transaction tests
- Kentik Global Synthetic Network — Hundreds of agents across AWS, GCP, Azure, OCI, and key internet hubs worldwide
- Digital Experience Monitoring Solutions — DEM powered by unified synthetic and real traffic data
- Kentik AI Advisor — Investigate performance issues and troubleshoot degraded user experience with natural language
