Monitoring DNS with Kentik
Summary
Domain Name Server (DNS) is often overlooked, but it’s one of the most critical pieces of Internet infrastructure. As driven home by last October’s crippling DDoS attack against Dyn, the web can’t function unless DNS resolves hostnames to their underlying IP addresses. In this post we look at how combining Kentik’s software host agent with Dashboards in Kentik gives you the tools you need to ensure DNS availability and performance.
Dashboards for DNS Metrics Reveal Issues With Your Infrastructure
Working behind the scenes, Domain Name Server (DNS) is often overlooked, but it’s one of the most critical pieces of the Internet infrastructure. No matter how well your network is routing IP traffic, the network is essentially down without DNS to resolve hostnames like www.google.com to their underlying IP addresses. That point was driven home by the Mirai DDoS attack last October against the DNS infrastructure of Dyn, Inc. The attack had a crippling effect on numerous major sites including GitHub, Twitter, Reddit, AirBnB, and Netflix.
As with any critical component, network operations needs to be able to continuously monitor DNS performance and to respond quickly to any issues that may arise. But how? Using Kentik’s software host agent with the Dashboard functionality of the Kentik Detect portal gives you the tools you need to ensure that DNS is operating at peak performance.
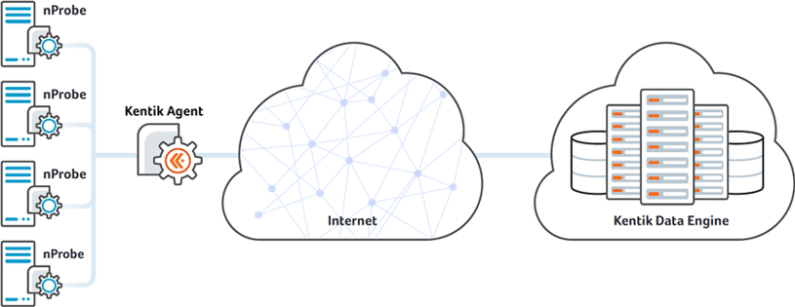
Here’s a brief overview of how the solution is put together. The Kentik host agent is installed on DNS servers, as shown at left in the image below. The agent monitors the DNS queries and responses as they pass to and from the server across its Ethernet interface (physical or virtual). This information is turned into flow data and sent over an SSL encrypted channel to the Kentik Data Engine (KDE), from which it is queryable in Kentik Detect. (For a deeper dive, see our Knowledge Base article on Host Configuration.)
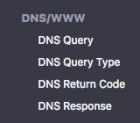
Once we have the data in our distributed big data database there are all kinds of powerful things we can do with it, including custom query-based Dashboards. Before we explore the Dashboard possibilities, let’s take a look at the DNS fields that Kentik Detect makes available as group-by dimensions and for filtering. As shown at right, we can look at data based on the DNS query itself, the DNS query type code, the DNS return code, and the DNS response the server sent back to the client.
Top Talkers and Beyond
Now let’s use these DNS fields to look at specific aspects of our DNS utilization. Note that in the following descriptions we’ll be looking at visualizations that are rendered within dashboard panels that we’ve created in Kentik Detect. You can learn how this is done by referring to our KB topic on Adding Dashboard Panels. Preset dashboards with some of these views will be added to Kentik Detect in the coming months. It’s worth noting that dashboard panels can be created from views in the portal’s Data Explorer, and also opened in Data Explorer for further drill-down. Also note that in addition to monitoring via dashboards you can set our alerting system to notify you of changes to any of the monitored parameters (see this post on Configuring Alert Policies).
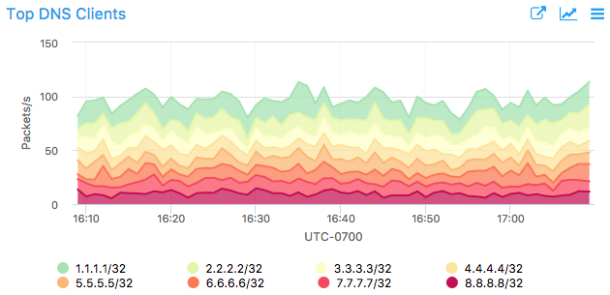
Probably the most obvious way to look at the DNS traffic is by looking at the Top Talkers to the DNS infrastructure. Let’s start by looking at the top DNS clients that are talking to our servers. In this particular case, we are looking at the traffic in packets per second (PPS) but we could also look at bits per second (BPS), unique Src IPs, Geo, or a number of other metrics. Monitoring this panel will enable us to see at a glance if one individual client is sending an increased amount of queries to our servers.
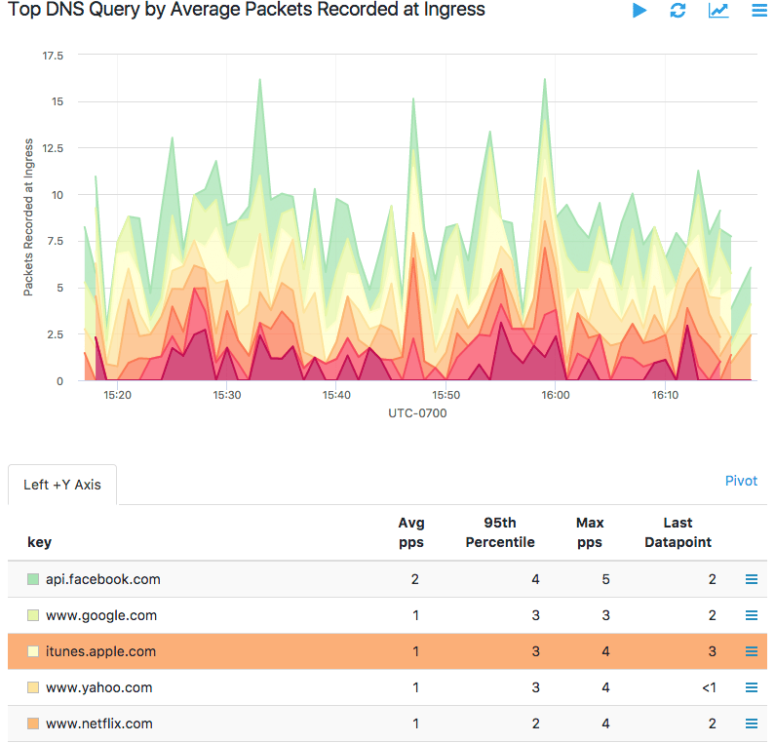
The next thing we want to keep an eye on is the top queries we are receiving from the clients. This gives us the ability to quickly see if there is a significant increase in DNS queries to our servers for a single hostname. Here’s a Data Explorer view of this metric.
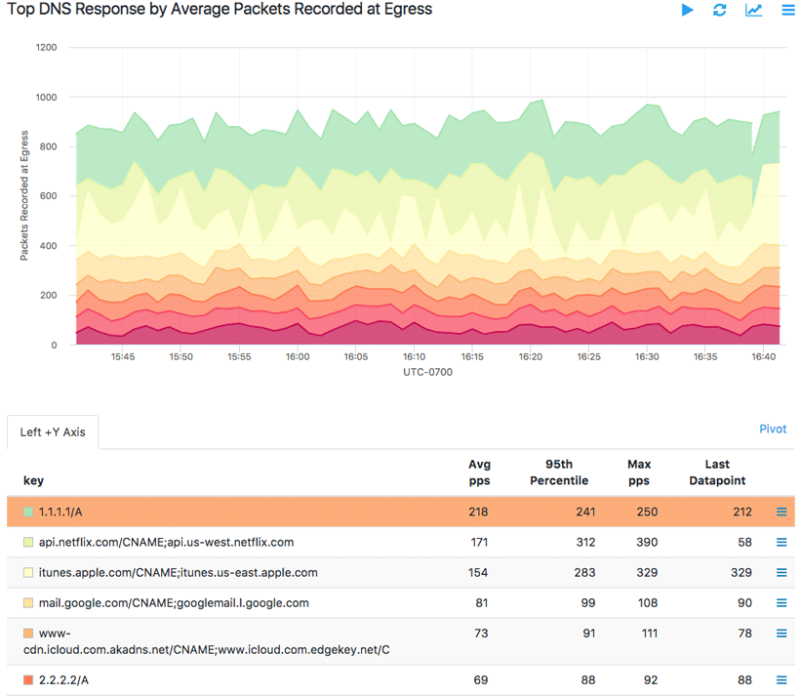
All good so far, so let’s take a look at the responses that our servers are returning. Similar to the previous view, this gives us a quick glimpse at how many responses we are sending back to the clients for each hostname, so we can monitor for increases in a given response.
This is very powerful information, but we aren’t done yet. As shown in the following dashboard panels, we can also look at the type of DNS queries we are receiving (below left) as well as the return codes that are being sent back to the client (below right). This lets us quickly see if we have a change in one particular query type or response code in our infrastructure.

Query Handling and Server Utilization
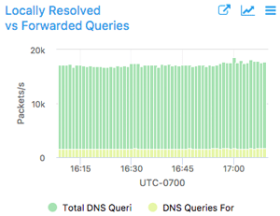
Another thing that is interesting to keep an eye on is how many of the DNS queries that are received are handled by our local servers and how many of them are forwarded on to an authoritative DNS server. Watching this could give us an indication if our clients are requesting a bunch of new hostnames that have not been requested before.
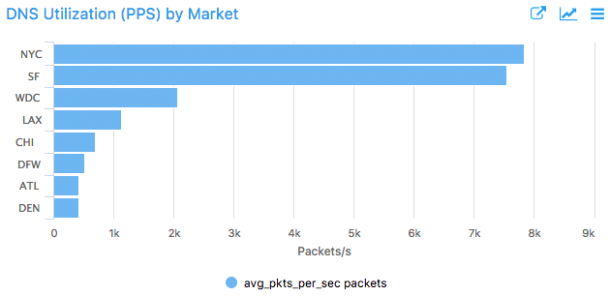
We can also check on the utilization of our DNS servers. We can look at this in a few different ways, the first of which is by market (shown below). Here we are looking at the PPS that is received by the DNS infrastructure in each one of our markets. We can quickly see if we have an increase in utilization (PPS) in any one market.
Within a market, we can take a look at the load on each server in terms of PPS (below left). This gives a little more granular look at how much traffic is being handled by each server within the market. If we start to see one server taking a lot more load than another, we probably need to investigate to see what the root cause of that might be.
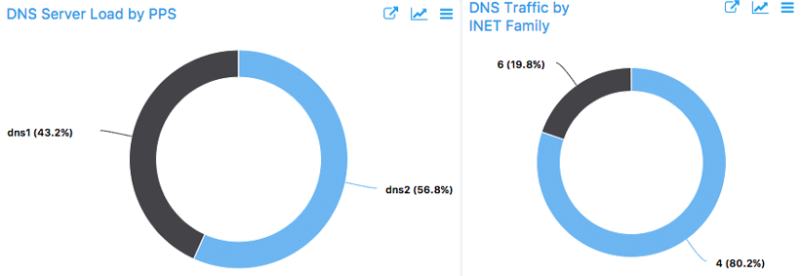
Another way to monitor the load on our DNS servers is by the IP type (IPv4 vs IPv6) of the requests that are coming in (above right). Changes in this type of information don’t really indicate a problem, but it’s interesting to keep an eye on.
Summary
The views shown above are just a few of the many that can be built into a dashboard to monitor a DNS infrastructure. If you’re already a Kentik Detect user, contact Kentik support for more information; our Customer Success team can help you build your own custom DNS Dashboard. If you’re not yet a user and you’d like to get started monitoring your own infrastructure, request a demo or start a free trial today.


