Summary
SD-WAN promises to boost agility, security, performance, and management and operations. However, without effective network visibility, the path to a successful deployment is difficult to achieve. In this post, we provide considerations for solving SD-WAN visibility challenges.
SD-WAN, one of the most disruptive network technologies of the past few years, has a fast rate of adoption. Enterprises adopting SD-WAN are driven by key factors such as WAN cost savings, application performance improvement, management and operation simplification, and more. Research shows 95% of enterprises are using or expect to use SD-WAN within 24 months.
To achieve the four main promises of SD-WAN – which are agility, security, performance, and management and operations – many practitioners will tell you SD-WAN visibility plays a critical role in a successful deployment. In this blog post, we are going to share our thought process and progress in solving visibility challenges for SD-WAN users to help them operate efficiently.
Why Visibility Matters in the SD-WAN Deployment Lifecycle
The SD-WAN idea sounds simple, but the path to SD-WAN is complicated. Think about how many choices of different vendors and different approaches are out there. In order to lead a successful SD-WAN deployment journey, users need to take the approach of looking at the entire SD-WAN lifecycle to understand what kind of visibility is most helpful in different phases. Here is some guidance:
- Planning. It can be scary not knowing where you are starting. Getting visibility before making decisions can help measure the change and prove the results. Best practices include:
- Baselining traffic bandwidths
- Evaluating security traffic patterns
- Discovering what applications are running between sites, the internet, and to the data center
- Understanding your service providers, link utilizations, and traffic patterns
- Building. The rollout and verification step validates whether the deployment performs as expected. Best practices include:
- Visualization of SD-WAN fabric, including both underlay and transports
- Intent verification by auditing traffic against SD-WAN policies
- Visualize all transport (MPLS, internet, LTE, etc.) links and show traffic traversing on transports to validate SD-WAN traffic policies
- Ongoing operation. Traffic paths in SD-WAN are highly dynamic with constant policy decisions changing based on the current application/network state. Therefore, ongoing verification and operations rely on continuous monitoring and alerting. Best practices include:
- Alert on SD-WAN transport (e.g., alerting policies for transport circuits down, policies to notify of abnormal shifts in application transport, policies on high utilization of transport circuits, and alerting on performance metrics per application and transport)
- Monitor utilization and runout for transport circuits for efficient capacity planning
- Identify and track network health
SD-WAN Visibility and SD-WAN Monitoring from Kentik
SD-WAN is just one piece of the puzzle. At Kentik, we aim to solve network visibility for all components of your network in one unified view.
-
SD-WAN + traditional WAN: Kentik can monitor SD-WAN vendors and traditional WAN sites in a single product. Hence, enterprise companies who have a phased plan of the rollout of SD-WAN can leverage Kentik’s help with the transition from tradition and adoption of WAN to SD-WAN throughout the SD-WAN lifecycle.
-
SD-WAN + Cloud + Data Center: According to research, 69% of SD-WAN users say cloud connectivity undermines their network confidence. Meanwhile, enterprises need to constantly optimize between the on-premises and cloud applications. Therefore, combining SD-WAN visibility with cloud and data center can provide end-to-end monitoring of your key traffic.
Under the Hood: Kentik Universal Data Records (UDR)
Universal Data Records (UDRs) are an architectural element of the Kentik Platform. UDR makes it possible to apply Kentik’s powerful machine learning and analytics across a rich, correlated schema for translation into actionable insights that include business, service, and application context.
With UDR, Kentik can quickly add more data sources to the platform to stay ahead and address the always-evolving network visibility challenges faced by our customers. That is how Kentik has been able to add the support of specific SD-WAN vendors in a speedy manner, including Cisco and Silver Peak SD-WAN, as well as specific firewalls like Cisco ASA, Zone-Based Firewall, Palo Alto Networks Firewalls, and other devices that are applicable to enterprise networking.
In the SD-WAN context specifically, UDR gives Kentik the capability to ingest vendor-specific fields, which are very important in the SD-WAN space (e.g., Viptela: VPN Identifier, and Silver Peak: Application, Business Intent Overlay).
Underlay and Overlay Visibility
SD-WAN’s blind spots that reside in either overlay or underlay, or both, could increase the deployment and operational difficulties and inefficiencies. An automatic map-out of the visualization of SD-WAN’s underlay and overlay traffic insights would be super helpful to understand the current SD-WAN deployment.
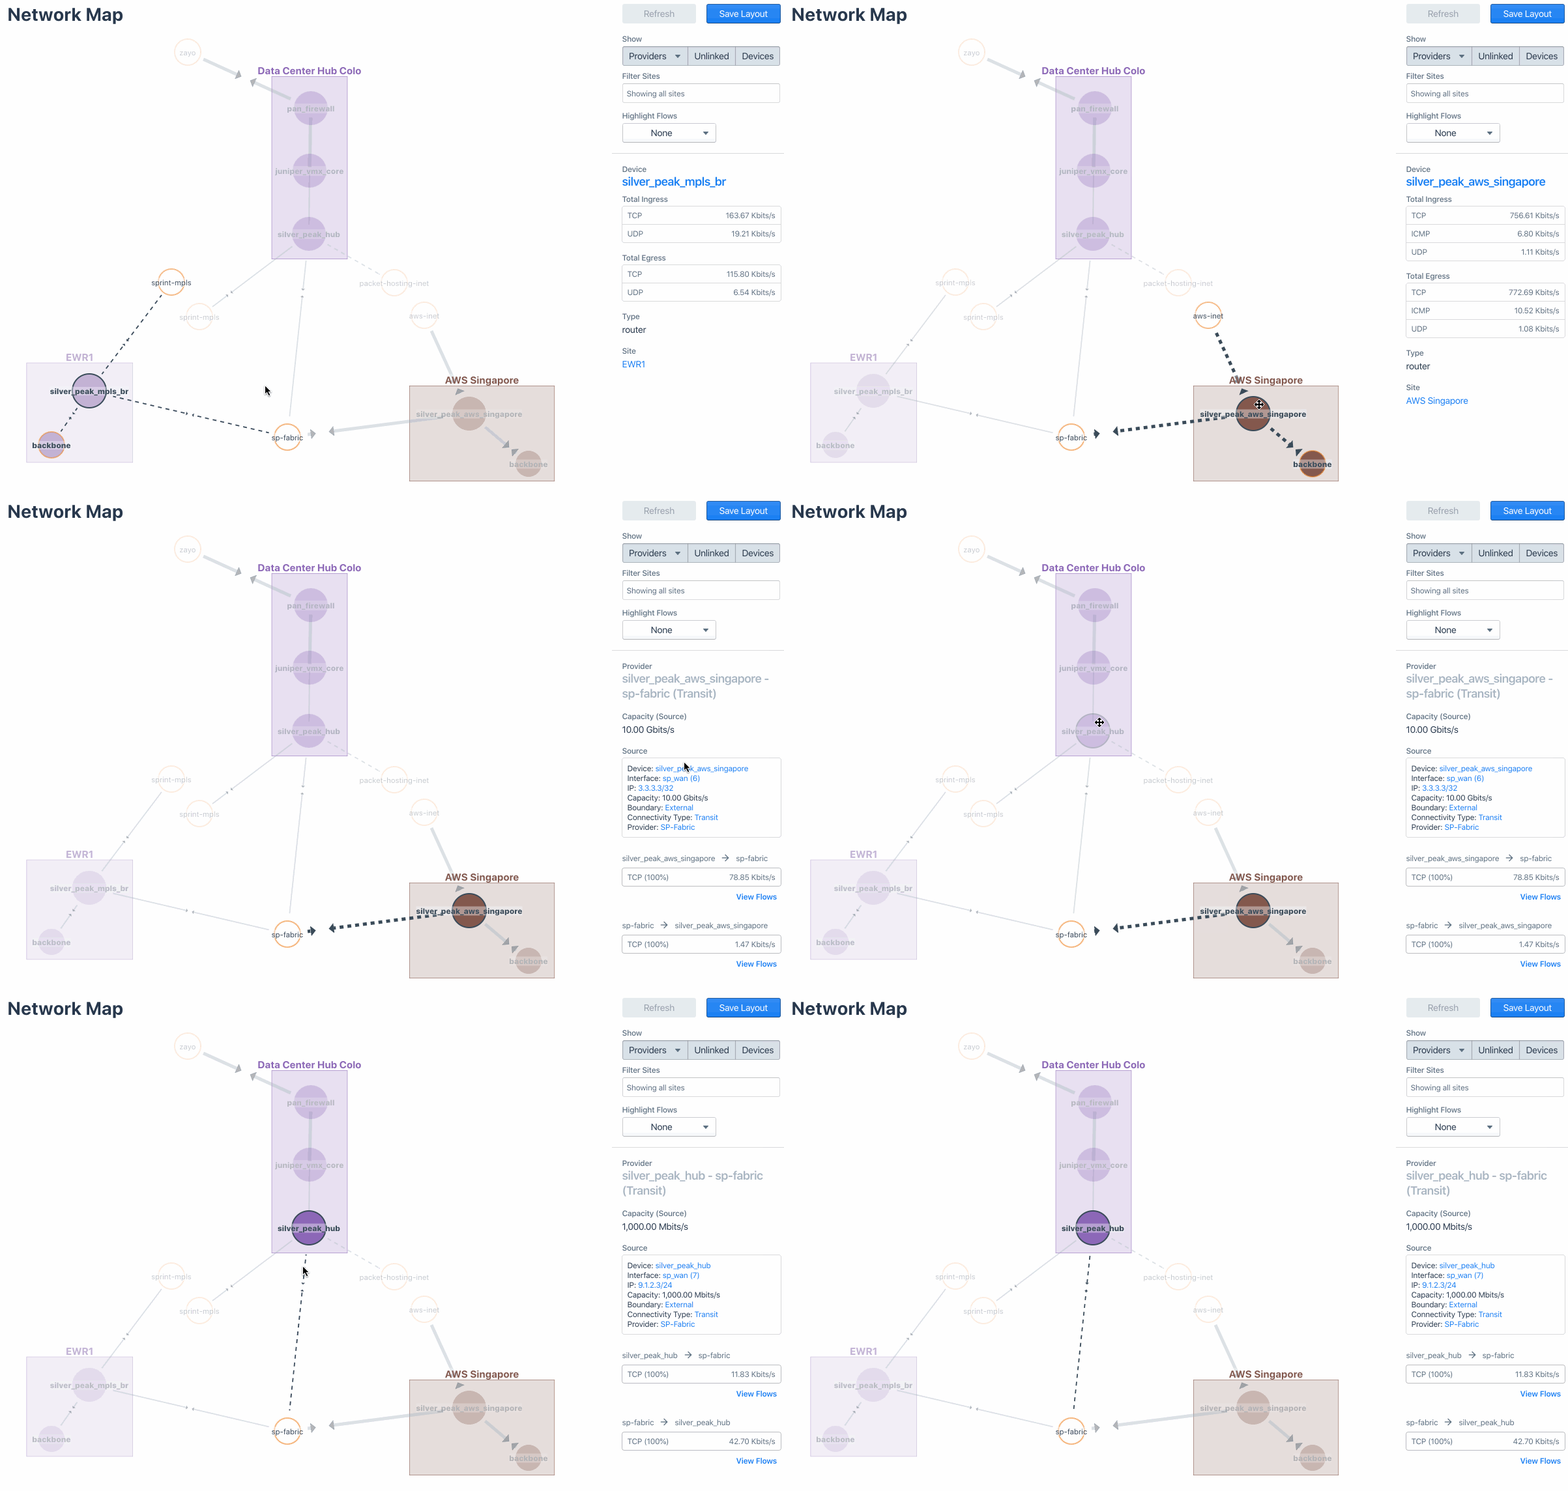
Let’s take SilverPeak SD-WAN for example. The following image captures the visualization of SD-WAN fabric with underlay and transport that connect various sites and data centers in “Network Map.” You can drill down to further traffic details of a certain Site/Device/Provider from there.

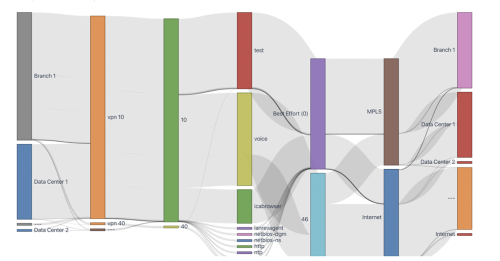
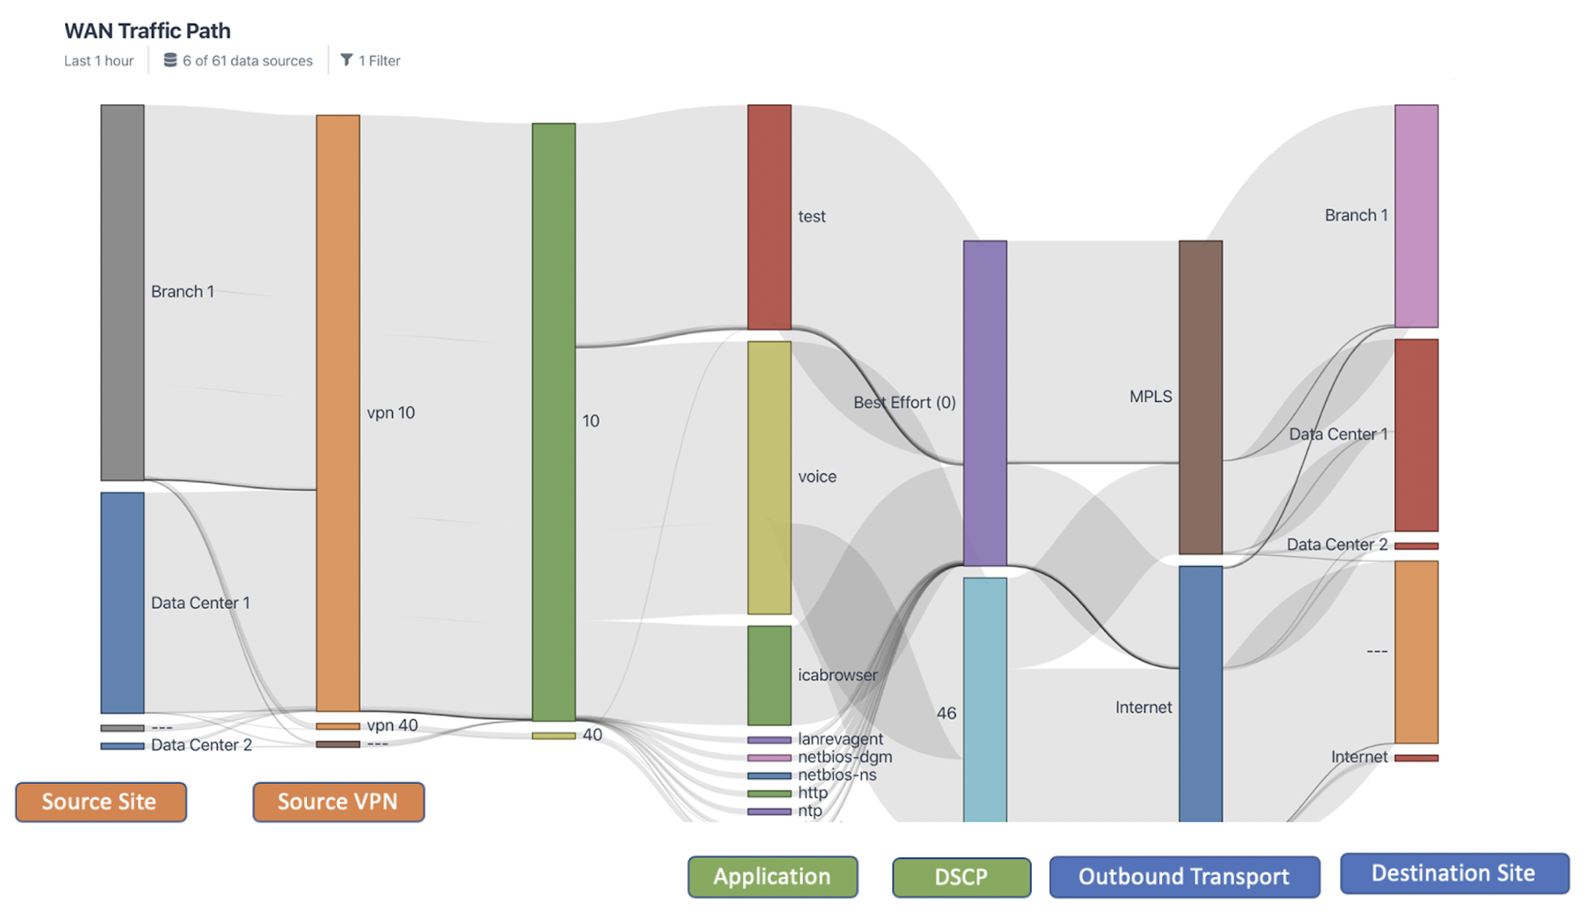
Meanwhile, you can also visualize the overlay traffic via Business Intent Overlay (BIO), a Silver Peak-specific term that specifies how traffic with particular characteristics is handled within the network (see the Sankey diagram below). This is also to verify the intent of the traffic and its path.

Moreover, you can visualize all the traffic that traverses on all transport links (e.g., MPLS, internet, etc.) and validate current implemented SD-WAN traffic policies.
The following Sankey diagram shows the details of the traffic that flows out of Branch 1 of the SD-WAN environment, such as source/destination site, source VPN, application, DCSP, destination transport, and more.

Going Forward…
Moving forward, we will continue to drive a strong roadmap for SD-WAN visibility, including:
- Additional data sources that can give a more complete picture of the SD-WAN deployment (e.g., interface metadata, device metrics, device metadata via SNMP)
- Network health for SD-WAN
- First-class support of site-to-site traffic
- More vendor support (e.g., VeloCloud)
- An SD-WAN workflow
- And much more
If you’re ready to dive right in or have feedback, suggestions, and enhancements, please reach out to us. Or get started improving your SD-WAN monitoring and visibility today: Start a free trial of Kentik, or request a personalized demo from the Kentik team.


