Introduction
Service providers operate in an increasingly demanding market. They are challenged by the need to invest in infrastructure upgrades, a shift to cloud-hosted services, pricing pressures from their customers, a need to be innovative with new services, demands for improved performance and availability, and the risk of customer churn.
ISPs, or “eyeball networks” as they’re often called, continue to be squeezed between the need for costly infrastructure investment to support the growth of video content (e.g., Netflix) or video based services (e.g., Zoom, MS Teams, WhatsApp) and the risk of customer churn due to a perceived poor experience.
IP transit and wholesale providers are looking to differentiate themselves with value-added services, reduced latency to critical services, and improved SLAs based on performance and availability.
Service providers selling connectivity services to enterprises, such as on-ramping for cloud-hosted services, need to have a comprehensive view of the availability of those business critical services. This view needs to be not only from the perspective of the service provider but also from the perspective of the business, which could be located anywhere in the world.
About this guide
This guide explains how to use proactive synthetic, or test, agent monitoring as an easy onramp to network observability without the need to export flow and device metrics (which often require heavy setup and configuration requirements and can raise security concerns).
Measure, monitor and report on global performance
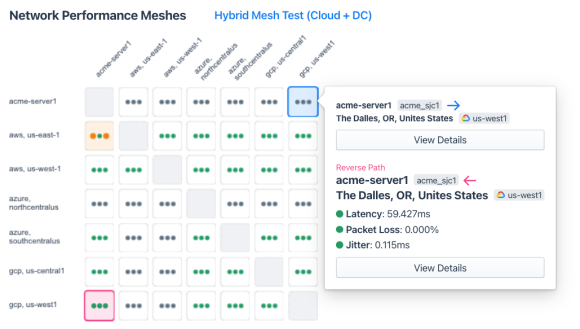
Kentik gives you the ability to test the quality of the connection between your network PoPs. We provide private agents that are simple to deploy and can be used to monitor jitter, RTT and packet loss between your PoPs. Many of our customers use this synthetic testing service to generate mesh tests that show the status and performance of their network. While setting up such meshes has traditionally required a significant time investment (with hundreds if not thousands of tests running between dozens of global PoPs), Kentik’s approach makes this as easy as clicking a couple buttons in a browser.
Visualizing the results of all of these tests has been a challenge in some systems as well. Kentik solves this by providing a bird’s-eye view of the entire global PoPs and then quickly focuses you on problem areas so that you can drill into them further to find the root cause. And because synthetic tests, by definition, are proactive in nature, all of this can be used to catch performance issues before they impact real users. Keep a pulse on response times, network bandwidth issues and/or latency variations autonomously. Intelligent alerts can be set up to notify you only when there’s a real problem.
In addition to monitoring global PoP-to-PoP connectivity proactively and using a rich traceroute driven path experience to identify root-cause issues faster, synthetic performance meshes can also be helpful for marketing and sales, too, when used in conjunction with Kentik’s public API.
See the case study.
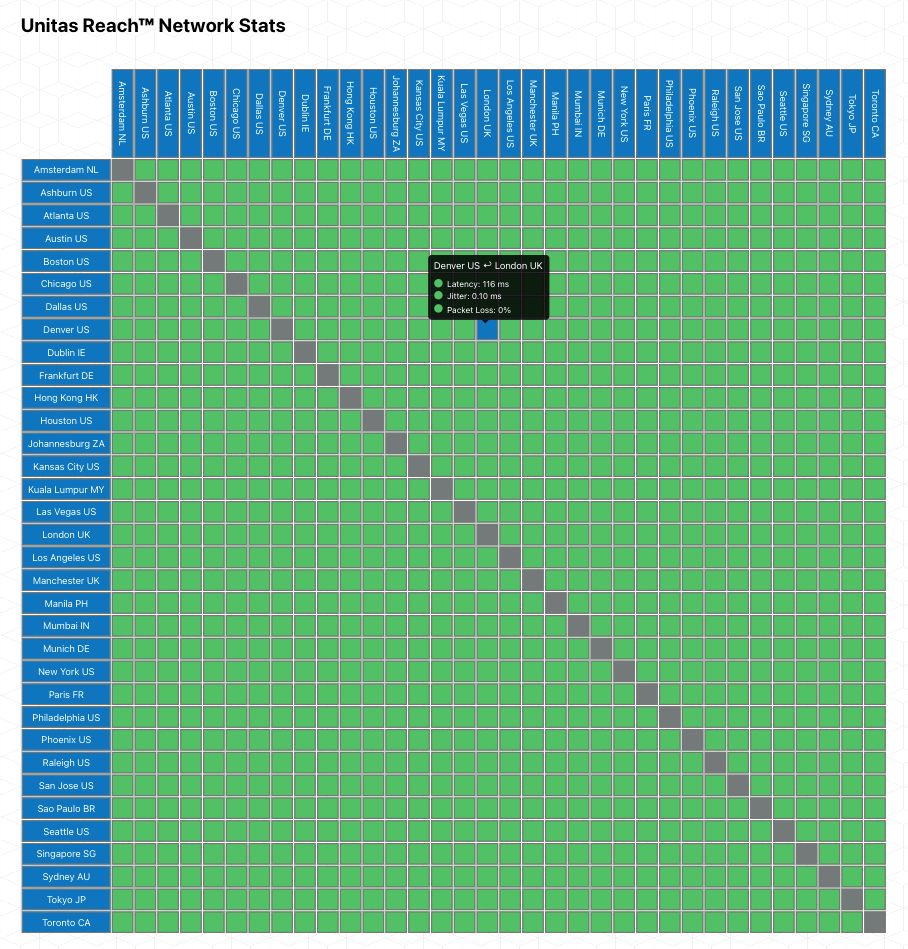
A great example of a customer who is using our synthetic testing to monitor their network is Unitas Global. They have deployed Kentik synthetic agents on their PoPs, and that information is fed through Kentik’s API into Unitas Global’s Atlas performance-monitoring tool. The results are made available to all customers via this public URL which shows the status of the communication between their PoPs as seen below:
Measure, monitor and report on content delivery
Identifying and monitoring KPIs relating to video traffic enables an ISP to identify and resolve potential problems sooner, proactively address issues before they become customer-impacting, and have improved insights to justify network infrastructure investment or optimization.
Using agents that can be installed anywhere in your network, Kentik allows you to continuously measure, monitor and alert on the key metrics that are important to the experience of your subscribers when consuming video content or when using video based services for communication.
On-net CDNs are widely deployed to reduce off-net traffic and enhance the delivery quality for subscribers. However, these CDNs need to be refreshed, and the content then needs to be streamed to the subscriber with a minimum latency and jitter to ensure an acceptable user experience.
Installing Kentik synthetic agents at your CDN locations and your subscriber edge routers allows for the continuous measuring of latency, packet loss and jitter between the content source and the local content destination. Any deviation above a maximum latency threshold generates an alert that provides early warning of a potential problem. Tracking latency over a period of time could provide an early indication of the need to build out additional CDN resources to satisfy an increasing demand and maintain high customer satisfaction.
Reports on a network-wide basis, providing a matrix of performance between all content sources and all destinations, can be quickly created for consumption by internal or external teams. Better yet, Kentik incorporates autonomous tests which are a Kentik-unique concept that frees you from the burden of identifying specific destination IP addresses and setting up tests one by one. Just pick a specific type of entity (ASN, CDN, country, region or city) that you would like to test performance towards. Kentik shows you a list of entities of a specific type, ordered by the amount of traffic you have going towards it. Also, these tests can auto-update as your traffic shifts.

Measure, monitor and report on apps and cloud
Kentik has globally deployed over 250 synthetic agents that constantly monitor the performance of cloud-hosted applications and the networks that enable access to those services. Via easy-to-monitor dashboards, you can immediately see if the performance of a SaaS application may be causing problems for your customers. Keep tabs on the elements that make up the user experience and be in a position to be the connectivity expert for your customers.
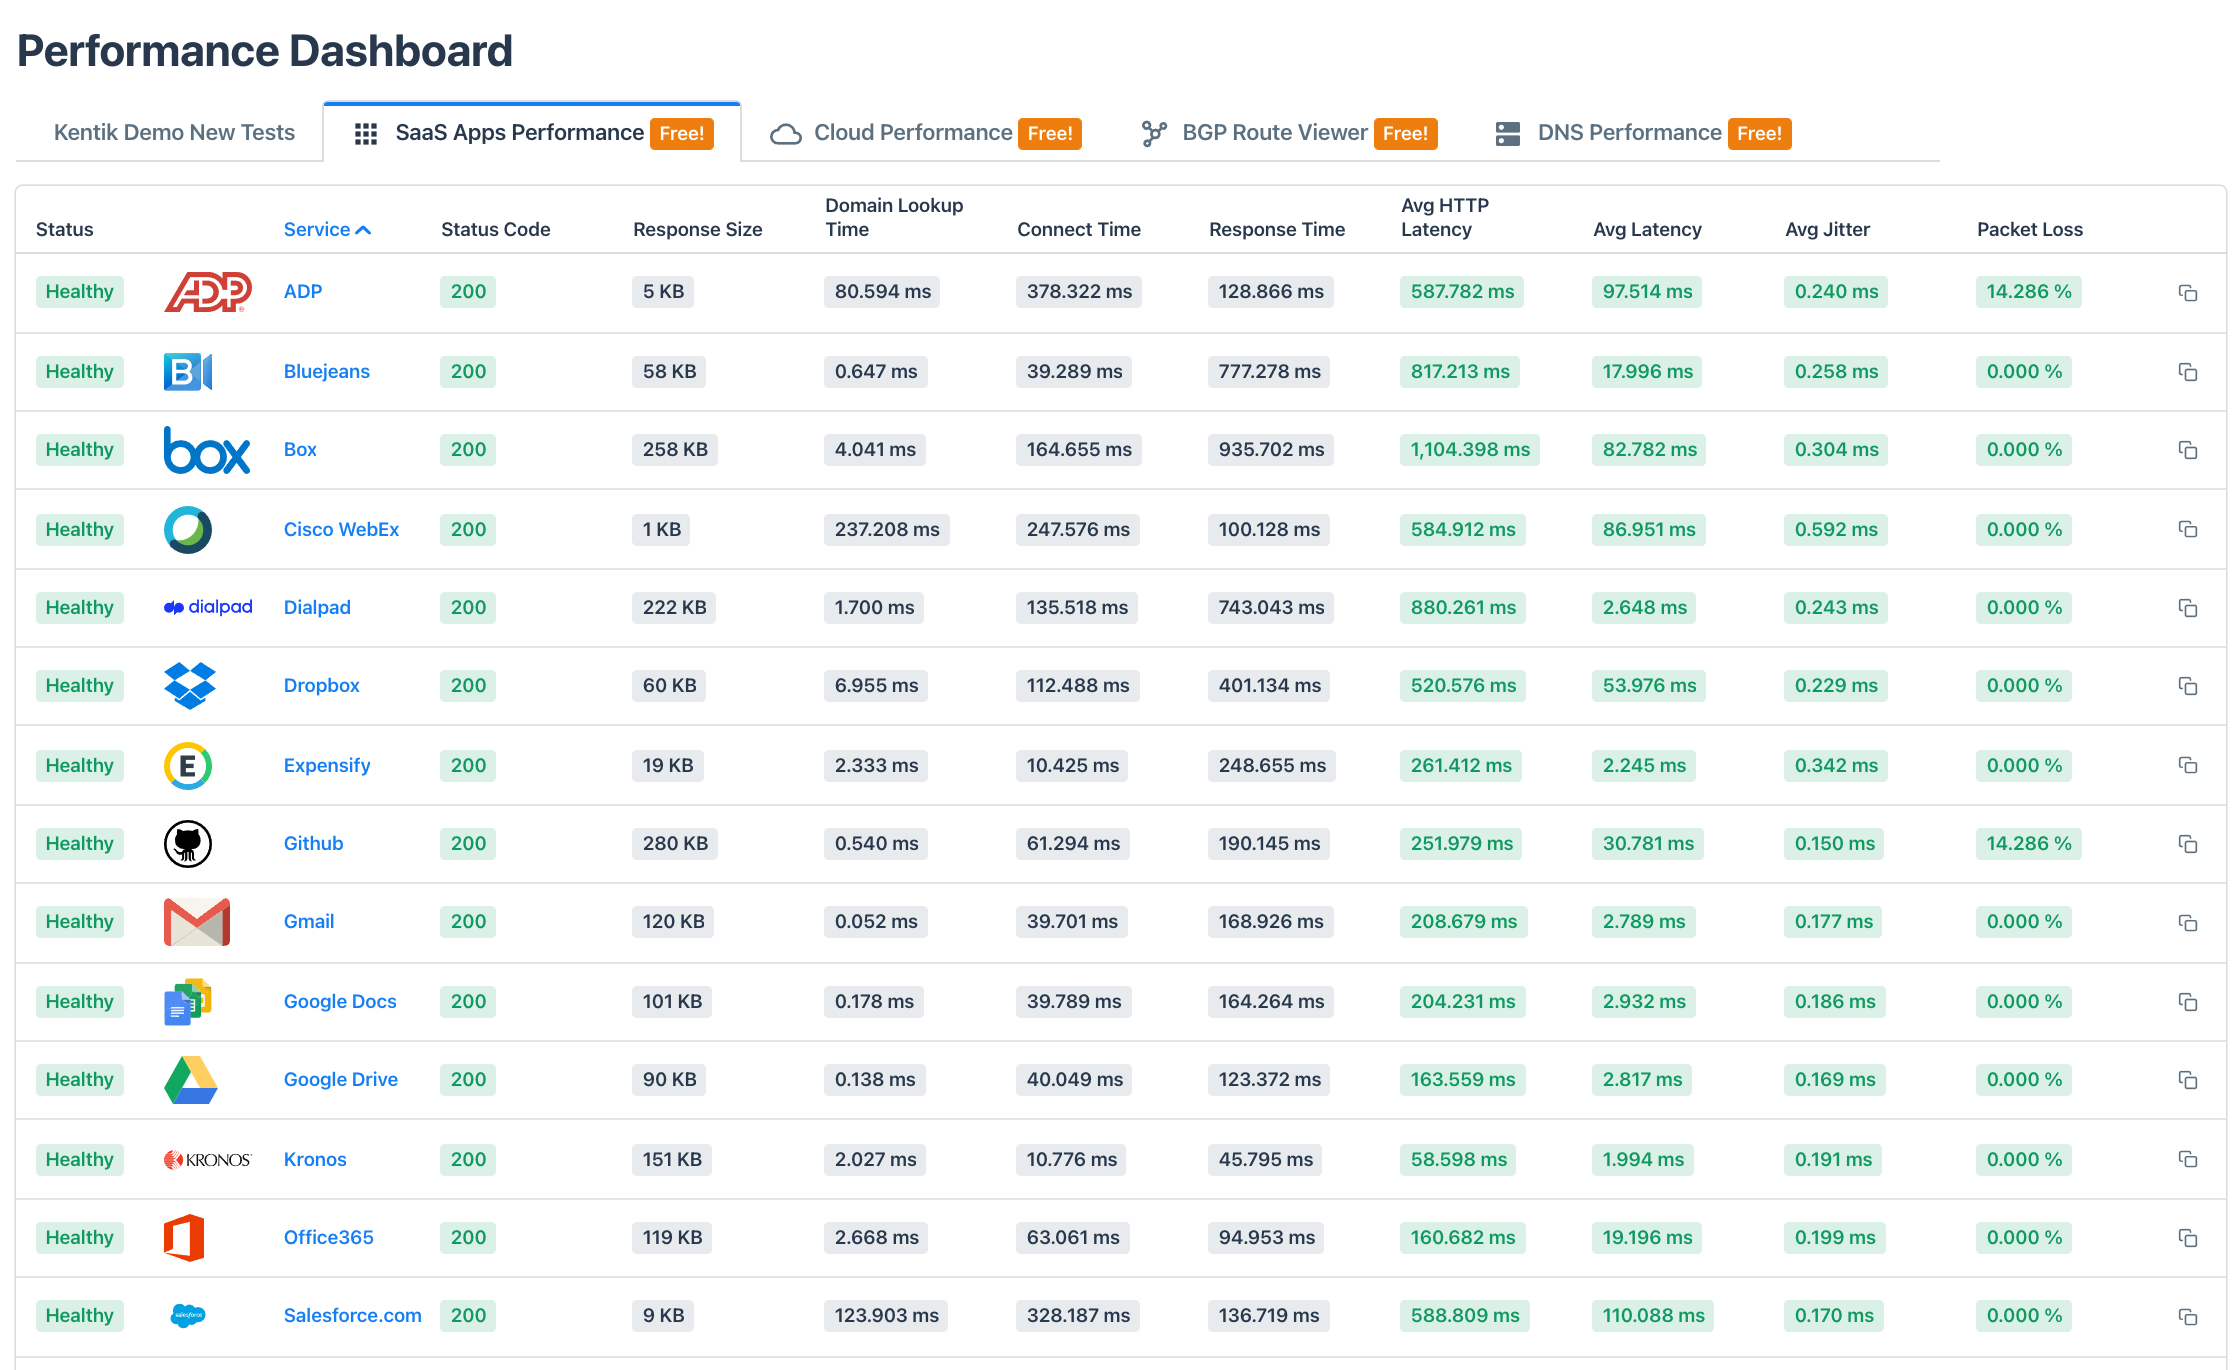
With Kentik you can also view the status of regions within, for example, AWS and Azure by simply looking at the mesh tests generated by our synthetic agents and run continuously. This helps you pinpoint or eliminate customer issues. You can also test the performance of the connection from your own data centers to cloud regions as seen below.

Summary
Kentik offers a cost effective and easy-to-deploy means to measure, monitor and report on the KPIs that are critical to the success of the network-based services that service providers offer. Reach out to our team for a demo or to start a free trial.
Platform
Solutions
- Reduce Cloud Spend
- Migrate To and From Any Cloud
- Improve Cloud Performance
- Optimize Enterprise WAN
- Network Performance Monitoring
- Deliver Exceptional Digital Experiences
- Detect and Mitigate DDoS
- Harden Network Policy Management
- Investigate Security Incidents
- Visualize All Cloud and Network Traffic
- Troubleshoot Any Network
- Understand Internet Performance
- Optimize Data Center Networks
- Consolidate Legacy Tools
- Optimize Peering and Transit
- Plan Network Capacity
- Reduce Network Spend
- Grow Subscriber Revenue
