Network Performance Monitoring (NPM): Tools, Metrics & Best Practices
Network performance monitoring (NPM) is essential for understanding and optimizing the performance of today’s increasingly complex digital networks. This fundamental process helps NetOps teams detect and resolve issues proactively, optimize overall network performance, and ensure superior end-user experiences. Choosing the best network performance monitoring tool requires NetOps professionals to understand the complexities of today’s cloud-based networks and the evolving capabilities of network monitoring solutions.
Network Performance Monitoring at a Glance
- What it is: Network performance monitoring is the practice of measuring, diagnosing, and optimizing service quality across on-prem, cloud, and hybrid networks using device metrics, traffic flows, routing context, and active tests.
- Key metrics: Latency (RTT), packet loss, jitter, throughput, bandwidth utilization, errors, and application-layer signals like DNS and HTTP response time.
- Core data sources: SNMP and streaming telemetry, flow telemetry (NetFlow/IPFIX/sFlow), cloud flow logs, synthetic monitoring, and optionally packet capture or host agents.
- Why it matters: Proactive NPM reduces downtime, accelerates root-cause analysis, supports capacity planning, and improves end-user experience across increasingly distributed networks.
- Modern shift: The best NPM programs are evolving from device-centric monitoring toward network intelligence — correlating traffic, routing, cost, and experience data for faster, more complete answers.
What is Network Performance Monitoring (NPM)?
Network performance monitoring (NPM) is the process of measuring, diagnosing, and optimizing the service quality of a network as experienced by users. Network performance monitoring tools combine various types of network data (for example, packet data, network flow data, metrics from multiple types of network infrastructure devices, and synthetic tests) to analyze a network’s performance, availability, and other important metrics.
NPM solutions may enable real-time, historical, or even predictive analysis of a network’s performance over time. NPM solutions can also play a role in understanding the quality of end-user experience using network performance data—especially data gathered from active, synthetic testing (in contrast to passive forms of network performance monitoring such as packet or flow data collection).
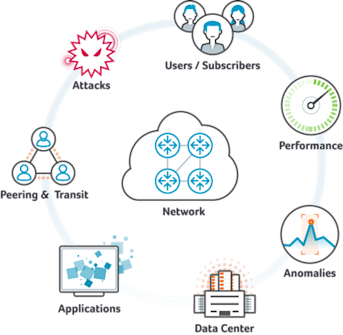
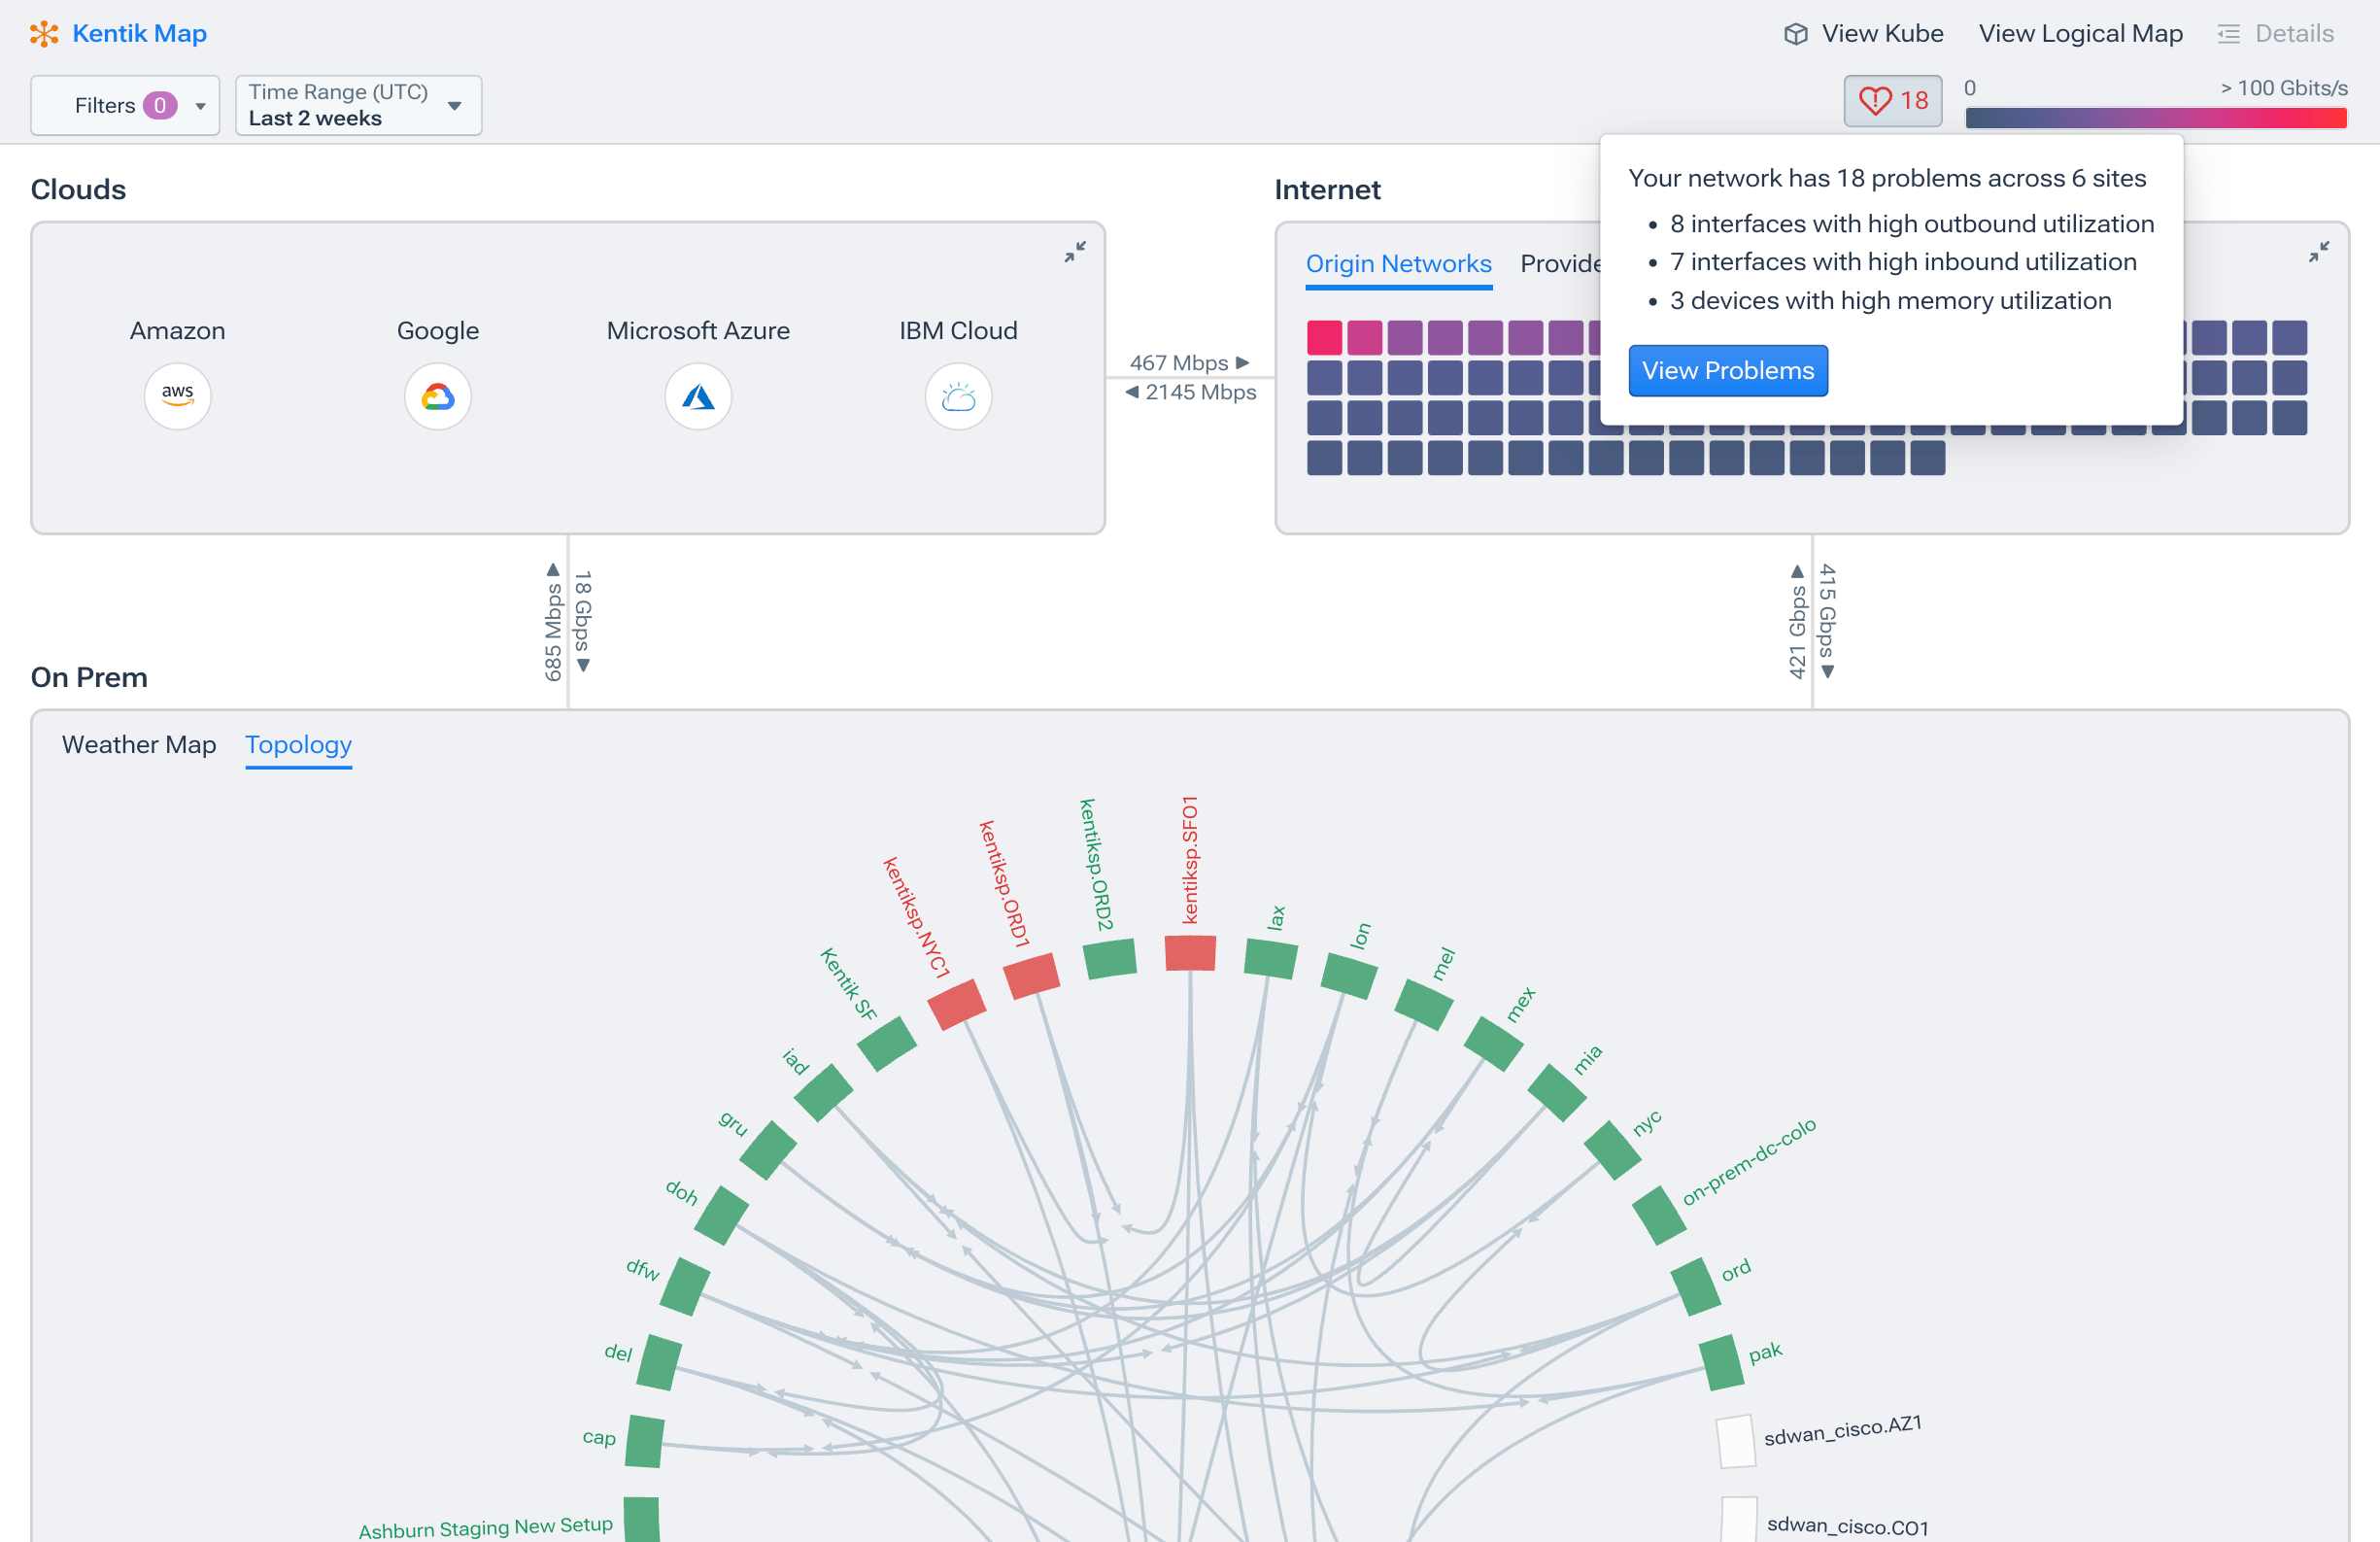
Kentik is a network intelligence platform that combines SNMP and streaming telemetry, flow data and cloud flow logs, and synthetic testing to monitor performance across hybrid and multi-cloud networks. Kentik AI features help teams triage incidents faster by turning telemetry into clear, actionable explanations — reducing mean time to resolution from hours to minutes.
Learn how AI-powered insights help you predict issues, optimize performance, reduce costs, and enhance security.

Why is Network Performance Monitoring Important?
Network Performance Monitoring (NPM) is essential for ensuring network reliability, optimizing performance, and enhancing security. NPM tools help detect issues proactively, leading to reduced downtime and improved user experience. NPM can also provide insights for resource allocation and network capacity planning, which lowers costs. NPM also identifies unusual traffic patterns that may indicate security threats, allowing for quick intervention. NPM solutions ensure that networks are efficient, resilient, and secure, with a goal of ensuring business success and user satisfaction.
Key Network Performance Monitoring Metrics and Data
NPM requires multiple types of measurement or monitoring data on which engineers can perform diagnoses and analyses. Example categories of network performance metrics are:
-
Bandwidth: Measures the raw versus available maximum rate that information can be transferred through various points of the network or along a network path. (Learn more about bandwidth utilization monitoring.)
-
Throughput: Measures how much information is being or has been transferred.
-
Latency: Measures network delays from the perspective of network devices such as clients, servers, and applications. Latency is often measured as round trip time, which includes the time for a packet to travel from its source to its destination and for the source to receive a response.
-
Packet Loss: Measures the percentage of data packets that fail to reach their intended destination. High packet loss can lead to higher latency, as the sender must retransmit the lost packets, causing additional delays in data transmission.
-
Jitter: Measures the inconsistency of data packet arrival intervals or the variation in latency over time.
-
Errors: Measures raw numbers and percentages of errors, such as bit errors, TCP retransmissions, and out-of-order packets.
NPM vs. NPMD
NPM solutions are sometimes referred to as “Network Performance Monitoring and Diagnostics” (NPMD) solutions. Most notably, industry analyst firm Gartner calls this the NPMD market, which it defines (in its Market Guide for Network Performance Monitoring and Diagnostics) as “tools that leverage a combination of data sources. These include network-device-generated health metrics and events; network-device-generated traffic data (e.g., flow-based data sources); and raw network packets that provide historical, real-time, and predictive views into the availability and performance of the network and the application traffic running on it.”

Network Performance Monitoring Tools in 2026
Network performance monitoring tools are often discussed as “NPMD” tools because the most useful platforms combine multiple data sources, such as device health metrics, flow data, packet data, and synthetic testing. The best tool depends on what you need to measure, what you need to troubleshoot, and whether your environment is primarily on-prem, hybrid, or multi-cloud.
Categories of NPM tools
Most network performance monitoring stacks fall into four buckets:
- Network intelligence platforms that correlate traffic (flows), routing/path context, and cloud telemetry to speed root-cause and cost decisions. Kentik is purpose-built for this approach — combining flow, BGP, device telemetry, cloud flow logs, and synthetic testing in a single SaaS platform.
- Traditional NPM/NPMD suites focused on device and interface health, alerting workflows, and “classic” NPM dashboards (examples include SolarWinds NPM and PRTG).
- Full-stack observability platforms with network modules, where NPM is one layer of end-to-end observability (examples include Datadog and Dynatrace).
- Digital Experience Monitoring (DEM) tools (synthetics + internet/SaaS path visibility) that measure the experience from the user’s perspective (examples include Cisco ThousandEyes and Catchpoint).
For a detailed comparison of specific tools across all four categories, see our in-depth guide: Best Network Monitoring Tools for 2026: Enterprise, Cloud, MSP & Open-Source Options.
What to look for in an NPM tool
Use this checklist when evaluating NPM platforms:
- Telemetry coverage: SNMP + streaming telemetry, flow (NetFlow/IPFIX/sFlow/J-Flow), cloud flow logs, and (optionally) packets and synthetics.
- Hybrid/multi-cloud support: Consistent visibility across AWS, Azure, and Google Cloud plus on-prem dependencies.
- Path visibility: Ability to connect performance symptoms to path changes and routing behavior, not just device status.
- Time-to-answer: Fast query and investigation workflows for “what changed?” and “who is impacted?”
- Alerting quality: Baselines, severity tiers, and noise controls (maintenance windows/suppression).
- Integrations: Ticketing/chatops, SIEM, automation, and data export as needed.
- Retention and scale: Enough historical detail to investigate incidents without throwing away data.
Network Performance Monitoring Data Collection
Network performance monitoring has traditionally relied on data sources such as SNMP polling, traffic flow record export, and packet capture (PCAP) appliances to understand the status of network devices. A host monitoring agent combined with a SaaS/big data back-end model provides an additional, more cloud-friendly approach. Modern NPM solutions also provide the ability to ingest and analyze cloud flow logs created by cloud-based systems (such as AWS, Azure, Google Cloud, etc.).
The following sections cover the primary data collection methods that power modern NPM programs.
SNMP Polling
SNMP (Simple Network Management Protocol) is an IETF standard protocol, the most common method for gathering total bandwidth, CPU/memory utilization, available bandwidth, error measurements, and other network device-specific information on a per-interface basis. SNMP uses a polling-based approach via management information bases (MIBs) such as the standards-based SNMP MIB-II for TCP/IP-based networks. Typically, large networks only poll in five-minute intervals to avoid overloading the network with management data. A downside of SNMP polling is the lack of granularity since multi-minute polling intervals can mask the bursty nature of network data flows, and interface counters only provide an interface-centric view.
Streaming Telemetry
Streaming telemetry is sometimes described as the next evolutionary step from SNMP in network monitoring metrics collection. It differs from SNMP in how it works, if not in the information it provides. Streaming telemetry solves some of the problems inherent in the polling-based approach of SNMP.
The various forms of streaming telemetry, such as gNMI, structured data approaches (like YANG), and other proprietary methods, offer near-real-time data from network devices. Instead of waiting minutes for the subsequent polling to occur, network administrators get information about their devices in near real-time.
Because data is pushed in real-time from the devices and not polled at prescribed intervals, streaming telemetry can provide far higher-resolution data compared to SNMP. This push-based model is generally more efficient than SNMP. Streaming telemetry processing often happens in hardware at the ASIC itself instead of on the device’s CPU. As a result, it can scale in more extensive networks without affecting the performance of individual network devices. (See our blog post for a more in-depth look at streaming telemetry vs SNMP.)
Traffic Flow Record Export
Traffic flow records are generated by routers, switches, and dedicated software programs by monitoring key statistics for uni-directional “flows” of packets between specific source and destination IP addresses, protocols (TCP, UDP, ICMP), port numbers and ToS (plus other optional criteria). Every time a flow ends or hits a pre-configured timer limit, the flow statistics gathering is stopped, and those statistics are written to a flow record, which is sent or “exported” to a flow collector server.
There are several flow collection standards, including NetFlow, sFlow and IPFIX. NetFlow is the trade version created by Cisco and has become a de facto industry standard. sFlow and IPFIX are multi-vendor standards, one governed by InMon and the other specified by the Internet Engineering Task Force (IETF).
Advantages of NetFlow as Part of Network Performance Monitoring
Flow records are far more voluminous than SNMP records but provide valuable details on actual traffic flows. The statistics from flow records can be utilized to create a picture of actual throughput. Flow information can also be used to calculate interface utilization by reference to total interface bandwidth. Additionally, since flow data must include source and destination IP addresses, it is possible to map recorded flows to routing data such as BGP routing internet paths. This data integration is highly valuable for network performance monitoring because the network or internet path may correlate to performance problems occurring in particular networks (known as Autonomous Systems in BGP parlance) that comprise an internet path.
Network Flow Sampling
NetFlow records statistics based only on the packet headers—and not on any packet data payload contents—so the information is metadata rather than payload data. While it is possible to measure every flow, most practical network implementations use some degree of “sampling” where the NetFlow exporter only monitors one in a thousand or more flows. Sampling limits the fidelity of NetFlow data, but in a large network, even 1:8000 sampling is considered statistically accurate for network performance management purposes.
VPC/Cloud Flow Logs
Like flow records generated by network infrastructure components, cloud-based applications, systems, and virtual private clouds can also export network flow data. For example, in AWS (Amazon Web Services), virtual private clouds can be configured to capture and export “VPC Flow Logs” which provide information about the IP traffic going to and from network interfaces in a given VPC.
As in NetFlow-type sampling, VPC Flow Logs record a sample of network flows sent from and received by various cloud infrastructure components (such as instances of virtual machines, Kubernetes nodes, etc.). These network flows can be ingested by an NPM solution to provide network monitoring and analytics for cloud-based networks.
Packet Capture (PCAP) Software and Appliances
Packet capture involves recording every packet that passes across a particular network interface. With PCAP data, the information collected is granular since it includes both packet headers and full payload. Since an interface will see packets going in and out, PCAP can precisely measure latency between an outbound packet and its inbound response, for example. PCAP provides the richest source of network performance data.
PCAP can be performed using open-source network utilities such as tcpdump and Wireshark on an individual server. This can be a very effective way to understand network performance issues for a skilled technician. However, since it is a manual process requiring fairly in-depth knowledge of the utilities, it is not scalable.
To improve on this manual approach, an appliance-based PCAP probe may be used. The probe has multiple interfaces connected to router or switch span ports or to an intervening packet broker device (such as those offered by Gigamon or Ixia). In some cases, virtual probes can be used, but they depend on network links in one form or another.
Limitations of Packet Capture Appliances
A major downside to PCAP appliances is the expense of deployment. Physical and virtual appliances are costly from a hardware and (in the case of commercial solutions) software licensing point of view. As a result, in most cases, it is only fiscally feasible to deploy PCAP probes to relatively few selected points in the network. In addition, the appliance deployment model was developed based on pre-cloud assumptions of centralized data centers of limited scale, holding relatively monolithic application instances.
As cloud and distributed application models have proliferated, the appliance model for packet capture is less feasible because of the wide distribution of application components in VMs or containers. In many cloud hosting environments, there is no way to even deploy a virtual appliance.
Host Agent Network Performance Monitoring
A cloud-friendly and highly scalable model for network performance monitoring combines the deployment of lightweight host-based monitoring agents that export PCAP-based statistics gathered on servers and open-source proxy servers such as HAProxy and NGNIX. Exported statistics are sent to a SaaS repository that scales horizontally to store unsummarized data and provides big data-based analytics for alerting, diagnostics, and other use cases.
While host-based performance metric export doesn’t provide the full granularity of raw PCAP, it provides a highly scalable and cost-effective method for ubiquitously gathering, retaining, and analyzing critical performance data, and thus complements PCAP. An example of a host-based NPM agent is Kentik’s kprobe.
As remote and hybrid work patterns push more traffic through VPNs, ZTNA tunnels, and direct-to-cloud paths that bypass traditional monitoring points, host-based agents also help close a growing endpoint visibility gap. By capturing performance data directly from the user’s device or the application host, agents can surface Wi-Fi instability, ISP-level degradation, and encrypted-path issues that flow collectors and SNMP never see. This makes agent-based monitoring an increasingly important complement to passive and synthetic approaches — especially for teams responsible for digital experience across distributed workforces.
Synthetic Monitoring and Synthetic Testing
Modern Network Performance Monitoring solutions increasingly incorporate synthetic monitoring features, which are traditionally associated with a process/market called “Digital Experience Monitoring”. In contrast to flow or packet capture (which we might characterize as passive forms of monitoring), synthetic monitoring is a means of proactively tracking the performance and health of networks, applications, and services.
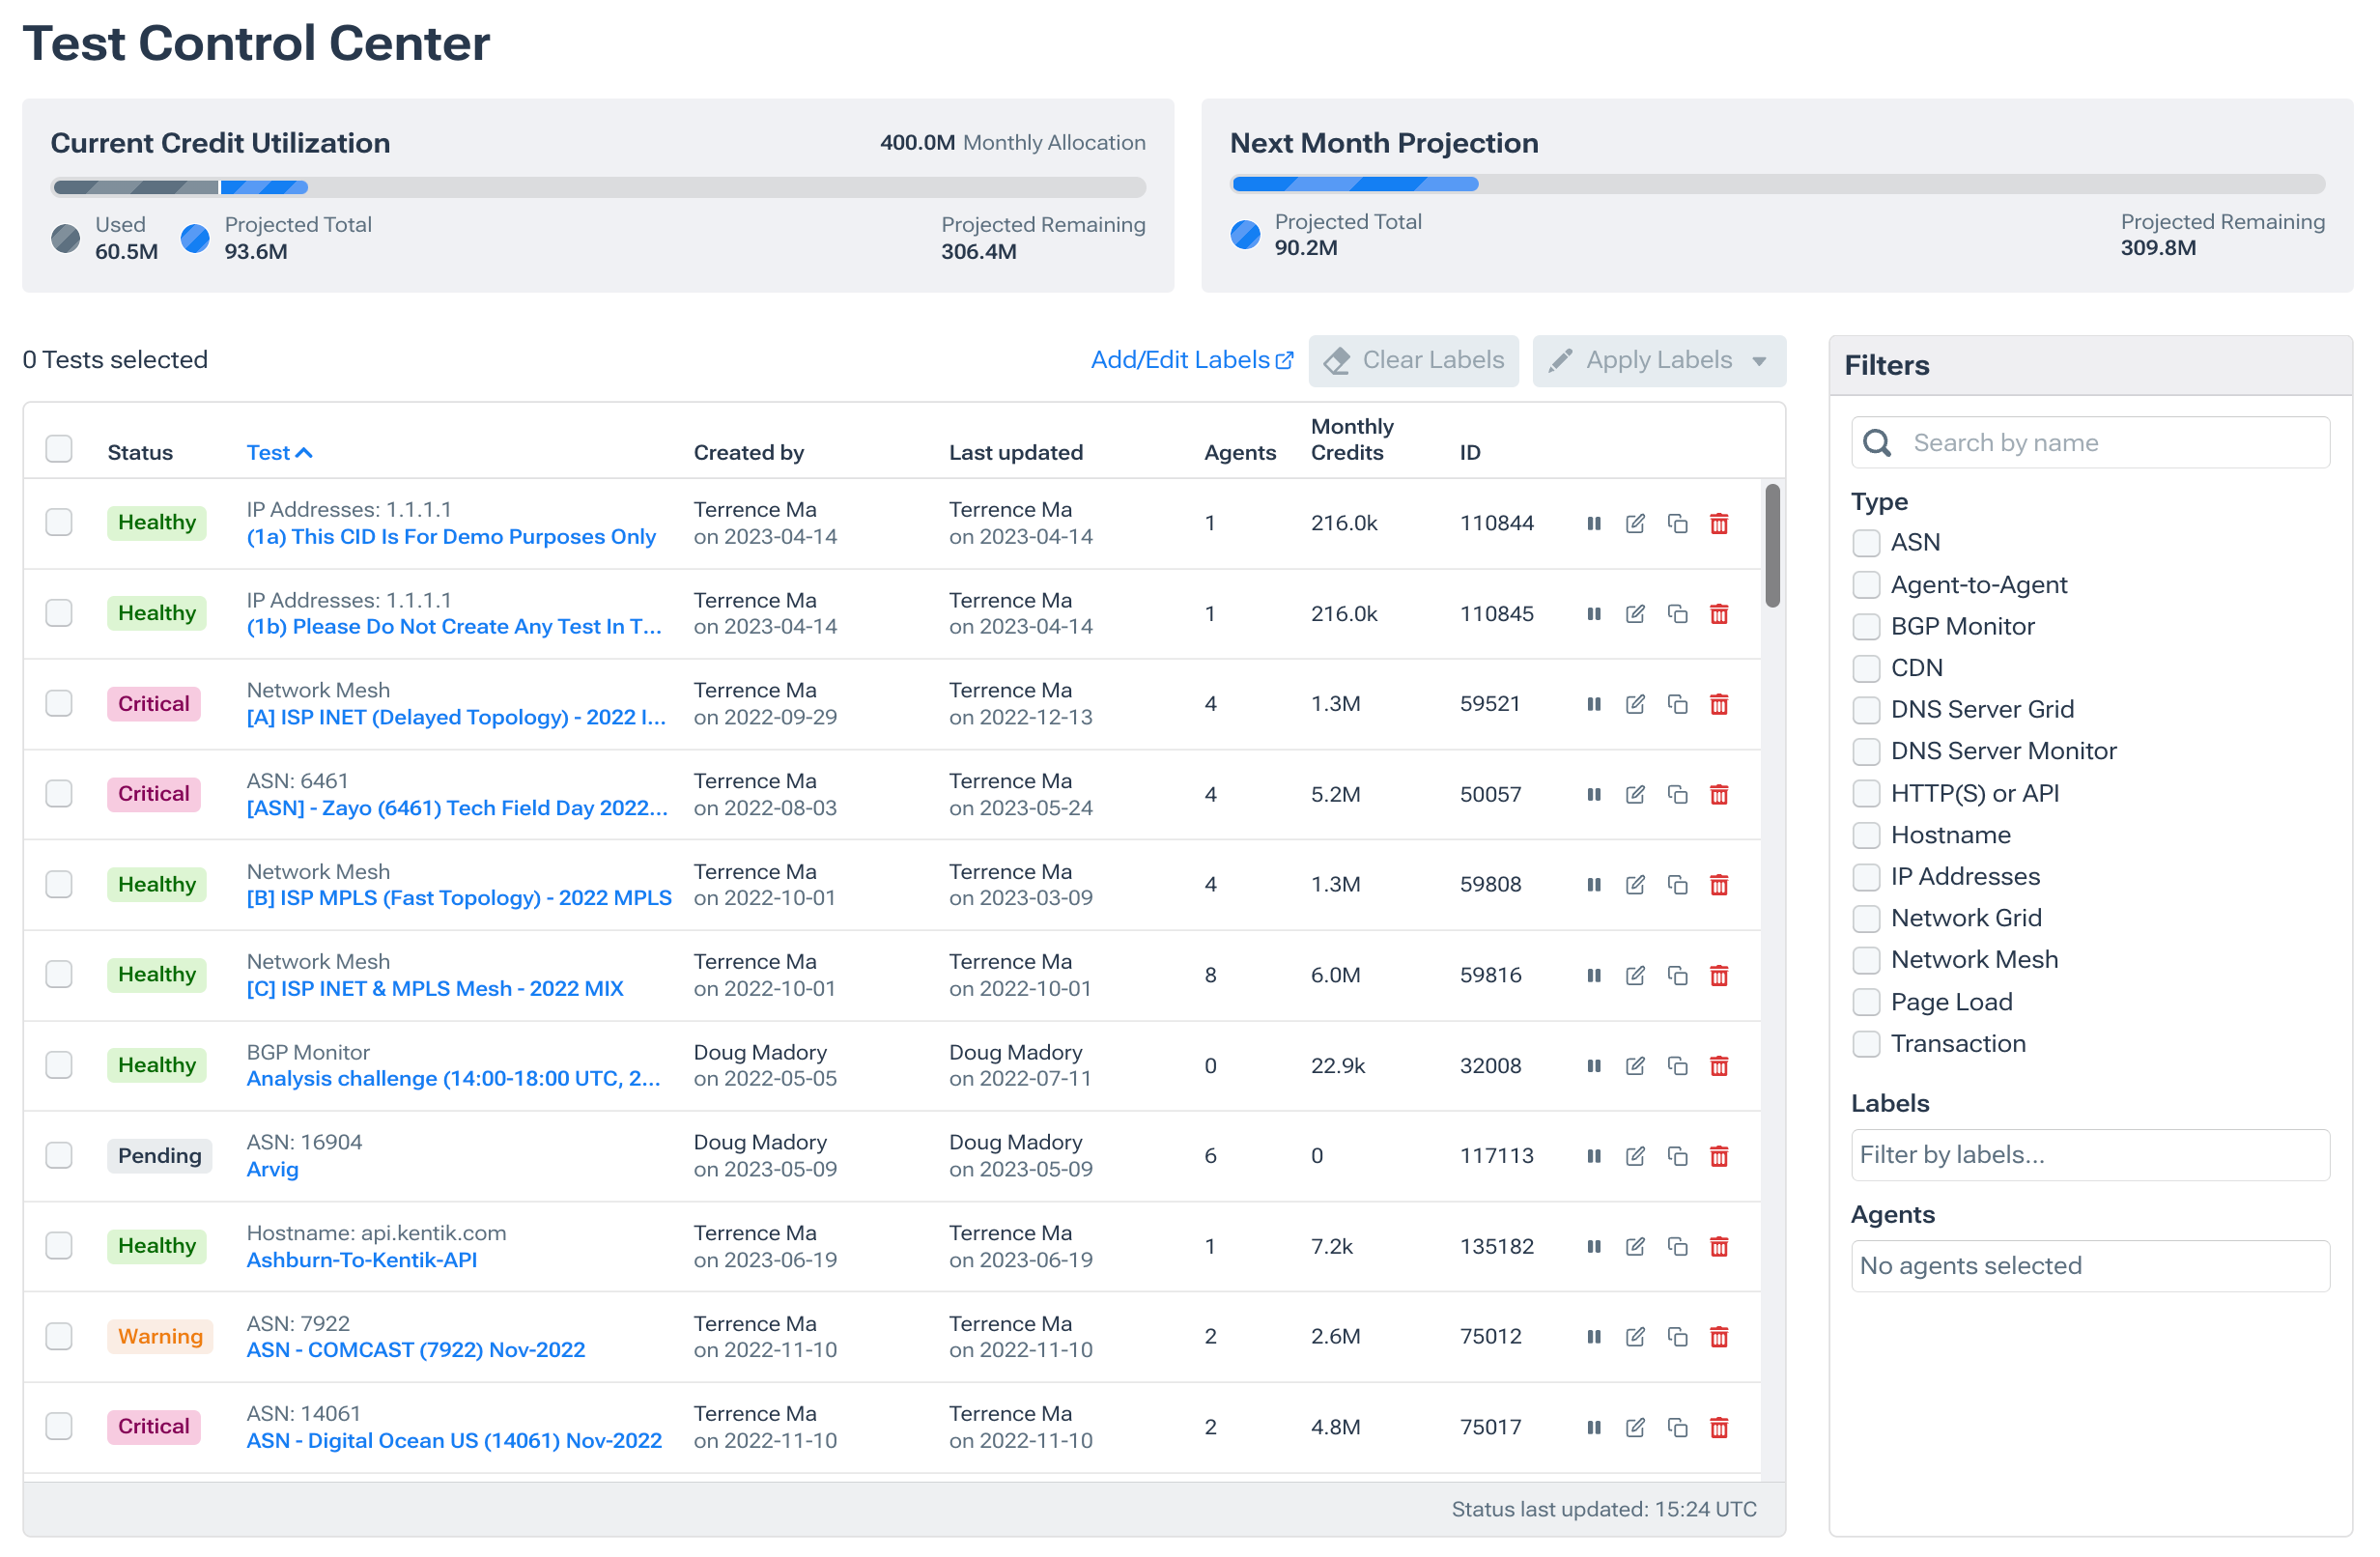
In the networking context, synthetic monitoring means imitating different network conditions and/or simulating differing user conditions and behaviors. Synthetic monitoring achieves this by generating various types of traffic (e.g., network, DNS, HTTP, web, etc.), sending it to a specific target (e.g., IP address, server, host, web page, etc.), measuring metrics associated with that “test” and then building KPIs using those metrics.
(See also: “What is Synthetic Transaction Monitoring” and “Synthetic Monitoring vs Real User Monitoring.”)
Other Integrations Important to NPM and Network Observability
NPM data sources are not limited to the abovementioned types and may encompass many events, device metrics, streaming telemetry, and contextual information. In this short video, Kentik CEO Avi Freedman discusses the many types of data and integrations that are important to improving network observability.
This video is a brief excerpt from “5 Problems Your Current Network Monitoring Can’t Solve (That Network Observability Can)”—you can watch the entire presentation here.
Benefits of Network Performance Monitoring
Network performance monitoring tools provide numerous benefits for NetOps professionals and organizations. These benefits improve network visibility, reliability, and efficiency, ultimately leading to better user experiences and business outcomes. Key benefits of NPM include:
-
Proactive issue detection: NPM tools enable early identification of network problems, allowing teams to address and resolve issues before they escalate and impact end users or critical business operations.
-
Faster network troubleshooting: With comprehensive visibility into network traffic and performance data, NetOps professionals can more efficiently pinpoint the root cause of network issues, reducing the time it takes to resolve problems and minimizing network downtime.
-
Optimized network performance: NPM solutions provide insights into network bottlenecks, latency, and other performance-related issues, enabling organizations to optimize their networks for better performance and user experiences.
-
Capacity planning and resource allocation: By monitoring network utilization and performance trends, NPM tools help organizations make informed decisions about capacity planning, resource allocation, and infrastructure investments to meet current and future demands.
-
Enhanced security: NPM solutions can help identify unusual traffic patterns, potential DDoS attacks, and other network security threats, allowing organizations to take swift action to protect their networks and data.
-
AI-accelerated troubleshooting: Modern NPM platforms increasingly use AI to convert raw telemetry into guided investigations — summarizing likely scope and drivers, recommending next diagnostic steps, and reducing mean time to resolution from hours to minutes. Kentik AI Advisor exemplifies this approach, letting NetOps teams and non-experts alike ask natural-language questions about network performance and get actionable, telemetry-grounded answers.
-
Improved end-user experience: Proactively monitoring and optimizing network performance ultimately leads to better end-user experiences, which can have a direct impact on customer satisfaction, employee productivity, and overall business success.
Network Performance Monitoring Challenges
Despite the many benefits of network performance monitoring, there are also challenges that NetOps professionals and organizations must contend with. Some of the key challenges include:
-
Complexity and scale: Modern networks are increasingly complex, spanning on-premises, cloud, hybrid environments, and container networking environments (e.g., Kubernetes). Managing and monitoring performance across these diverse and often large-scale networks can be challenging, particularly as organizations adopt new technologies and services.
-
Data overload: Network monitoring systems generate vast amounts of data from multiple sources, including flow records, packet capture, and host agents. Managing and analyzing this data to extract meaningful insights can be overwhelming, requiring the right tools and expertise.
-
Integration with other tools and systems: Network monitoring tools must often integrate with many other network management tools, security systems, and IT infrastructure components. Ensuring seamless integration and data sharing between these disparate systems can be challenging.
-
Cost and resource constraints: Deploying and maintaining network performance monitoring solutions can be expensive, particularly for large-scale networks or when using appliance-based packet capture probes. Organizations must balance the need for comprehensive network monitoring and visibility with cost and resource constraints.
-
Keeping pace with technological advancements: As network technologies evolve, network monitoring tools and methodologies must keep pace. NetOps professionals must stay informed about the latest developments and best practices in network performance monitoring to ensure their organizations remain agile and competitive.
Network Performance Monitoring Best Practices
To maximize the value of network performance monitoring and overcome its challenges, NetOps professionals should consider adopting the following best practices:
-
Leverage multiple data sources: Utilize a variety of data sources, including SNMP polling, traffic flow records, packet capture, host agents, and synthetic monitoring, to gain a comprehensive view of network performance.
-
Establish performance baselines: Determine baseline performance metrics for your network to identify deviations and potential issues quickly. Regularly review and update these baselines as your network evolves.
-
Implement proactive monitoring and alerting: Set up proactive monitoring and alerting to detect performance issues before they impact end users or business operations. Fine-tune alert thresholds to minimize false positives and ensure timely notifications.
-
Invest in scalable, cloud-friendly NPM solutions: Choose network performance monitoring tools that can scale to meet the growing needs of your entire network and are compatible with cloud-based, multicloud, and hybrid environments.
-
Continuously review and optimize: Network performance monitoring should be an ongoing, iterative process. As the network environment changes, network administrators should continuously review and adjust monitoring strategies, baselines, and optimization efforts to ensure the network remains in optimal condition.
Related Network Performance Monitoring Topics
- Best Network Monitoring Tools for 2026: Enterprise, Cloud, MSP & Open-Source Options
- What Is Network Observability?
- What Is Network Monitoring? Tools, Telemetry & Trends (2026)
- Network Performance Monitoring Use Cases
- Network Performance Monitoring Metrics
- Cloud Network Performance Monitoring
- The Role of Network Observability in Modern Application Performance Monitoring
- The Evolution of Network Monitoring: From SNMP to Network Observability
- A Guide to Network Monitoring Protocols
- SolarWinds Alternatives: Modern Network Monitoring (NPM and NTA) Tools for Enterprises and Service Providers
- Datadog Alternatives: When Full-Stack Observability Isn’t Enough for the Network
- LogicMonitor Alternatives: Modern Options for Network Intelligence and Hybrid Observability
FAQs about Network Performance Monitoring
What is the difference between network monitoring and network observability?
Traditional network monitoring focuses on collecting device-level health data (interface status, CPU, memory, up/down alerts) and comparing metrics against fixed thresholds. Network observability goes further by correlating multiple telemetry sources — traffic flows, routing context, synthetic tests, cloud flow logs, and device metrics — so teams can ask open-ended questions and investigate unforeseen problems, not just detect known failure modes. The practical difference is time-to-answer: observability-driven workflows let you move from symptom to root cause far faster because the data is already correlated. Kentik is built on this model, combining all of these data sources in a network intelligence platform designed for fast, context-rich investigation. See also: What Is Network Observability?
Can a network intelligence platform replace legacy NPM tools like SolarWinds or NETSCOUT?
In many cases, yes. Teams replacing legacy NPM tools typically consolidate device monitoring, flow analytics, and synthetic testing into a single platform that also covers cloud and hybrid environments — eliminating the need for separate appliance-based tools. The key criteria are telemetry coverage (SNMP, streaming telemetry, flow, cloud flow logs, synthetics), scalability without on-prem infrastructure overhead, and the ability to correlate across data sources for faster troubleshooting. Kentik is designed as this kind of replacement: a SaaS-based network intelligence platform that brings device monitoring, traffic analytics, and active testing together with AI-assisted triage. See also: SolarWinds Alternatives and The Evolution of Network Monitoring.
What are the best network performance monitoring tools for hybrid and multi-cloud networks?
The best NPM tool depends on whether you primarily troubleshoot from device health, traffic behavior, or user experience. Hybrid and multi-cloud teams typically prioritize platforms that unify SNMP plus streaming telemetry, flow plus cloud flow logs, and synthetic testing, then correlate symptoms to path and routing changes. Kentik is built for this correlated model in a single SaaS platform with end-to-end NPM coverage across on-prem, cloud, and internet paths. For a detailed comparison of tools across all NPM categories, see: Best Network Monitoring Tools for 2026.
What is the difference between NPM, NPMD, and an NMS?
In practice, an NMS focuses on device and interface health plus alerting, NPM expands the focus to network service quality and experience, and NPMD emphasizes diagnostic workflows powered by multiple data sources (device metrics/events, traffic data, and sometimes packets). Kentik brings these together by pairing modern device monitoring (SNMP plus streaming telemetry) with traffic and experience context for faster root-cause workflows. See also: NMS Overview.
Which metrics matter most for network performance monitoring?
Most NPM programs track latency (RTT), packet loss, jitter, throughput and bandwidth utilization, and errors (including retransmits and interface errors), then add experience signals like DNS resolution time, TLS handshake time, and HTTP/API responsiveness for user-facing services. Kentik supports these signals by combining device metrics and traffic analytics with synthetic tests that measure network and application-layer experience. See also: Synthetic Testing and Monitoring.
What data sources should an NPM program collect?
A complete NPM approach typically combines SNMP and streaming telemetry, flow telemetry (NetFlow, IPFIX, sFlow, and cloud flow logs), routing and path context, synthetic testing, and optionally packet capture or host and Kubernetes agents when you need deeper diagnostics. Kentik is designed to ingest and correlate these sources so performance issues can be explained in context instead of isolated dashboards. See also: The Kentik Network Intelligence Platform.
When should I use streaming telemetry vs SNMP polling?
SNMP polling is broadly supported and great for coverage, but it is often collected at multi-minute intervals that can miss fast events. Streaming telemetry is push-based and higher-resolution for near-real-time visibility. Many teams run both, and Kentik NMS supports SNMP plus streaming telemetry so you can keep coverage while increasing fidelity where it matters most. See also: The Benefits and Drawbacks of SNMP and Streaming Telemetry.
How does flow telemetry improve network performance monitoring?
Flow telemetry reveals who is talking to whom, when, and how much, which helps explain utilization spikes, identify top talkers, map traffic shifts to apps and destinations, and correlate performance symptoms with routing or path changes. Kentik pairs flow analytics with automated “what changed?” triage so teams can quickly identify likely drivers and validate improvements after changes. See also: Cause Analysis.
What is synthetic monitoring and when do I need it for NPM?
Synthetic monitoring uses scheduled active tests (network probes plus DNS/HTTP/API and web transactions) to detect issues before users report them and to measure experience to SaaS and internet dependencies from relevant vantage points. It is especially valuable for catching SLA degradation early and validating outcomes after routing or provider changes. Kentik Synthetics supports global and private agents so teams can baseline experience, alert on degradations, and confirm fixes. See also: What Is Synthetic Monitoring?
How do I troubleshoot latency, packet loss, or jitter quickly?
A reliable workflow is to scope impact (who and what is affected), confirm symptoms with at least two signals (telemetry plus synthetics, or traffic plus telemetry), correlate the onset with changes (path, routing, saturation, errors, policy), and then validate the suspected driver by drilling into the affected paths and traffic slices. Kentik accelerates this with correlated telemetry and automated change triage that surfaces likely drivers fast. See also: Cause Analysis.
How can teams reduce alert noise in network performance monitoring?
Reduce noise by alerting on impact and baselines rather than raw thresholds, using maintenance windows and suppression for known change events, correlating related symptoms, and confirming user-facing issues with synthetics before escalating. Kentik supports higher-signal alerting by pairing NMS telemetry with runbook-driven investigations and AI-assisted triage so teams spend less time chasing low-value alarms. See also: Kentik AI.
How can AI help NetOps teams troubleshoot faster with NPM?
AI can speed NPM by converting alerts into guided investigations, summarizing likely scope and drivers, recommending next queries, and making workflows repeatable through runbooks and custom environment context. Kentik AI Advisor is designed to ground investigations in your telemetry while being guided by runbooks and custom network context, so investigations follow the same playbook across every shift for consistent operations. See also: AI Advisor.
How does NPM help with cost control and capacity planning?
Modern NPM links performance and utilization to financial outcomes by showing which paths, providers, regions, customers, or services drive spend and congestion risk. This improves forecasting and traffic engineering decisions. Kentik supports this with cost intelligence workflows like Traffic Costs that estimate and analyze the cost of specific traffic slices so teams can optimize transit mix and plan capacity with real data. See also: Traffic Costs.
Monitor and optimize network performance with Kentik
Kentik is the network intelligence platform that gives NetOps and SRE teams correlated visibility across device health, traffic flows, routing context, cloud environments, and synthetic tests — so you can move from alert to root cause in minutes, not hours.
- Get a demo — See how Kentik accelerates network performance monitoring across hybrid and multi-cloud
- Network Performance Monitoring — End-to-end NPM with correlated flow, telemetry, and synthetic data
- Kentik NMS — Next-generation device monitoring with SNMP and streaming telemetry
- Synthetic Monitoring — Proactive testing from global and private vantage points
- Kentik AI Advisor — Investigate performance issues with natural language
- Best Network Monitoring Tools for 2026 — Compare NPM tools across categories


