What is NPMD?
In a sentence, NPMD, or network performance monitoring and diagnostics, is a proactive effort to collect network telemetry that will be useful in future troubleshooting efforts pertaining to both the end-to-end performance and security of a network.
This short definition, however, is entirely too vague because it doesn’t include details on the types of telemetry collected, how it is evolving, the types of devices sending the data, or the processes that have matured over the last decade. Not even a brief paragraph can fully explain how NPMD is improving the collective effort toward root cause identification. Read on to learn more…
It is well understood that an optimized network is critically important to digital business operations. The push to maintain a finely-tuned infrastructure is fed by a constant urge to stay competitive and grow the business. It has also accelerated the migration to the cloud and the adoption of container architectures which in turn has introduced blind spots into the traditional hop-by-hop visibility that network professionals have come to rely on.

The insights generated by NPMD have led to a recognition that there is a need to better align the goals of network operations with those of security operations. These mutual interests include:
- The objective of guaranteeing a well-performing and secure network.
- Providing the required level of visibility in hybrid and multi-cloud environments.
- Responding to the network as a threat vector for potential security breaches or attacks.
Monitoring Anything and Everything Involving the Network
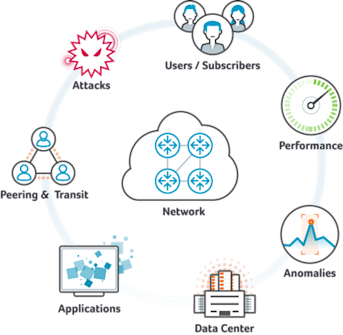
Whether it is a router, switch, or network device, it will likely be monitored the first time it transmits a packet onto the network. It doesn’t matter if the environment is a LAN/WAN, software-defined networking (SDN), or network function virtualization (NFV) component.
One of the goals is to monitor, measure, diagnose and generate alerts for any IP address in the aforementioned environment. This includes internet of things (IoT), cloud-hosted services (e.g., containers), wireless endpoints, and servers/VMs. To gain insight into these devices, they must send messages on their health to a collection point.
About Kentik: Kentik is a network intelligence and observability platform used by modern infrastructure teams to monitor, understand, and operate complex hybrid networks. By combining telemetry such as flow data, routing context, performance tests, and network monitoring metrics, Kentik helps teams pinpoint root cause faster and make better decisions about performance, cost, and security.
Learn how AI-powered insights help you predict issues, optimize performance, reduce costs, and enhance security.

NPMD Ingests Numerous Data Formats & Transmission Methods
Devices connected to the network send data in multiple formats. Most of these transmissions are standards-based or in a syntax common enough to be considered a standard such as NetFlow, IPFIX, sFlow, SNMP, Syslog, event logs, and packet capture. More recently, the JSON format has been used when sending network performance and security telemetry.
DNS data exfiltration is another transmission technique that can be used for both the malicious and legitimate transmission of information. There are many others, and more methods are sure to become available. Data sources ingested by NPMD solutions may include many different types of events, device metrics, streaming telemetry and contextual information. In this short video, Kentik CEO Avi Freedman discusses the many types of data and integrations that are important to improving network observability.
This video is a brief excerpt from “5 Problems Your Current Network Monitoring Can’t Solve (That Network Observability Can)” — you can watch the entire presentation here.
Network Troubleshooting and Root Cause Identification
Finding the root cause of network problems has been the goal of just about every network troubleshooting tool or platform released over the last 30 years. Although the information from these systems helps form a greater context around a specific problem, in most cases, only the technician can unearth the exact source of the problem.
Seldom will network monitoring by itself tell us exactly the who, what, when, where and why of an issue and even more rarely, the order of events that lead up to the problem. NPMD however, hopes to make strides here as well. NPMD platforms intend to aid the troubleshooter by guiding them with diagnostic workflows. The interfaces supporting this initiative serve up the forensic data needed to more methodically guide the NetOps team, for example, to an ultimate grasp of how exactly the performance degradation was introduced.
To further aid in this effort, artificial intelligence for IT operations (“AIOps”) functionality can be used to provide insight into the quality of the end-user experience or to help surface problems that might not get noticed by the ops team. It’s basically more context. By studying the same network-derived performance telemetry outlined above, some vendors are delivering AI-driven insights. The ultimate root cause of most issues, however, will likely continue to be derived by the human.
NPMD vs. DEM: A Clear Division?
Just as its name implies, NPMD tools have the ability to monitor, diagnose and generate alerts for dynamic end-to-end network service delivery. An adjacent technology, DEM or digital experience monitoring, focuses more on the end-user. Although NPMD and DEM share a similar goal—improving performance—one focuses more on how the network is dealing with connections and the other on how the end-user is experiencing the connections. There is certainly a division albeit a bit blurry at times. Consider a few differentiators:
-
Path: NPMD is aware of the network path from one AS (Autonomous System) to another, or router to router to any destination taken. DEM might issue traceroutes from an end system that returns the hop-by-hop route taken to a very specific destination.
-
Availability: NPMD might ping all devices on a network to ensure they are up and running and supporting all possible paths whereas DEM focuses largely on the availability of selected applications.
-
Latency and Jitter: In the past, NPMD predecessors delivered latency information (e.g., Cisco IPSLA, Medianet, etc.) but for the most part, the market hasn’t found tremendous value here. DEM, on the other hand, provides more accurate latency metrics closer to the source (i.e., the application itself) and tends to be more representative of the end-user experience. Synthetic testing can be used to provide network latency, jitter, and packet loss information that complements DEM functionality as it pertains to network performance.
-
Holistic: NPMD is engineered to ingest data from nearly everything from any device and gives accurate general information about all devices on the network. DEM was developed to share very detailed performance information only from the end systems taking measurements and only on selected applications.
How NPMD is Evolving
Where there are challenges, there are opportunities. The NPMD space is no different. As just one example, the evolution to cloud computing and cloud (and hybrid-cloud) networking has brought new challenges in observing, monitoring, and diagnosing new types of network infrastructure—where some or all of an organization’s network capabilities and resources are hosted in a public or private cloud platform.
In response to the increasing complexity of today’s networks and the sheer volume of data collected, some vendors have begun incorporating artificial intelligence/machine learning (AI/ML) analytics. Although the logic involved in anomaly detection, event correlation, and root cause analysis (RCA) has had to change, some vendors are seeing an improvement in event detection through the use of AI/ML technologies.
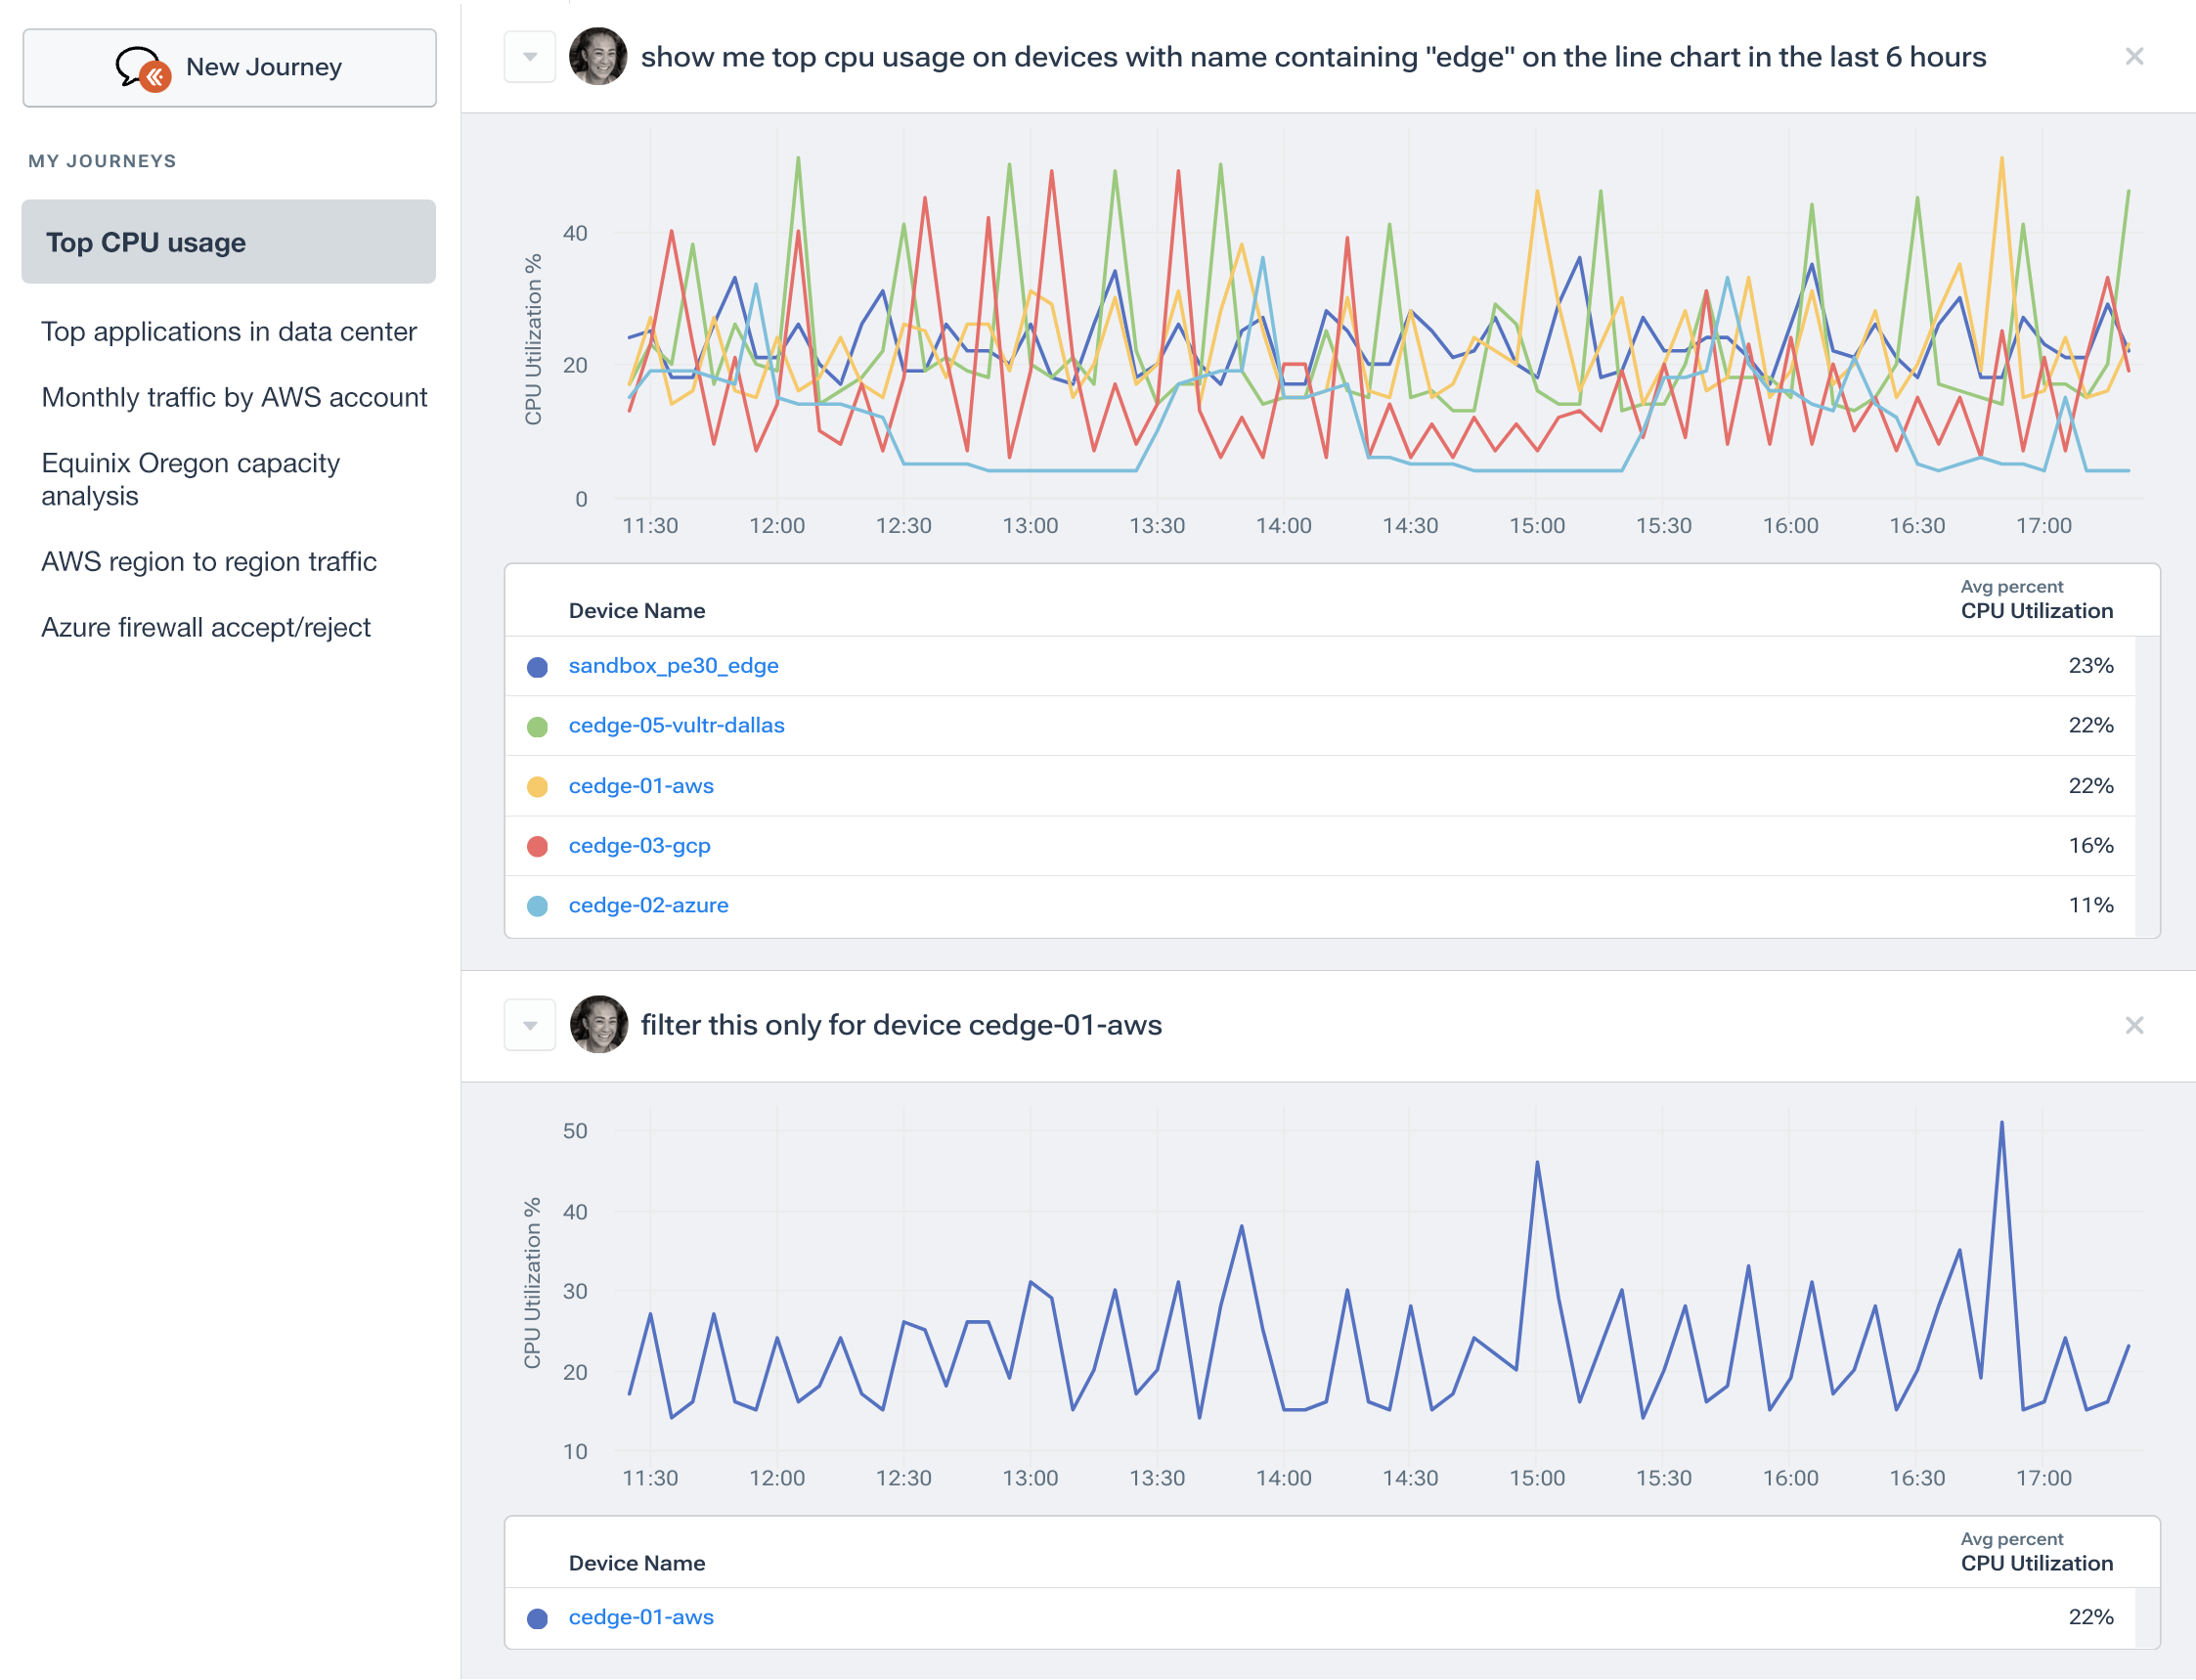
Recent advances in generative AI have already been incorporated into modern NPMD solutions such as Kentik NMS. Kentik AI allows NetOps professionals and non-experts alike to ask questions—and immediately get answers—about the current status or historical performance of their networks using natural language queries. This tool allow administrators to understand on-premises, hybrid, and multicloud networking environments from a single query engine. Because it combines network data from all sorts of protocols—including flow data, SNMP, streaming telemetry, containers, and cloud flow logs—Kentik AI enables unprecedented visibility into modern networks.

Other trends focus on using NPMD to optimize the customer experience. Some NPMD vendors are listening and providing views that are more service- and application-focused. Other vendors are incorporating DEM capabilities in the form of synthetic transaction monitoring (STM) and path awareness into their NPMD platforms.
Tools for Network Performance Monitoring in 2026
Network monitoring tools typically fall into four buckets: (1) network intelligence platforms that correlate traffic, routing, and cloud context, (2) traditional NPM/NMS tools focused on device and interface health, (3) full-stack observability platforms with network modules, and (4) digital experience monitoring (DEM) tools that measure internet and SaaS experience from the user’s perspective.
Below is a practical shortlist that reflects how teams build modern monitoring stacks.
-
Kentik
Kentik is a network intelligence and observability platform built for hybrid and multi-cloud monitoring, combining flow telemetry with routing context and proactive testing to speed troubleshooting and improve performance and cost decisions. It’s especially strong where teams need correlated flow plus routing analytics, multi-cloud visibility, and AI-assisted troubleshooting at high scale.
Best for: enterprises and providers who need network-first visibility across cloud, internet, and WAN, not just device polling. -
SolarWinds Network Performance Monitor (NPM)
SolarWinds NPM is a widely used traditional network performance monitoring platform centered on device, interface, and alerting workflows in many enterprise IT environments.
Best for: teams with established on-prem monitoring programs that want a classic NPM approach and deep device-centric dashboards. -
LogicMonitor
LogicMonitor is a SaaS monitoring platform with broad coverage across infrastructure and network gear, emphasizing fast deployment and platform-scale visibility.
Best for: organizations that want rapid onboarding and consolidated infrastructure plus network monitoring in a single SaaS platform. -
Datadog Network Monitoring
Datadog’s network monitoring capabilities combine cloud network visibility and network device monitoring, with correlation across apps, infrastructure, and network signals.
Best for: teams already standardized on Datadog who want network visibility tightly integrated with metrics, logs, traces, and alerting. -
Dynatrace
Dynatrace is a full-stack observability platform with AI-assisted insights and broad coverage across dynamic environments, with network visibility as part of the whole.
Best for: enterprises prioritizing a unified observability platform spanning applications and infrastructure, with network monitoring as one layer of end-to-end analysis. -
Cisco ThousandEyes
ThousandEyes is a digital experience monitoring (DEM) platform focused on measuring SaaS, internet, and user-journey experience using synthetic and endpoint perspectives, with strong internet-path visibility.
Best for: outside-in monitoring of SaaS and internet dependencies, especially where user experience and global vantage points are primary. -
PRTG Network Monitor (Paessler)
PRTG is an all-in-one network monitoring tool known for broad protocol coverage and an on-prem deployment model with customizable sensors and dashboards.
Best for: small-to-mid environments that want an easy-to-deploy, general-purpose NMS/NPM style tool. -
Open-source options: Zabbix and Nagios Core
Zabbix and Nagios are popular open-source monitoring systems that can be extended with templates and plugins and customized to fit many environments.
Best for: teams who want maximum control and low licensing cost, and who have the time to build and maintain monitoring content and workflows.
About Kentik’s NPMD Solution
Kentik offers a suite of advanced network monitoring and diagnostics solutions designed for today’s complex, multicloud network environments. The Kentik Network Intelligence Platform empowers network pros to monitor, run and troubleshoot all of their networks, from on-premises to the cloud. Kentik’s network monitoring solution addresses all three pillars of modern network monitoring, delivering visibility into network flow, powerful synthetic testing capabilities, and Kentik NMS, the next-generation network performance monitoring system.
To see how Kentik can bring the benefits of network intelligence to your organization, request a demo or sign up for a free trial today.
Kentik’s comprehensive NPMD solution delivers:
- Deep Internet Insights: Enables visibility into the performance, uptime, and connectivity of widely-used SaaS applications, clouds, and services.
- Intelligent Automation: Offers valuable insights without overwhelming users with unnecessary alerts.
- Comprehensive Data Understanding: Integrates SNMP, streaming telemetry, traffic flows, VPC logs, host agents, and synthetic monitoring for a holistic view of network performance.
- Multi-cloud Performance Monitoring: Monitors network traffic performance across hybrid and multi-cloud environments.
- Rapid Troubleshooting: Kentik’s network map visualizations enable swift issue isolation and resolution.
- Proactive Quality of Experience Monitoring: Optimizes application performance and detects potential issues in advance.
- Enhanced Collaboration Features: Promotes seamless coordination across network, cloud, and security teams through robust integrations.
- Advanced AI Features: Kentik AI allows NetOps professionals and non-experts alike to ask questions—and immediately get answers—about the current status or historical performance of their networks using natural language queries.


