Latency and Packet Loss Monitoring Within the Cloud

Summary
Maximize your network’s performance with a reliable packet loss monitor. Learn how to proactively identify lost data packets and latency within the cloud.
NetOps teams have quickly learned the benefits of hosting applications in the cloud. But before they migrated or adopted a few SaaS applications, they knew in the back of their minds that monitoring performance would be difficult. A tiny voice was asking, “How will we monitor packet loss and connection latency, hop-by-hop, when using cloud applications?”
What is Packet Loss?
Packet loss is a network performance issue that occurs when data packets fail to reach their intended destination. It can happen due to several reasons, such as network congestion, hardware failures, and overloaded devices.
When a packet is lost, the receiving device sends a request for retransmission. The time taken for the sender to detect a lost packet and retransmit it is called the retransmission timeout (RTO). Packet loss is measured by calculating the percentage of packets that fail to reach their destination, which is known as the packet loss rate.
Examples of Packet Loss
Most of us have experienced packet loss, like choppy video in a conference call. Or standing in line at the bank or a department store and when the clerk says, “The system is really slow today.”
Routers and Switches Bottlenecking
Routers and switches are an integral part of a network infrastructure, allowing data packets to be efficiently transmitted across the network. However, when the number of data packets being transmitted exceeds the capacity of the router or switch, it can cause network congestion and lead to packet loss. This is known as “bottlenecking”, and it can occur when the network infrastructure is unable to handle the volume of network traffic. Routers and switches can be overwhelmed due to outdated hardware, misconfigured settings, or a lack of bandwidth.
Packet Loss Resulting in Choppy Video Conferences
Video conferencing is a vital tool for remote collaboration and communication in modern workplaces. However, packet loss can lead to a poor video conferencing experience, with choppy or pixelated video, lagging audio, and delays in communication. This can be caused by a variety of factors, such as network congestion, slow internet connections, or outdated hardware. Regular monitoring of network performance can help to identify and prevent packet loss in video conferencing.
Packet Loss Causes Problems with Cloud Applications
It isn’t so much that packet loss itself is a huge problem — TCP and QUIC were engineered in anticipation that lost packets would be inevitable. If there is a problem, it rests primarily in two areas:
- Lost data: Older technologies (syslogs, SNMP traps, NetFlow, RTP, etc.) that run over UDP with no acknowledgement that the messages sent arrived at the destination. When using these technologies, we hope the data makes it.
- Latency: Missing packets in connection-oriented protocols such as TCP and QUIC result in lost packets getting resent. These packet retransmits introduce latency.
What Causes Packet Loss?
Packet loss can occur due to various factors, such as network congestion, bad network hardware, overwhelmed devices, mismatched duplexing, expired TTL, poor connectors, incorrect firewall configuration, and network security threats.
Network Congestion
Network congestion occurs when there is a high volume of network traffic, and the network infrastructure is unable to handle it. This can lead to packet loss as data packets get dropped due to limited network bandwidth. Network monitoring and management tools can be used to identify and manage network congestion, and network administrators can take proactive steps to optimize network performance and bandwidth allocation.
Bad Network Hardware
Bad network hardware, such as faulty network devices or poor network connectivity, can also cause packet loss. This can be due to damaged cables, misconfigured devices, or outdated hardware that cannot handle the volume of network traffic. Regular maintenance and upgrades of network hardware can help to prevent packet loss caused by bad network hardware.
Overwhelmed Devices
Overwhelmed devices, such as routers, switches, and firewalls, can also lead to packet loss when they are unable to process the volume of network traffic. This can result in delays in packet transmission and increased packet loss. Increasing network bandwidth or upgrading to more powerful devices can help to prevent overwhelmed devices.
Mismatched Duplexing
Mismatched duplexing occurs when network devices are set to different duplex modes, such as half-duplex or full-duplex, resulting in packet loss. Network administrators can use ping tests to identify mismatched duplexing and reconfigure the devices accordingly to prevent packet loss.
Expired TTL
Expired time to live (TTL) values can also cause packet loss as routers drop packets with expired TTL values. This can happen when packets are routed for too long or when they are stuck in a routing loop. Regular maintenance and monitoring of network performance can help to prevent packet loss caused by expired TTL.
Poor Physical Connections
Poor connectors, such as poorly assembled cables or loosely plugged-in devices, can cause packet loss due to unstable network connections. Regular checks and maintenance of network connections can help to prevent packet loss caused by poor connectors.
Incorrect Firewall Configuration
Incorrect firewall configurations that drop packets, such as all ICMP being dropped, can also lead to packet loss. Network administrators should regularly review and optimize their firewall configurations to prevent packet loss due to incorrect firewall settings.
Network Security Threats
Lastly, network security threats, such as DDoS attacks, can cause packet loss by overwhelming the network with malicious traffic or by causing network downtime. Implementing robust security measures and regularly monitoring network performance can help to prevent packet loss caused by network security threats.
Detecting Packet Loss
Trying to source the location that is causing the packet loss is not always a trivial practice. For example, what if the destination of the connection is somewhere in the cloud? How do you identify where the packets are getting dropped?
Here’s a list of utilities and techniques that many of us are still using today to detect and isolate network packet loss:
- Ping: Using ping on the command prompt to measure packet loss is generally done to verify connectivity of a host, but “request timed out” could indicate if there is any packet loss. You have to remember that ping rides on top of ICMP, and in a congested network it is one of the first protocols to get dropped by a busy router. For this reason, ICMP is not a reliable protocol, and more importantly, it doesn’t tell you where in the path the packets were dropped.
- SNMP: By polling all the SNMP devices on the network, packet loss details can be collected and a threshold can be set that notifies the NetOps team. Since we are focused on the cloud in this article, we find that SNMP is great for LANs and WANs, but we can’t use it to see inside devices within the cloud.
- Packet capture: By strategically locating one or more probes off of mirrored ports on the network, sessions can be monitored, but if the loss occurred in the cloud, we will have no idea where it occurred. In production networks, packet probes are great for deep troubleshooting, but they are expensive and simply can’t be located everywhere we need them.
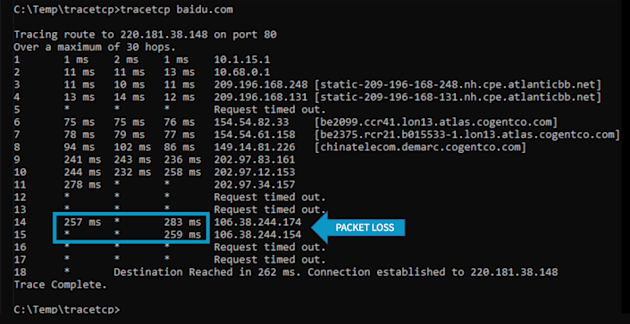
- TCP traceroute: A TCP trace reaches out to every router in the path to a target destination. The log generated by the trace reports on each router in the path as well as any corresponding packet loss.

After reviewing the above four ways to monitor for packet loss, you might think that TCP traceroute will solve the observability riddle, but there’s a problem. The cloud is made up of thousands of routers. This means we would need a massive global network of traceroute probes to help us test connections to the business applications we depend on.
Remember, with applications in the cloud, we need to test from all the different locations where we have employees and customers. Imagine the amount of deployment work to get them all set up — not to mention the ongoing maintenance!
How to Monitor Packet Loss and Latency in the Cloud
Kentik solved the deployment and maintenance conundrum by setting up a global network of agents used for synthetic testing — see the Kentik Global Synthetic Network. These lightweight devices are located all over the world, in every major virtual public cloud (VPC) and service provider. These synthetic testing agents can be configured in the Kentik Network Observability Cloud to monitor any business application such as Salesforce, Office365 and more.
— Jeremy Schulman with Major League Baseball
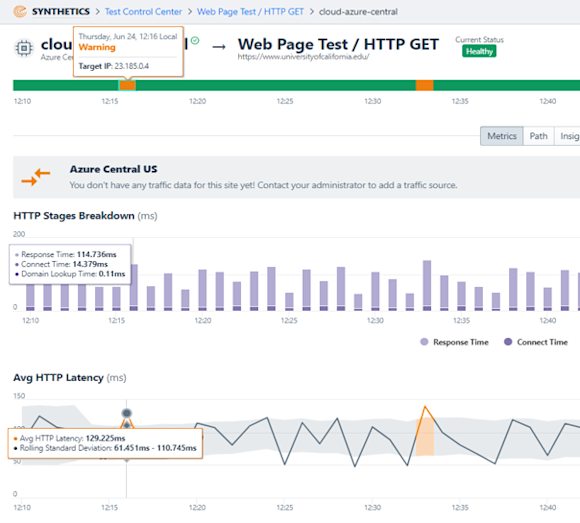
Performing a TCP traceroute to IP addresses and host names is just the beginning. Kentik Synthetics can be used to verify availability of specific content in web pages, test DNS servers to make sure they are responding in a timely manner, monitor the availability and responsiveness of API endpoints, and much more. These tests are performed in an automatic and periodic way, with testing intervals as low as the sub-minute range.
Establishing Baselines and Setting Thresholds for Packet Loss and Latency
When the tests are all configured, you can trend the data collected and set thresholds at levels where you know the business will be impacted.

With the Kentik Network Observability Cloud, you gain the benefits of being able to baseline the performance of applications, websites and networks. You can hold vendors accountable when you know darn well that they are introducing 80% of the delay, which is annoying your customers and could be forcing them to abandon their online checkout. Doing nothing is costing your company money.
If the service provider doesn’t fix a packet loss or latency problem, you can find new transit and then verify that your new path is avoiding that troublesome network. To learn more, read “How to Monitor Traffic Through Transit Gateways.”
If you want to be proactive, you can deploy or make use of Kentik Synthetics agents in a remote geographic location and then run tests to see if a remote location like Inuvik, Canada can support an application at the necessary service levels.
If you’d like to learn more about our network monitoring solution or how to monitor packet loss, request a demo or start a free trial of Kentik.


