Summary
In this post, we offer insight into how to monitor traffic through transit gateways by understanding routing dynamics and cloud architecture. Learn more.
Cloud traffic is expanding in every direction: east-west, north-south, inter-regions, across-clouds, to the edge, sites, and more. This is a direct reflection of business strategy and explosive growth in workloads and third-party services accessed by multiple user, consumer, and device types. The end result is complex and often brittle networking environments, and cloud professionals are left in the dark.
What is a Transit Gateway?
A Transit Gateway (TGW) is an AWS routing construct that you can think of as a cloud router. It is meant to scale the management of VPC connectivity in AWS cloud and to on-premises.
For AWS cloud networks, the Transit Gateway provides a way to route traffic to and from VPCs, AWS regions, VPNs, Direct Connect, SD-WANs, etc. However, AWS offers no easy way to gain visibility into traffic that crosses these devices — unless you know how to monitor Transit Gateways.
Without knowing who, what, where, and how, network and cloud engineers have no good way to plan, troubleshoot, or migrate cloud networks. In this post, we’ll offer insight into how to monitor your traffic through Transit Gateways by understanding routing and traffic dynamics through every hop on the end-to-end path.
For a high-level overview of AWS Transit Gateway, see our Kentipedia article, “AWS Transit Gateway: Everything You Need to Know”.
Building Transit Gateways to Interconnect VPCs
Applications often need connectivity between workloads in different VPCs and regions as well as to and from on-premises environments (e.g., data centers, offices, branches, etc.). Cloud migrations, microservices architectures, third-party services, and business growth, among other factors, are causing an increase in the number of VPCs deployed — and increasing the need for cloud network visibility. From the naive initial thought of one VPC per organization, we now see organizations deploying hundreds and thousands of these virtual networks.
Networking in public clouds can be done via different constructs: gateways, endpoints, direct connections, VPNs, VPC peerings, subnet routing tables, etc. Each construct addresses specific networking capabilities, security, capacity, and performance requirements. (Check out The Network Pro’s Guide to the Public Cloud ebook for a quick tutorial on AWS cloud networking.)
There’s a typical pattern in cloud environments: developers usually start with a one-to-one tactical approach to connect workloads in their applications, peering one VPC with another, for instance. See diagram 1 below:

When the number of individual connections creates operation and governance challenges, network engineers often shift their organizations into more scalable designs using the Transit Gateways in a hub-and-spoke architecture. See diagram 2 below:
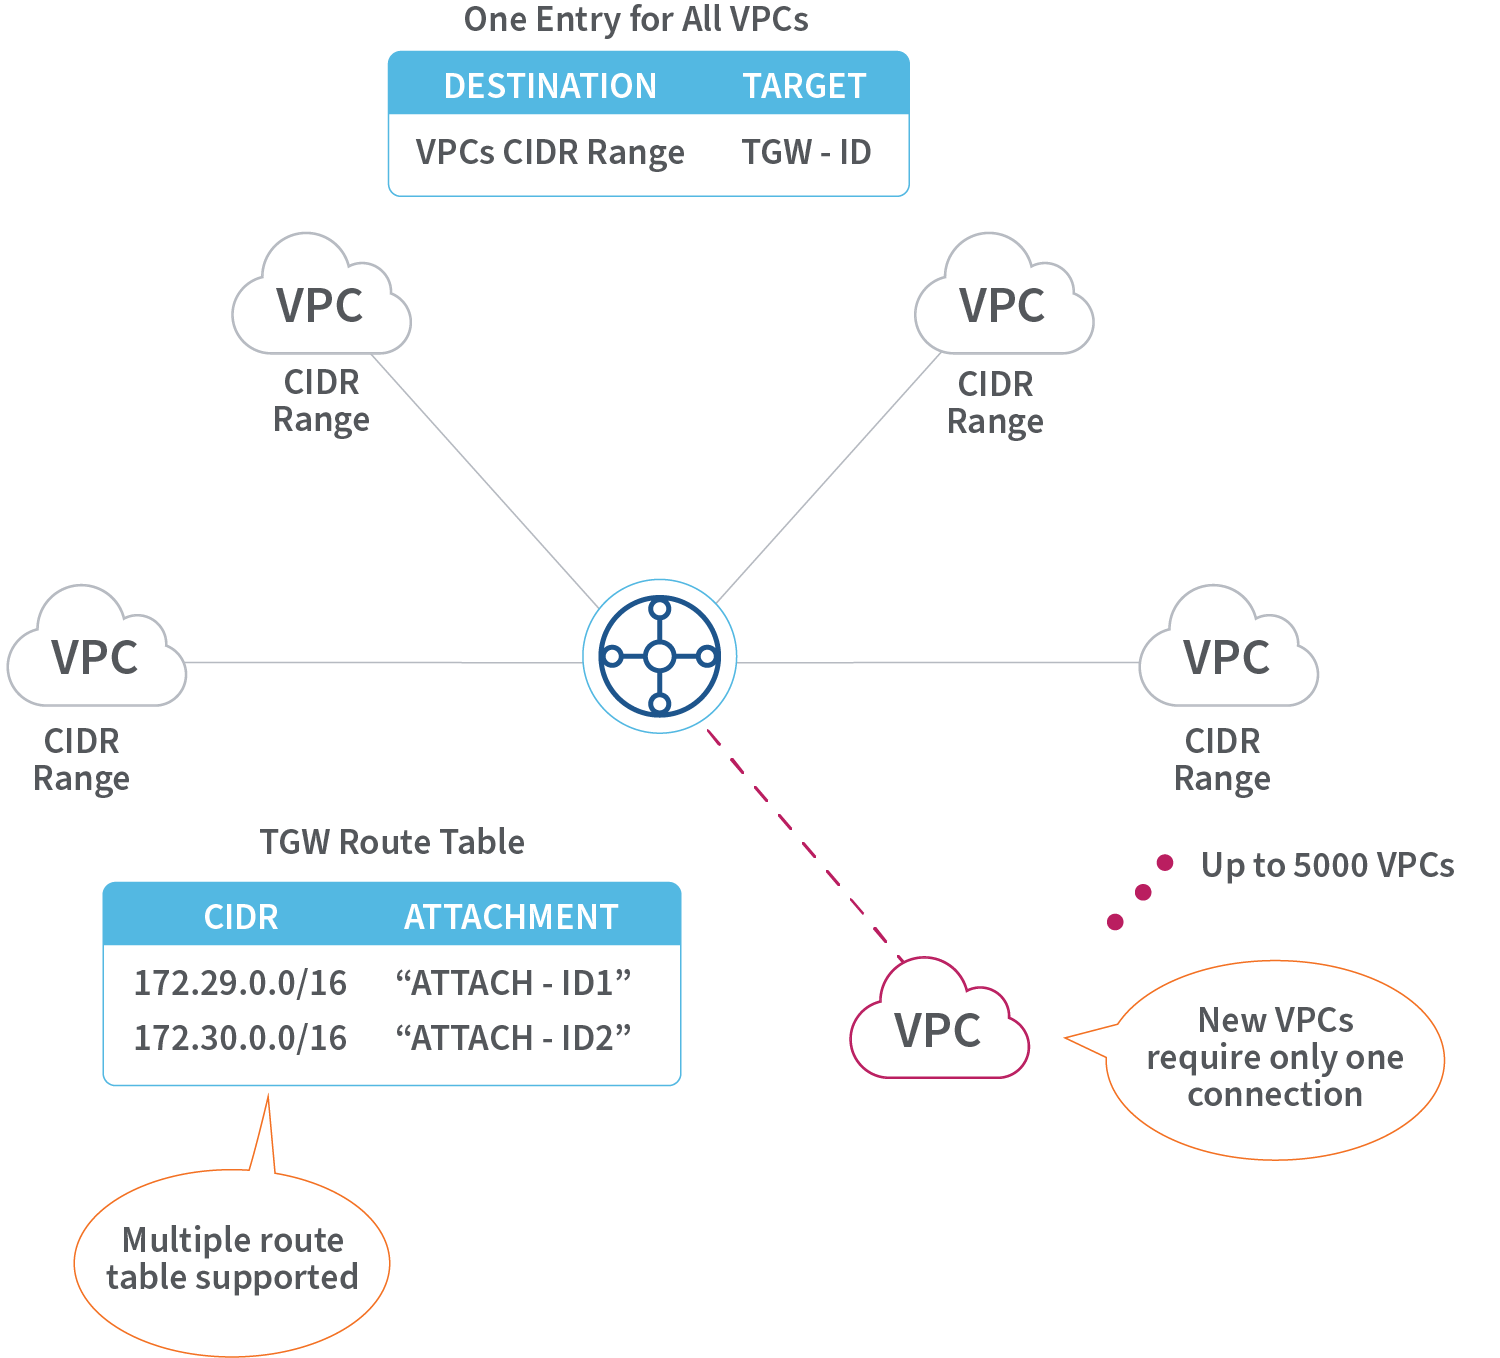
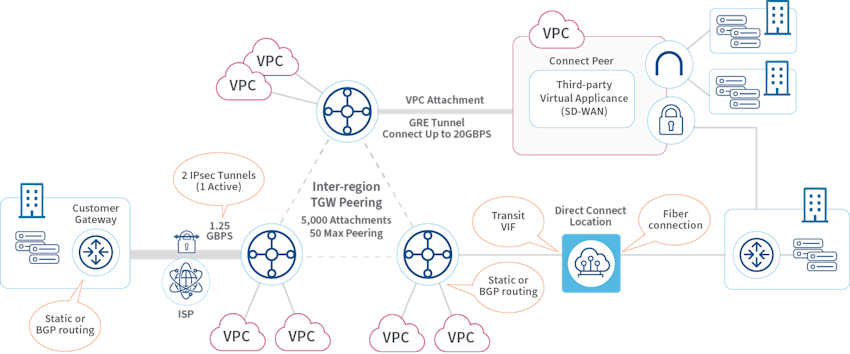
Transit Gateways are critical for scalable VPC interconnectivity. Transit Gateways are also fundamental for global cloud and hybrid networking. They address the growth in intra- and inter-region connectivity, as well as to/from on-premises infrastructures. Transit Gateways function as cloud routers and enable among other use cases:
- Transit Gateway peerings
- Interconnection of multiple VPCs in an any-to-any hub-and-spoke design
- Centralized inter-VPC networking
- Static and dynamic (BGP) routing for VPN and Direct Connect attachments
- Entry point for on-premises SD-WAN connections
See diagram 3 below:
How Transit Gateways Affect Network Visibility
However, moving from ad hoc, one-to-one peering connections to a planned and optimized architecture with Transit Gateways cannot be achieved without visibility. After all, how can networkers know what applications require connectivity without the ability to see the traffic? And how will they know when they can deactivate the old peering connections?
Unfortunately, Transit Gateways are natively a black box in the cloud. Managing cloud networking using current tools such as CloudWatch or third-party SIEM solutions is not scalable, viable, or even effective. As a consequence, most organizations run in the dark — enduring high MTTR, costs, and risks.
Using Cloud Monitoring Tools to Troubleshoot Issues with Transit Gateways
As mentioned in the previous section, Transit Gateways are central constructs to cloud networking, and yet, no visibility on their traffic is provided. For instance, in a case when a client application that uses data from the cloud shows delays, some questions come up immediately:
- Is the network the cause or a contributing factor?
- How does the data leaving the ENI (of the EC2 instance) reach the application client?
- How is the traffic routed through a Transit Gateway on the way to the destination host? Does it take an additional hop through a peered Transit Gateway before being forwarded to a Direct Connect connection to the on-premises network?
- Does it go through a site-to-site VPN attached to the Transit Gateway?
- Was the traffic blackholed by a route being withdrawn from an adjacent device?
It is very difficult to answer these questions, or gain any insight on the traffic path using native-cloud monitoring, SIEM, or legacy network monitoring tools.
To operate in hybrid cloud networks or cloud environments with a growing number of VPC interconnections using siloed information, engineers have to collate data from multiple sources. They must search through various tables, browse different application UIs, and learn the local query language to search through storage buckets or data lakes — all while manually keeping mental track of what IP addresses correlate to VM instance names, VPC IDs, etc. This gets old fast — it’s hard to do quickly and certainly doesn’t scale.
Let’s step into the shoes of those trying to resolve issues using siloed data and views. For every analysis, network engineers and cloud professionals would need to:
- Get the VPC ID from the instance’s EC2 UI
- Get the Transit Gateway ID associated with that VPC ID by browsing the route tables in the VPC UI
- Now shifting to the Transit Gateway UI, browse to the same Transit Gateway ID, change to the Attachment UI, and find the Attachment ID associated with the VPC ID where your instance is deployed
- Find the Transit Gateway route table associated with the Attachment ID (associated with the source VPC)
- Lookup for the attachments associated with the destination IP/CIDR. The attachments could be to another Transit Gateway (in this case, investigation continues) or to the final on-premises connections (e.g., Direct Connect, site-to-site VPN)
Now think of this tedious workflow, while considering that a given VPC can attach to up to 5 Transit Gateways, and each Transit Gateway supports 10’s of routing tables, 50 peering connections to other Transit Gateways, and 5000 VPC attachments. The scenario can turn into a connectivity myriad without any visibility into how the traffic is flowing through the cloud.
Facing this kind of workflow in complex environments, MTTR can easily rise, and hardly any effective proactive measures can be taken along the way to keep MTTR within objectives.
Gain Live Visibility into Transit Gateways and Network Monitoring with Kentik Cloud
A holistic visualization of the network environment is fundamental to understand it. With Kentik Cloud, all manual steps collapse into an intuitive live map with all data gathered, automatically processed, and catered to answer routine and investigative questions. Cloud architects and network engineers can interact directly on the map to view hop by hop, metrics, and details on traffic, routing, and metadata. Anyone can get answers about intra- and inter-clouds, on-premises networks, and the internet with a few clicks.
See below how easy it is to figure out what is going through your Transit Gateways:
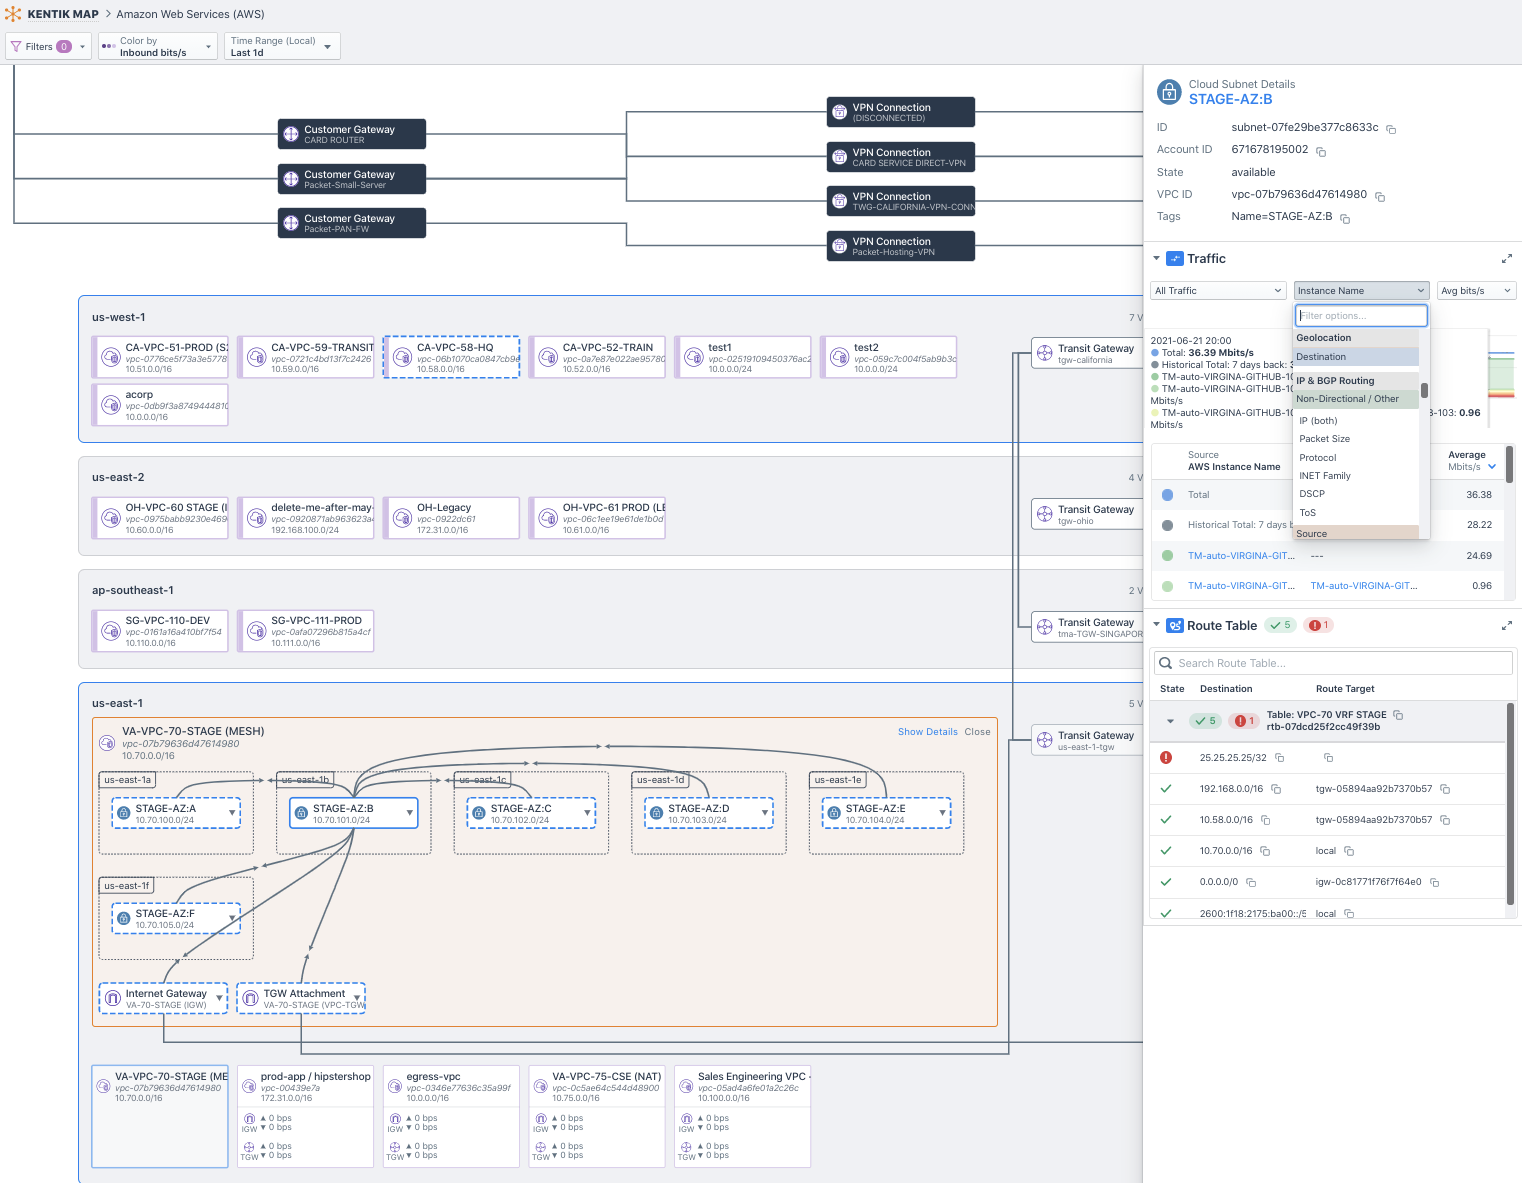
From a map UI, a selected VPC has all its traffic relationships displayed. Clicking on any element of the map will provide traffic data and context. You can dig into traffic using the Explorer view (on the right) and apply popular filters, such as top n, source/dest IP address, instance name, gateway type, etc.
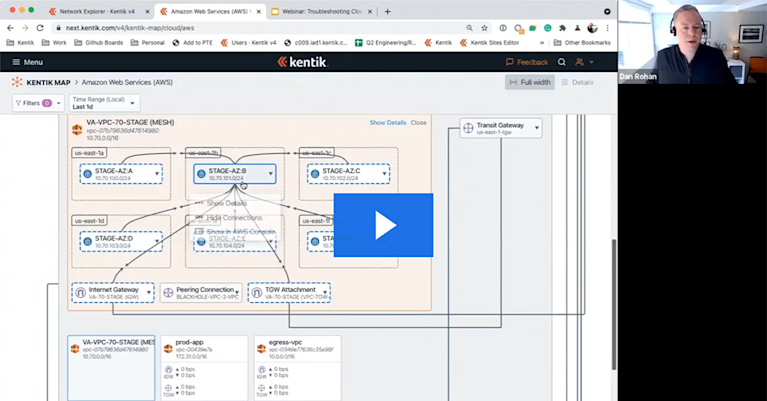
Don’t miss Dan Rohan’s Tech Talk on Transit Gateways for a short demo to experience how easy it is to visualize and troubleshoot hybrid cloud networks with Kentik.
How Kentik’s Network Observability Platform Can Answer Your Cloud Architecture Questions
Complex public and hybrid cloud networking environments cannot be understood in pieces, let alone troubleshooting when under pressure of growing business losses and users’ complaints. Holistic understanding is required, and that is what Kentik’s network observability delivers. What it means to network engineers, SREs, developers, and cloud professionals is that you can answer any network question at any time.
Question such as:
- What composes the traffic flows between VPCs and clouds?
- What are the paths and network constructs that the traffic flows through?
- Where are applications dependent on the network? And how are these traffic flows performing?
- How can my cloud networks be optimized for cost and security posture?
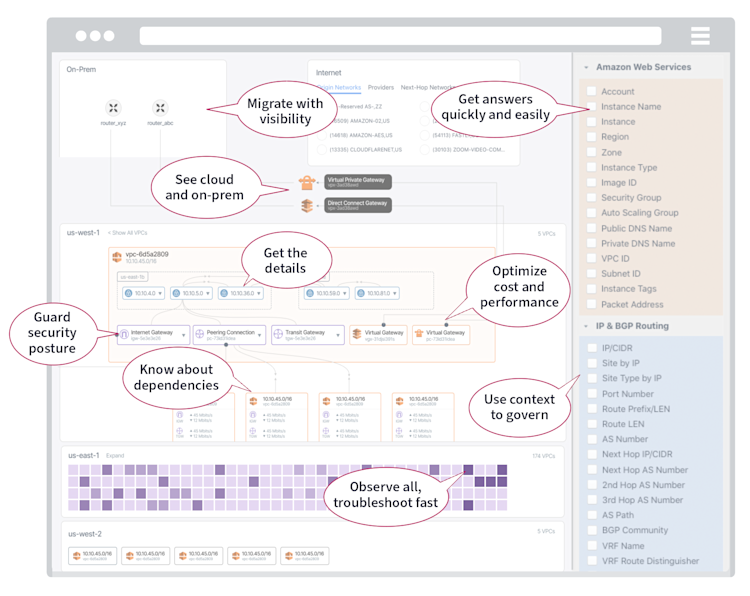
With Kentik, you can plan, run, and fix safe, scalable, and cost-effective hybrid cloud networks. Start a trial and experience how easy it is to manage cloud networks with Kentik Cloud. Or, schedule a demo with the network observability experts at Kentik.


