Summary
Facebook suffered a historic and nearly six-hour global outage on October 4. In this post, we look at Kentik’s view of the outage.
Yesterday the world’s largest social media platform suffered a global outage of all of its services for nearly six hours during which time, Facebook and its subsidiaries, including WhatsApp, Instagram and Oculus, were unavailable. With a claimed 3.5 billion users of its combined services, Facebook’s down-time of at least five and a half hours comes to more than 1.2 trillion person-minutes of service unavailability, a so-called “1.2 tera-lapse,” or the largest communications outage in history.
When we first heard about problems with Facebook, we checked Kentik’s OTT Service Tracker, which analyzes traffic by over-the-top (OTT) service. The visualization below shows the dropoff in the volume of traffic served up by each individual Facebook service beginning at roughly 15:39 UTC (or 11:39 AM ET).
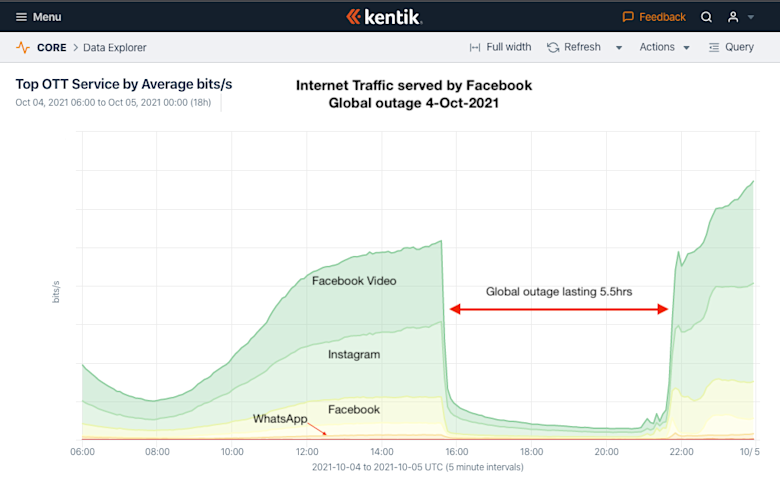
Facebook Video accounts for the largest amount of bits per second that the Facebook platform delivers, whereas its messaging app WhatsApp constitutes a much smaller volume of traffic.
So what happened? According to a statement published last night, Facebook Engineering wrote, “Configuration changes on the backbone routers that coordinate network traffic between our data centers caused issues that interrupted this communication.” The result of this misconfiguration was that Facebook inadvertently downed some of their links to the outside world, resulting in the withdrawal of dozens of the 300+ IPv4 and IPv6 prefixes they normally originate.
Included in the withdrawn prefixes were the IP addresses of Facebook’s authoritative DNS servers, rendering them unreachable. The result was that users worldwide were unable to resolve any domain belonging to Facebook, effectively rendering all of the social media giant’s various services completely unusable.
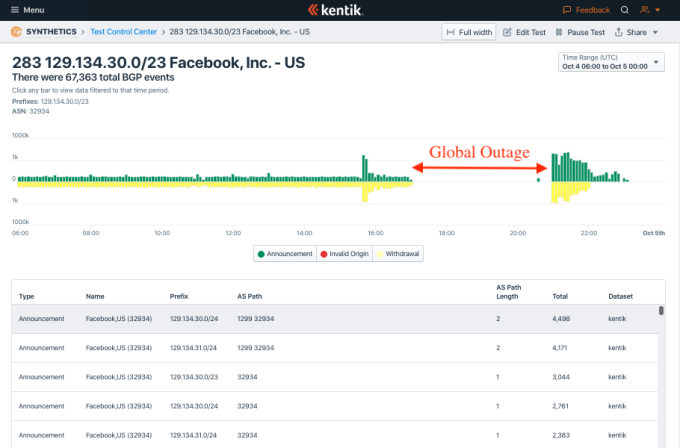
For example, in IPv4, Facebook authoritative server a.ns.facebook.com resolves to the address 129.134.30.12 which is routed as 129.134.30.0/24 and 129.134.30.0/23. The withdrawal of the latter prefix is shown below in Kentik’s BGP Monitor (part of Kentik Synthetics) beginning with a spike of activity at 15:39 UTC before returning at 21:00 UTC.
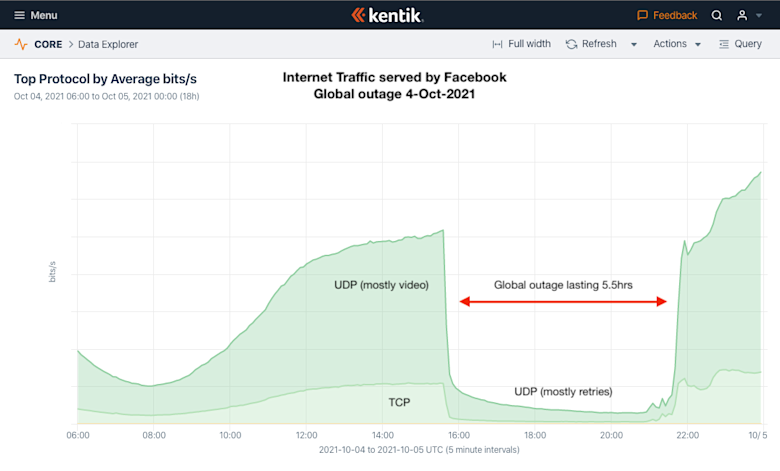
Below, Kentik’s versatile Data Explorer illustrates how traffic from Facebook’s platform changed over the course of the day when broken down by protocol. Before the outage, UDP delivering traffic-intensive video dominated the volume of traffic volume while TCP constituted a minority. During the outage, the TCP traffic went away entirely, leaving a small amount of UDP traffic consisting of DNS retries from Facebook’s 3.5 billion users attempting in vain to reconnect to their services.
In addition to our NetFlow analysis product that hundreds of our customers currently know and love, Kentik also offers an active network performance measurement product called Kentik Synthetics. Our global network of synthetic agents, located around the world, immediately alerted us that something had gone terribly wrong at Facebook.
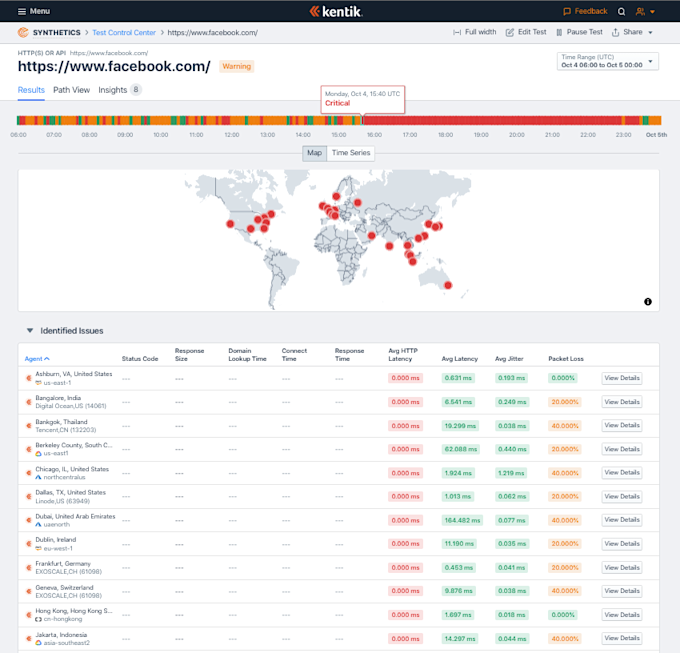
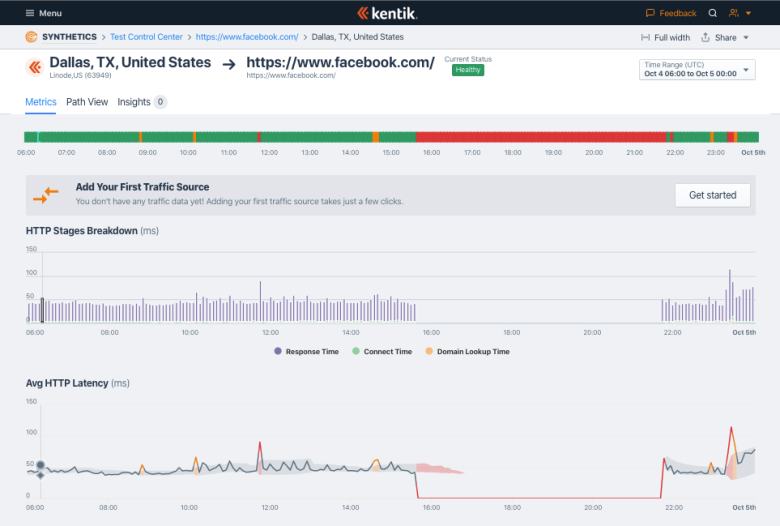
Here’s how the Facebook outage looked from the perspective of synthetic monitoring, which includes various timing metrics such as breakdowns of HTTP stages (domain lookup time, connect time, response time) and average HTTP latency, as shown below.
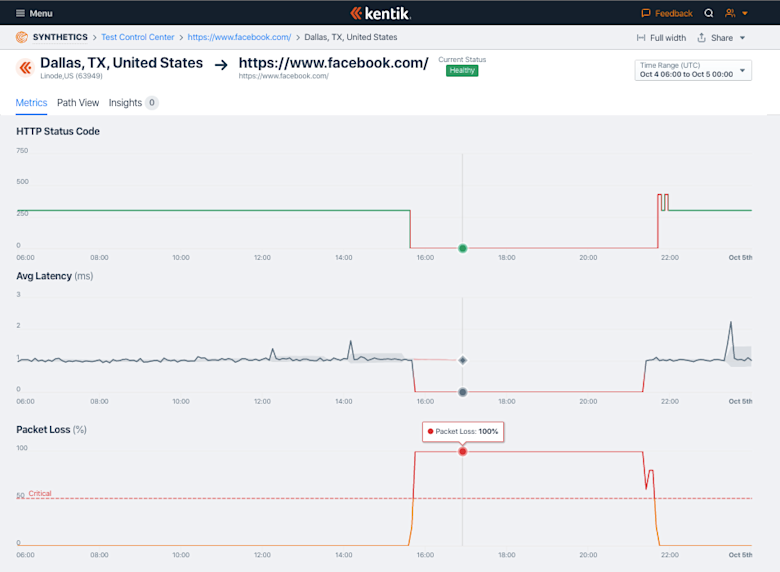
Kentik Synthetics can also report on HTTP status code, average latency, as well as packet loss. Given that yesterday’s outage was total, all of these metrics were in the red for the duration of the outage.
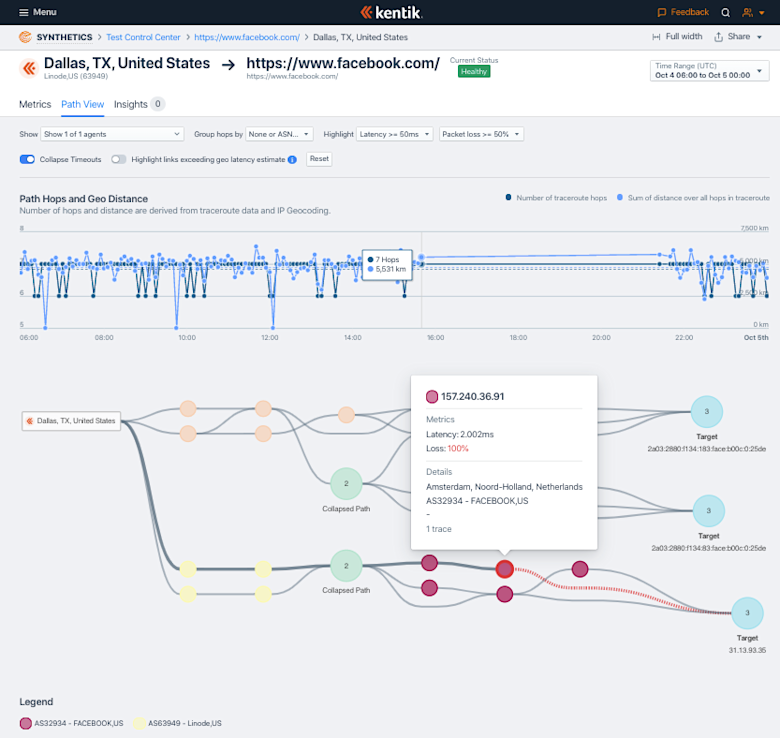
The “Path View” in Kentik Synthetics can run continuous traceroutes to a target internet resource. This helps us see how this manifests itself on the physical devices that carry traffic across the internet for users of Facebook. Shown below, this view enables hop-by-hop analysis to identify problems such as increased latency or packet loss. In the case of yesterday’s Facebook outage, the tests could no longer execute when Facebook.com stopped resolving, but it did briefly begin to report on packet loss before stopping.
Facebook-owned WhatsApp didn’t fare much better. Synthetic agents performing a continuous PageLoad test (where the entire webpage is loaded into a headless Chromium browser instance running on the agents to measure things like domain lookup time, SSL connection time and DOM processing time) to https://www.whatsapp.com started failing completely, shortly after 15:40 UTC.
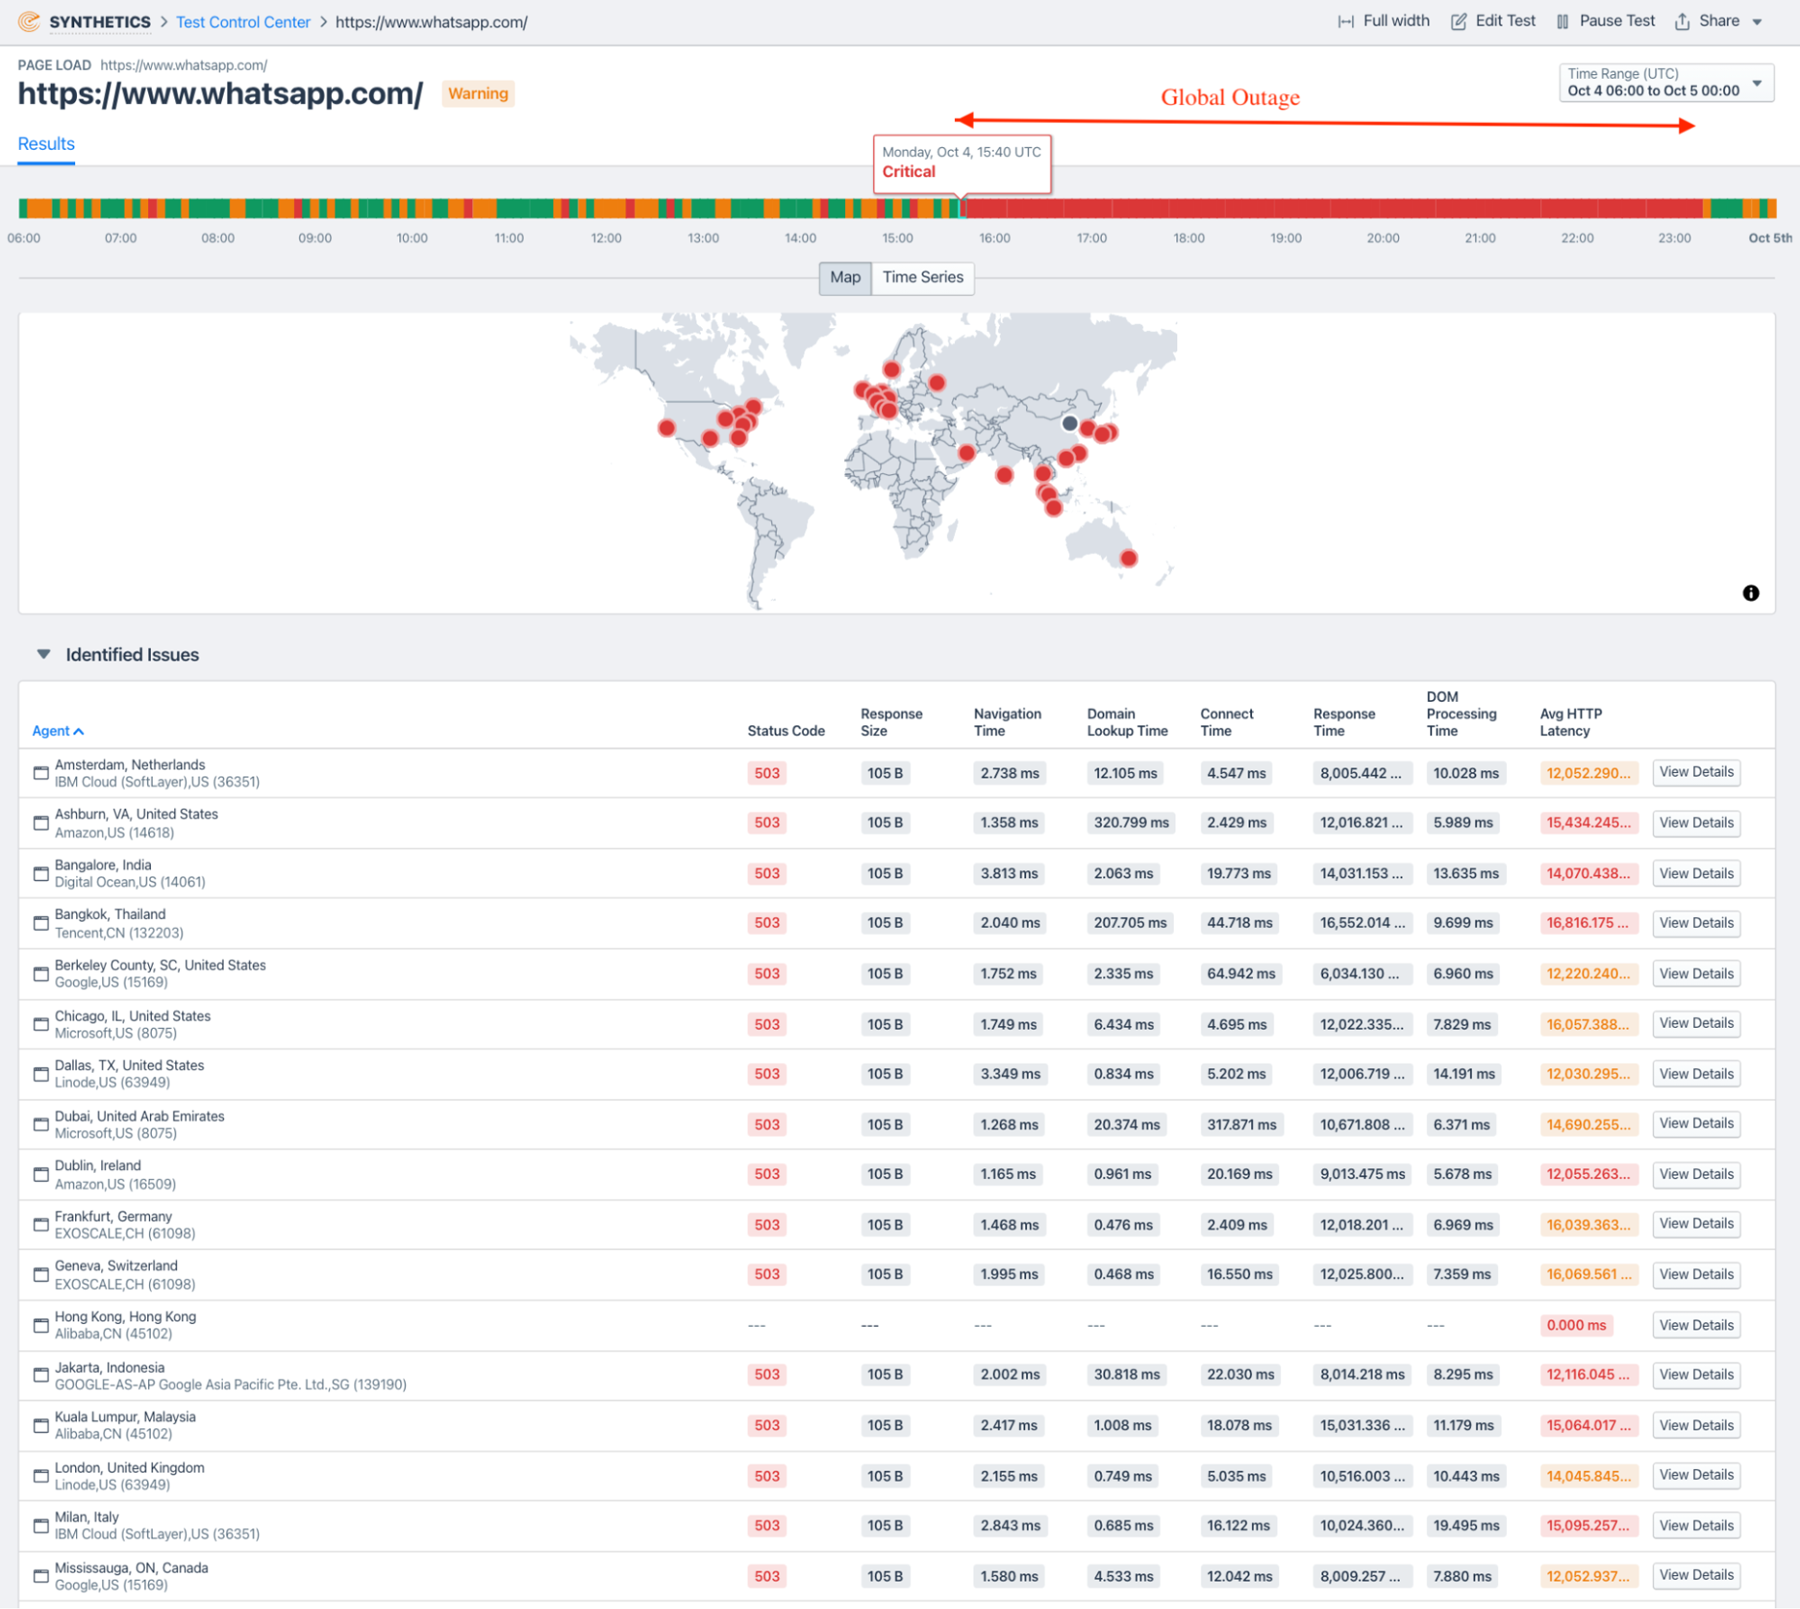
Notice how nearly all the agents stopped seeing results for any of the metrics within a few minutes.

A similar path analysis using continuous traceroutes for WhatsApp appears below. Before the outage, all the Kentik Synthetics agents are able to complete traceroutes (our agents run three every minute and increment TTL values to build this visualization) to WhatsApp servers. You can also see one of the devices with the hostname po101.psw01.sin6.tfbnw.net located in AS32934 (that belongs to Facebook) is dropping no packets (0% packet loss).
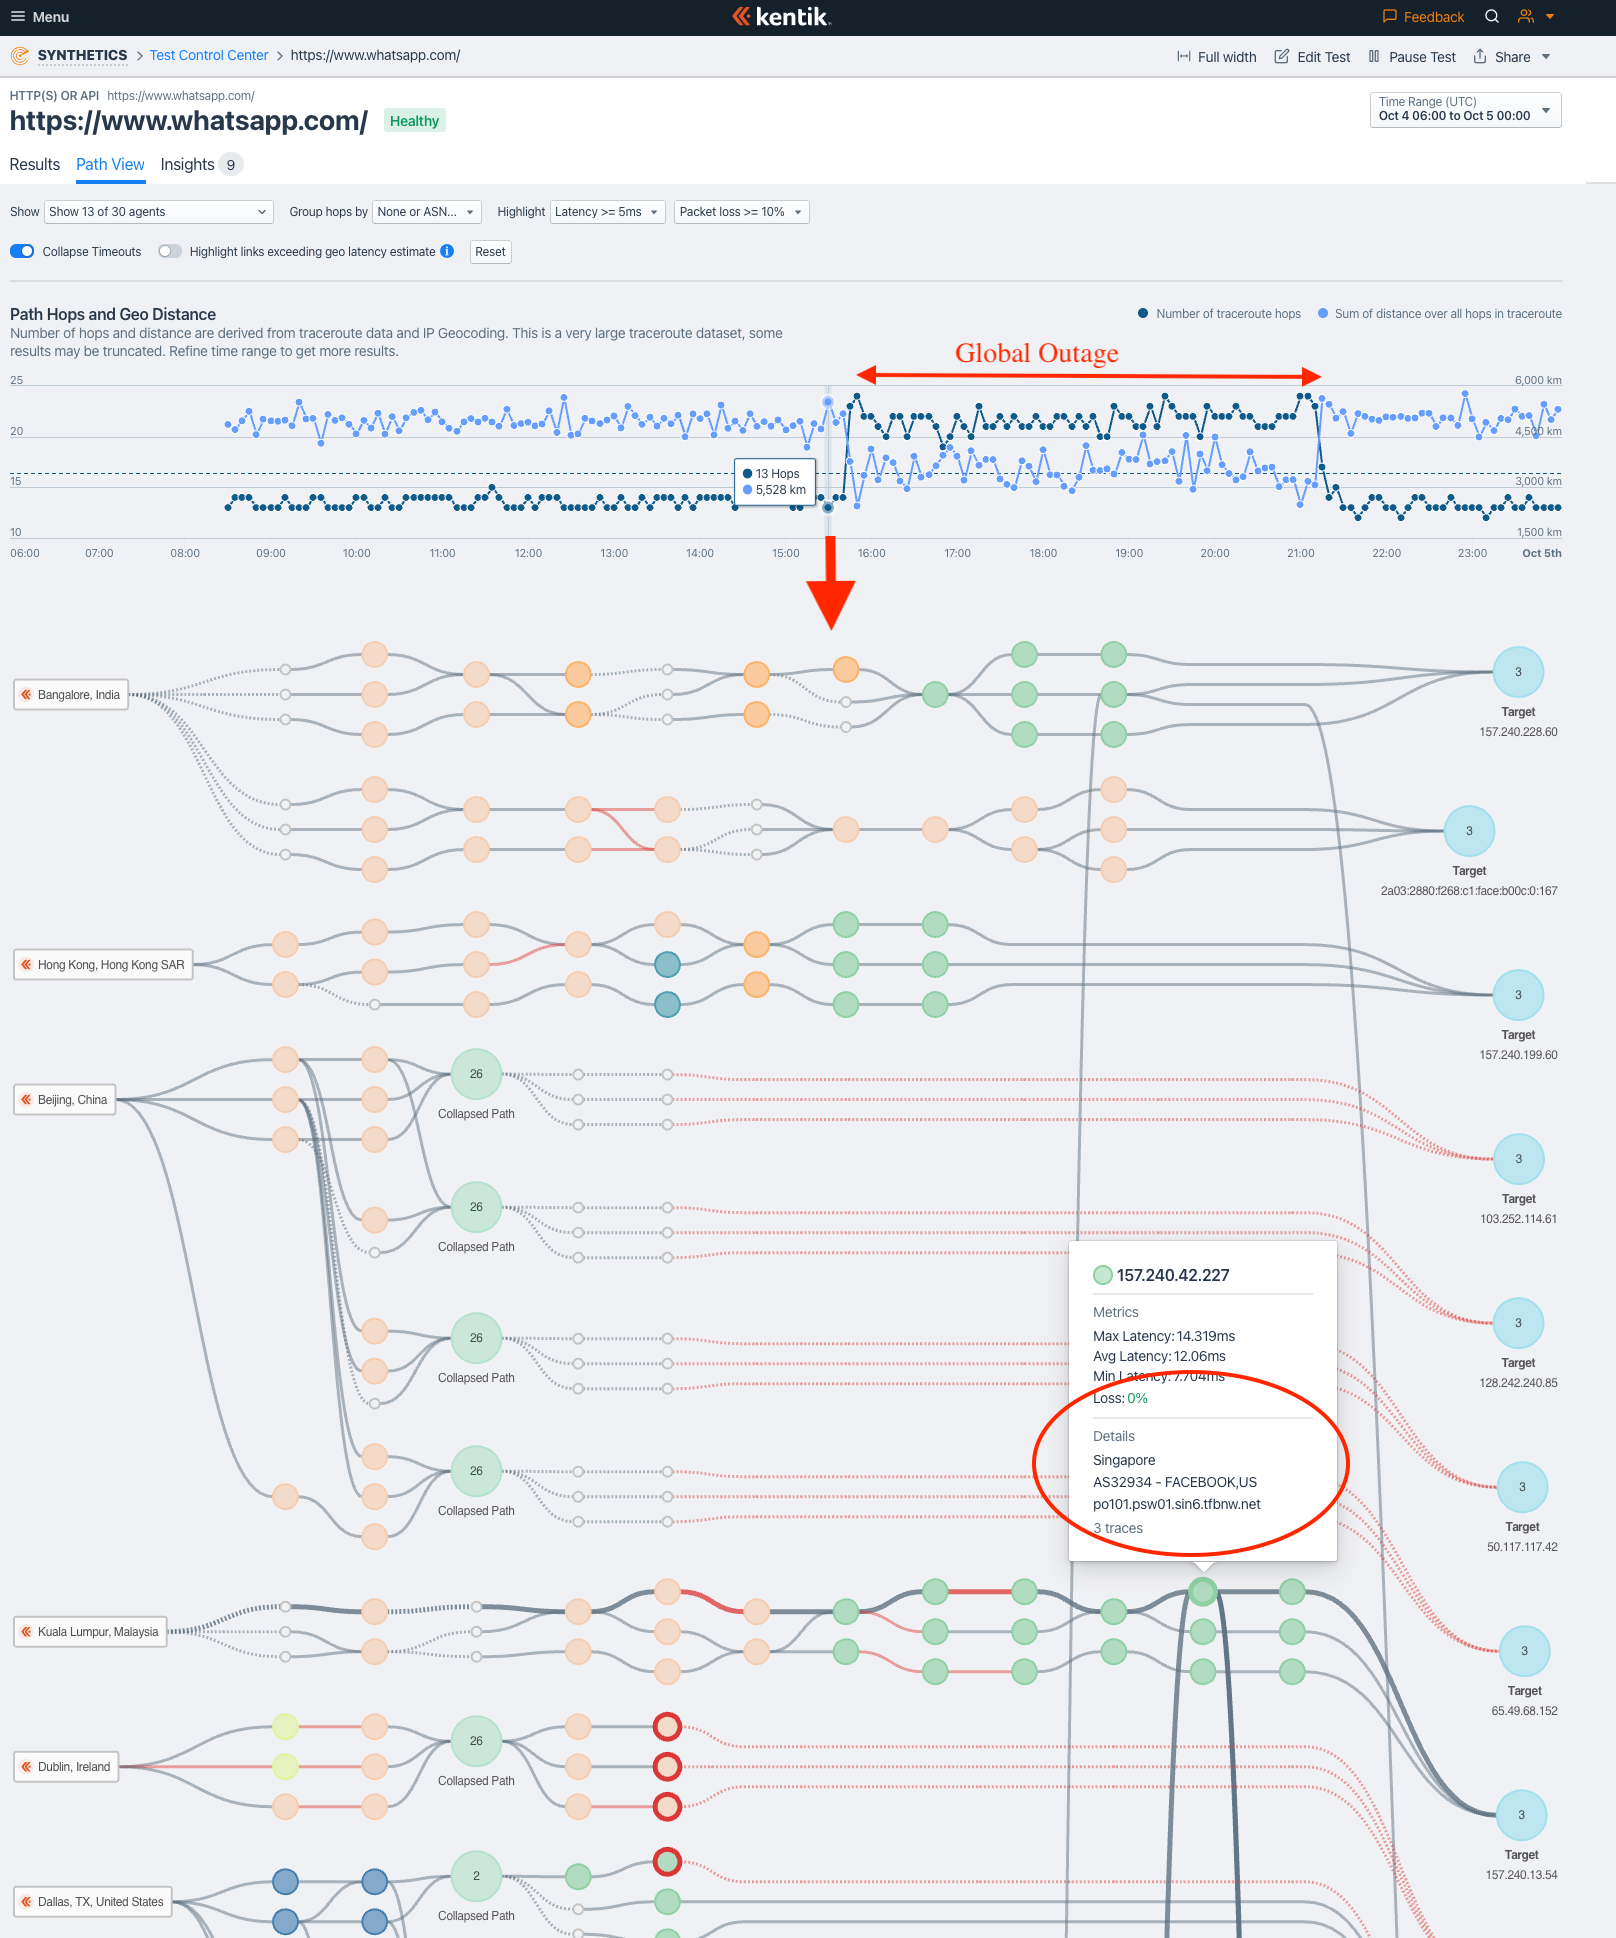
Now let’s look at the same traceroute visualization in the thick of the outage. Notice that all global agents that are part of this synthetic test are unable to complete traceroutes to WhatsApp servers except one in San Francisco and one in Ashburn. And even for those agents, the San Francisco one is losing about half the packets ( 50% packet loss) when it hit the device po105.psw02.lax3.tfbnw.net — which is another router inside AS32934 that belongs to Facebook.

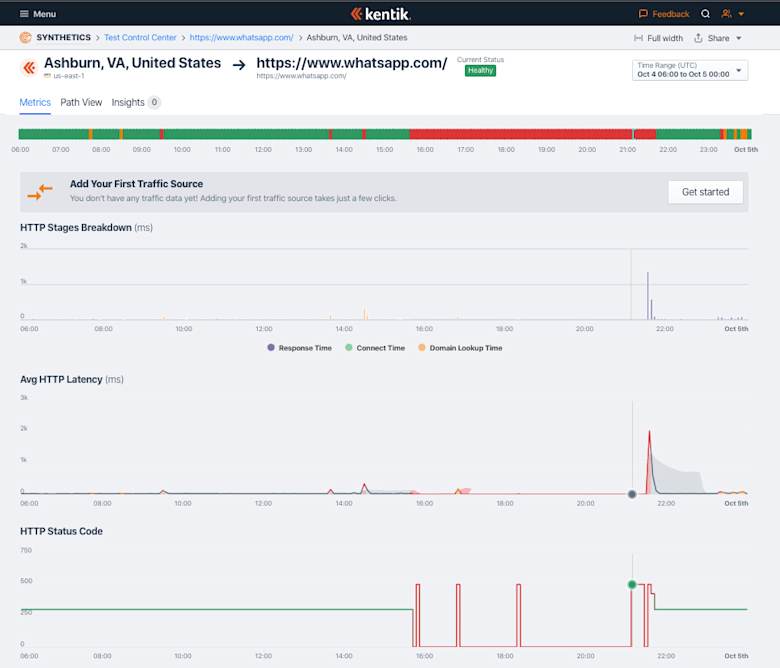
One difference in the graphic below is the surge in latency as Facebook was returning its service online. At that moment in time, upwards of a billion users were likely trying to reconnect to WhatsApp at the same time, causing congestion leading to dramatically higher latencies.
What now?
Facebook’s historic outage showed that network events can have a huge impact on the services and digital experience of users. It’s more important than ever to make your network observable so that you can see and respond to network failures immediately.
Yes, getting alerts from your monitoring systems help, but the challenge then becomes determining and resolving the cause of the problem.
That’s where network observability comes in. Being able to gather telemetry data from all of your networks, the ones you own and the ones you don’t, is critical.
Kentik provides a cloud-based network observability platform that enables you to identify and resolve issues quickly. That’s why market leaders like Zoom, Dropbox, Box, IBM and hundreds more across the globe rely on Kentik for network observability. See for yourself.


