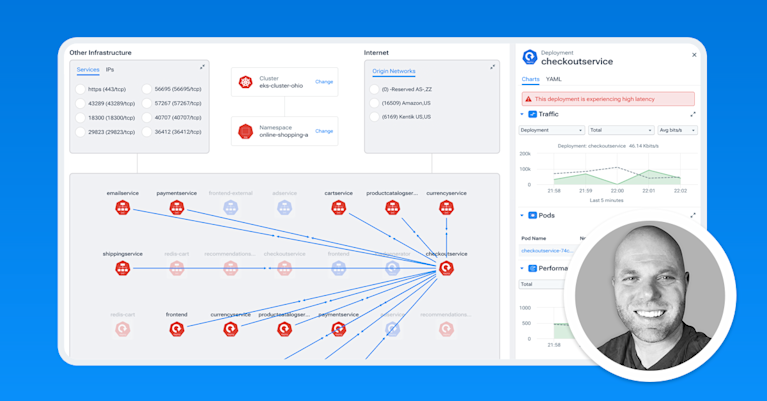
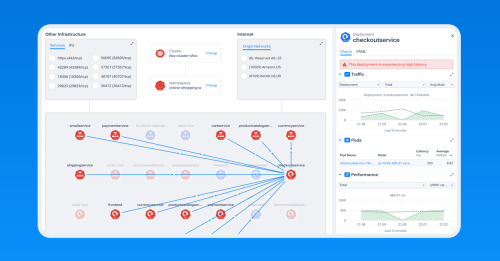
Now Kubernetes deployments are observable
Kentik Kube enables network and infrastructure professionals to gain full visibility of network traffic within the context of their Kubernetes deployments in the cloud and on-prem.
When using Kubernetes in hybrid cloud environments, even the most experienced teams struggle to strike a balance between maintaining reliability and optimizing infrastructure costs. Change is constant: new workloads are migrated and deployed to Kubernetes, teams expand, technologies evolve, and cloud environments grow. In the meantime, teams must fix stubborn performance issues and improve cost margins. Costly architectural decisions and network misconfigurations are difficult to spot with application-centric monitoring tools. Most teams lack the Kubernetes network observability and expertise needed to solve quickly.

How Kentik Kube works
Kentik Kube relies on data generated from a lightweight eBPF agent installed on your Kubernetes cluster. It sends data back to the Kentik SaaS platform, allowing you to query, graph, and alert on conditions in your data. This data, coupled with the analytics engine, enables users to gain complete visibility and context into Kubernetes traffic routing and performance. We built Kentik Kube to provide visibility for cloud-managed Kubernetes clusters (AKS, EKS, and GKS) and on-prem, self-managed clusters using the most widely implemented network models.
Use Kentik Kube to:
Ensure Kubernetes performance: Discover which services and pods are experiencing network delays in order to troubleshoot and fix problems faster. Configure alert policies to proactively find high latency nodes, pods, workloads, or services.
Optimize costs: Quickly detect traffic changes tied to new deployments or misconfigurations before egress, inter-region transfer, and gateway charges get out of control.
Get total infrastructure visibility: Know which pods were deployed on which nodes — even historically. See which pods and services are communicating with other clusters, non-Kubernetes infrastructure, or the internet. Quickly detect top talkers. Identify Kubernetes clusters sending traffic to embargoed countries or unapproved external destinations.
Determine top talkers: Identify clients/requesters consuming your Kubernetes services so you can track down problematic connections. Know exactly who was talking to which pod, and when.
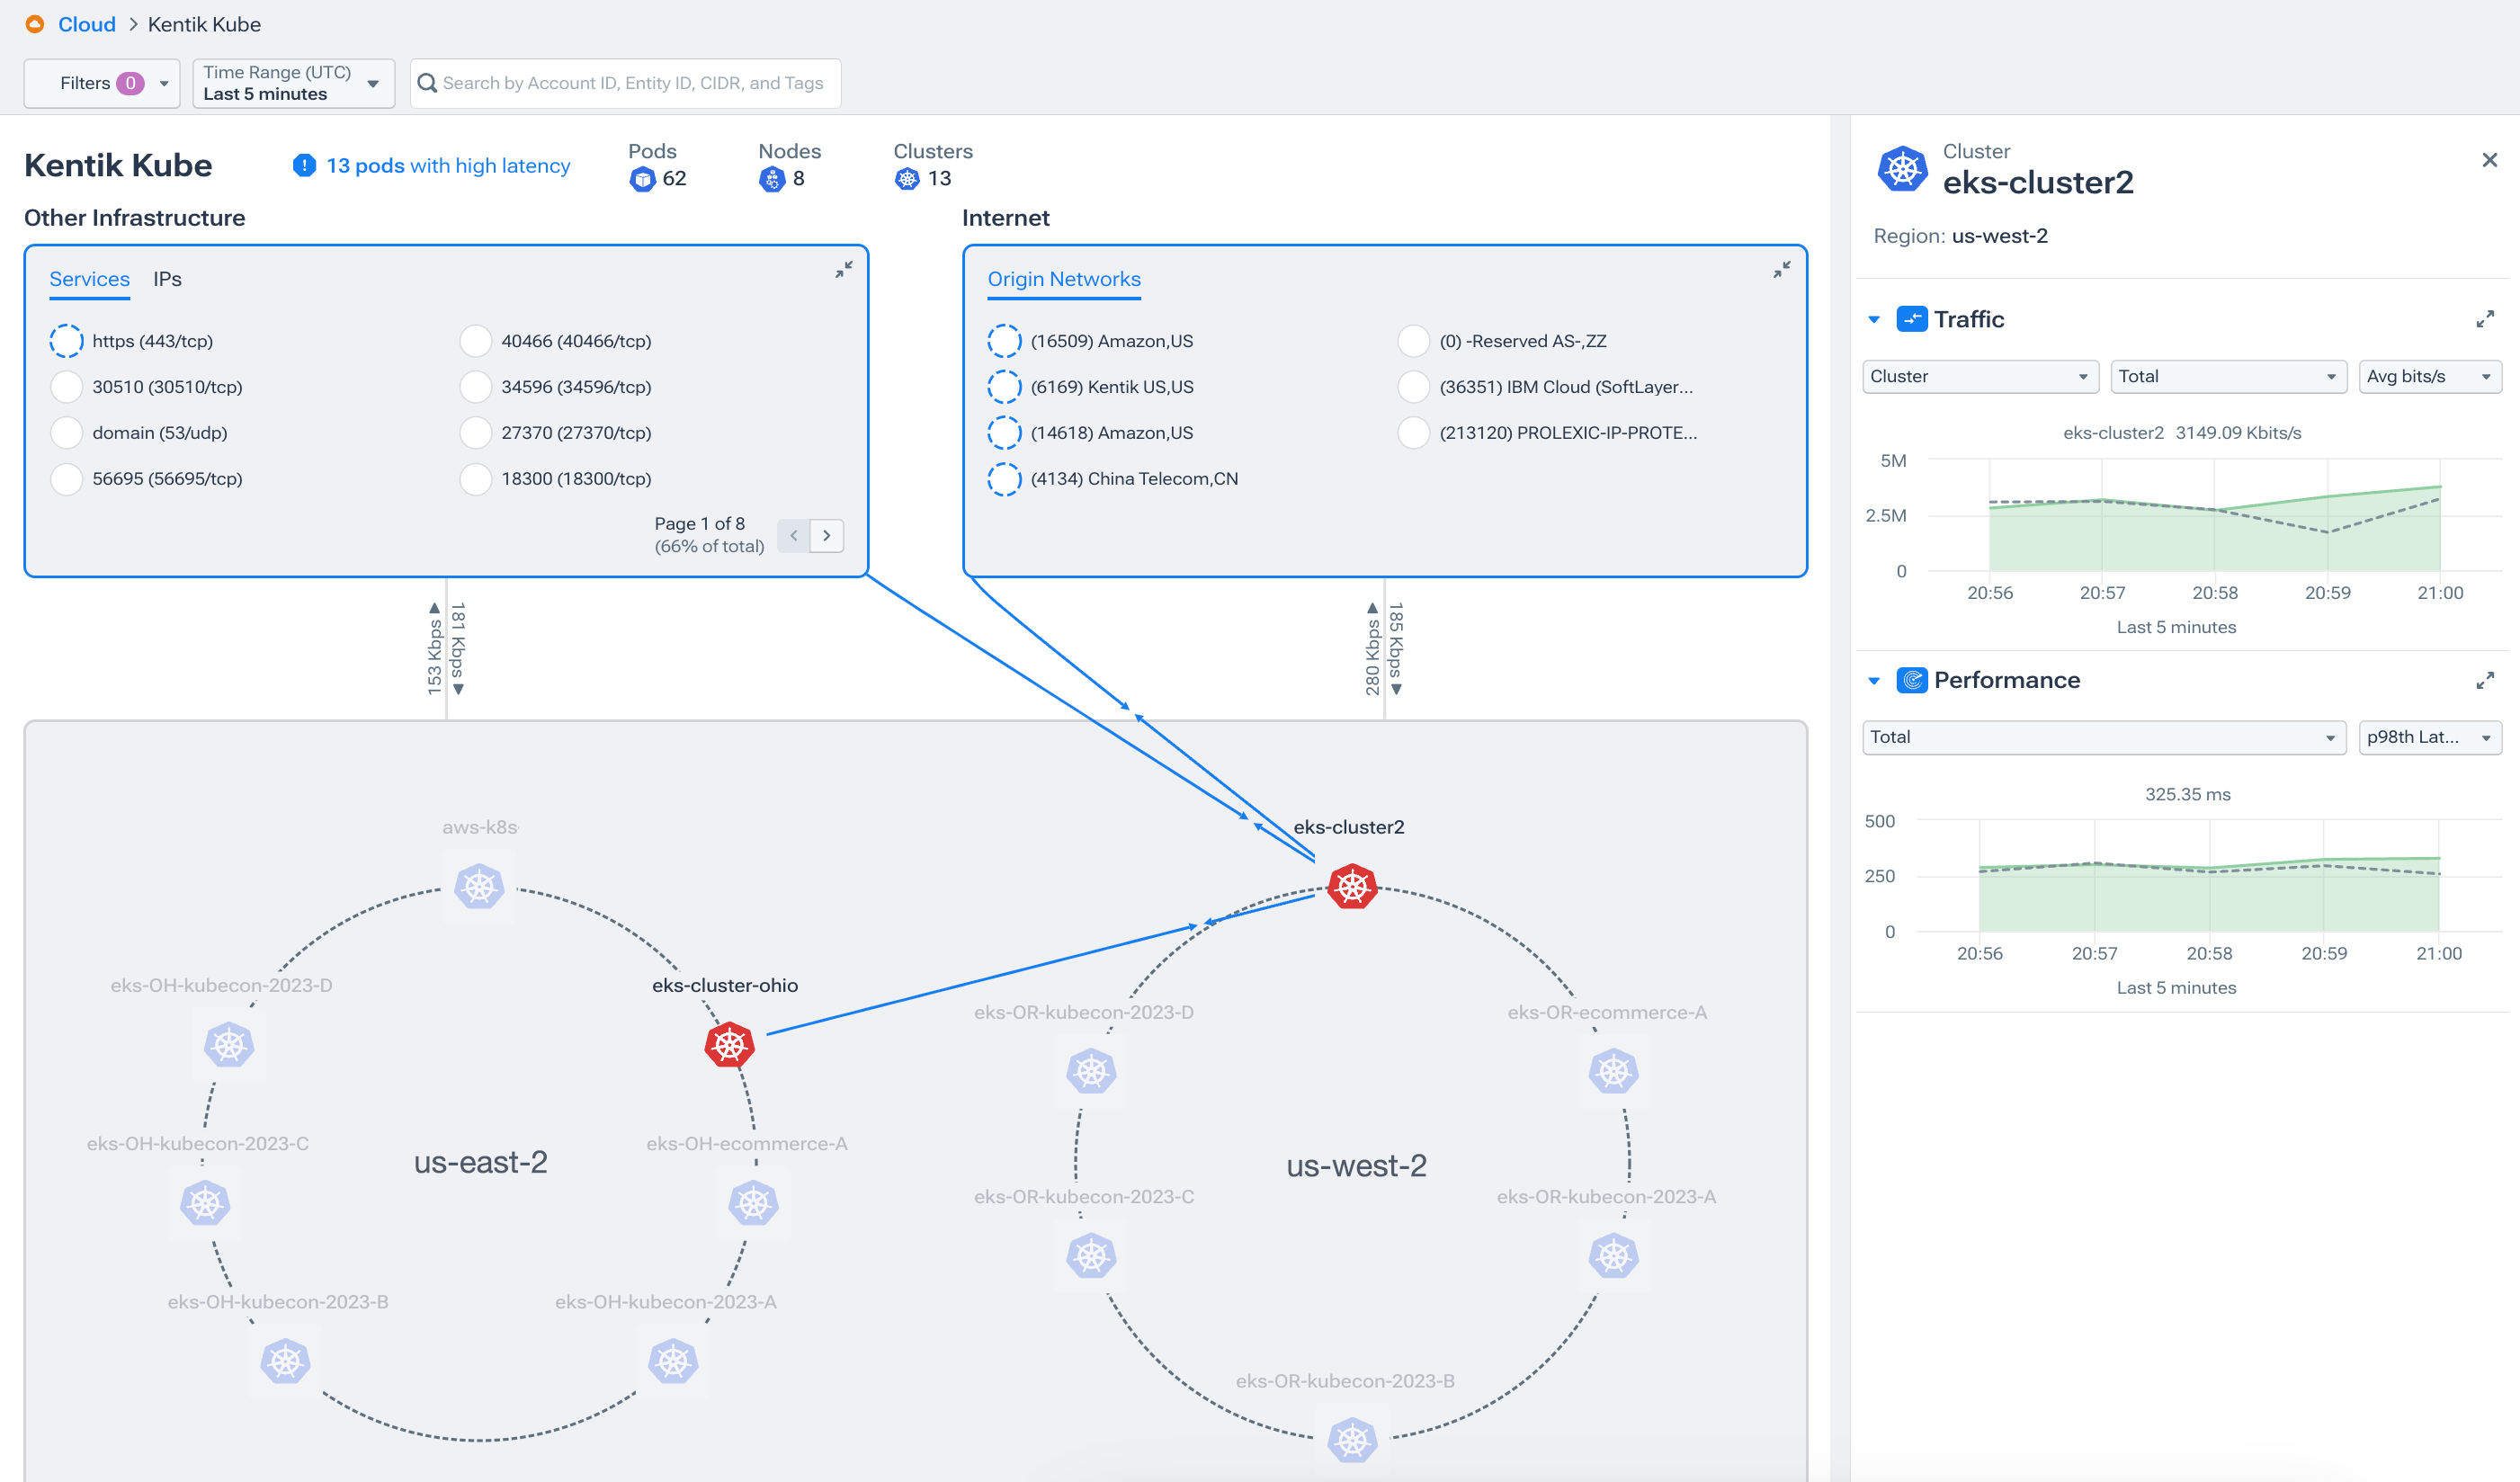
Visualizing with Kentik Kube
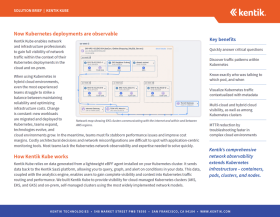
Kentik Kube provides east-west and north-south traffic analytics inside and among Kubernetes clusters, and will dynamically map your network once deployed.
Kentik provides a unique level of network-layer expertise and network-centric visibility in Kubernetes out of the box, including:
- Full visibility into inter-pod, inter-node, inter-cluster, pod-to-internet, and internet-to-pod traffic in one platform
- Deep, automated flow log enrichment
- Pod-level visibility into traffic spikes, transit and transfer, and egress
- Alerts and auditing on traffic to and from embargoed, prohibited, or watchlisted domains
Try Kentik Kube free
Kentik Kube is available for a 30-day free trial. It’s included in Kentik Cloud. Sign up to get started.
Key benefits
- Quickly answer critical questions
- Discover traffic patterns within Kubernetes
- Visualize Kubernetes traffic contextualized with metadata
- Multi-cloud and hybrid cloud visibility, as well as among Kubernetes clusters
- MTTR reduction by troubleshooting faster in complex cloud environments
Platform
Solutions
- Reduce Cloud Spend
- Migrate To and From Any Cloud
- Improve Cloud Performance
- Optimize Enterprise WAN
- Network Performance Monitoring
- Deliver Exceptional Digital Experiences
- Detect and Mitigate DDoS
- Harden Network Policy Management
- Investigate Security Incidents
- Visualize All Cloud and Network Traffic
- Troubleshoot Any Network
- Understand Internet Performance
- Optimize Data Center Networks
- Consolidate Legacy Tools
- Optimize Peering and Transit
- Plan Network Capacity
- Reduce Network Spend
- Grow Subscriber Revenue
