Introducing Kentik Kube: Revolutionizing Kubernetes Network Observability


Summary
Kentik Kube provides network insight into Kubernetes workloads, revealing K8s traffic routes through an organization’s data centers, clouds, and the internet.
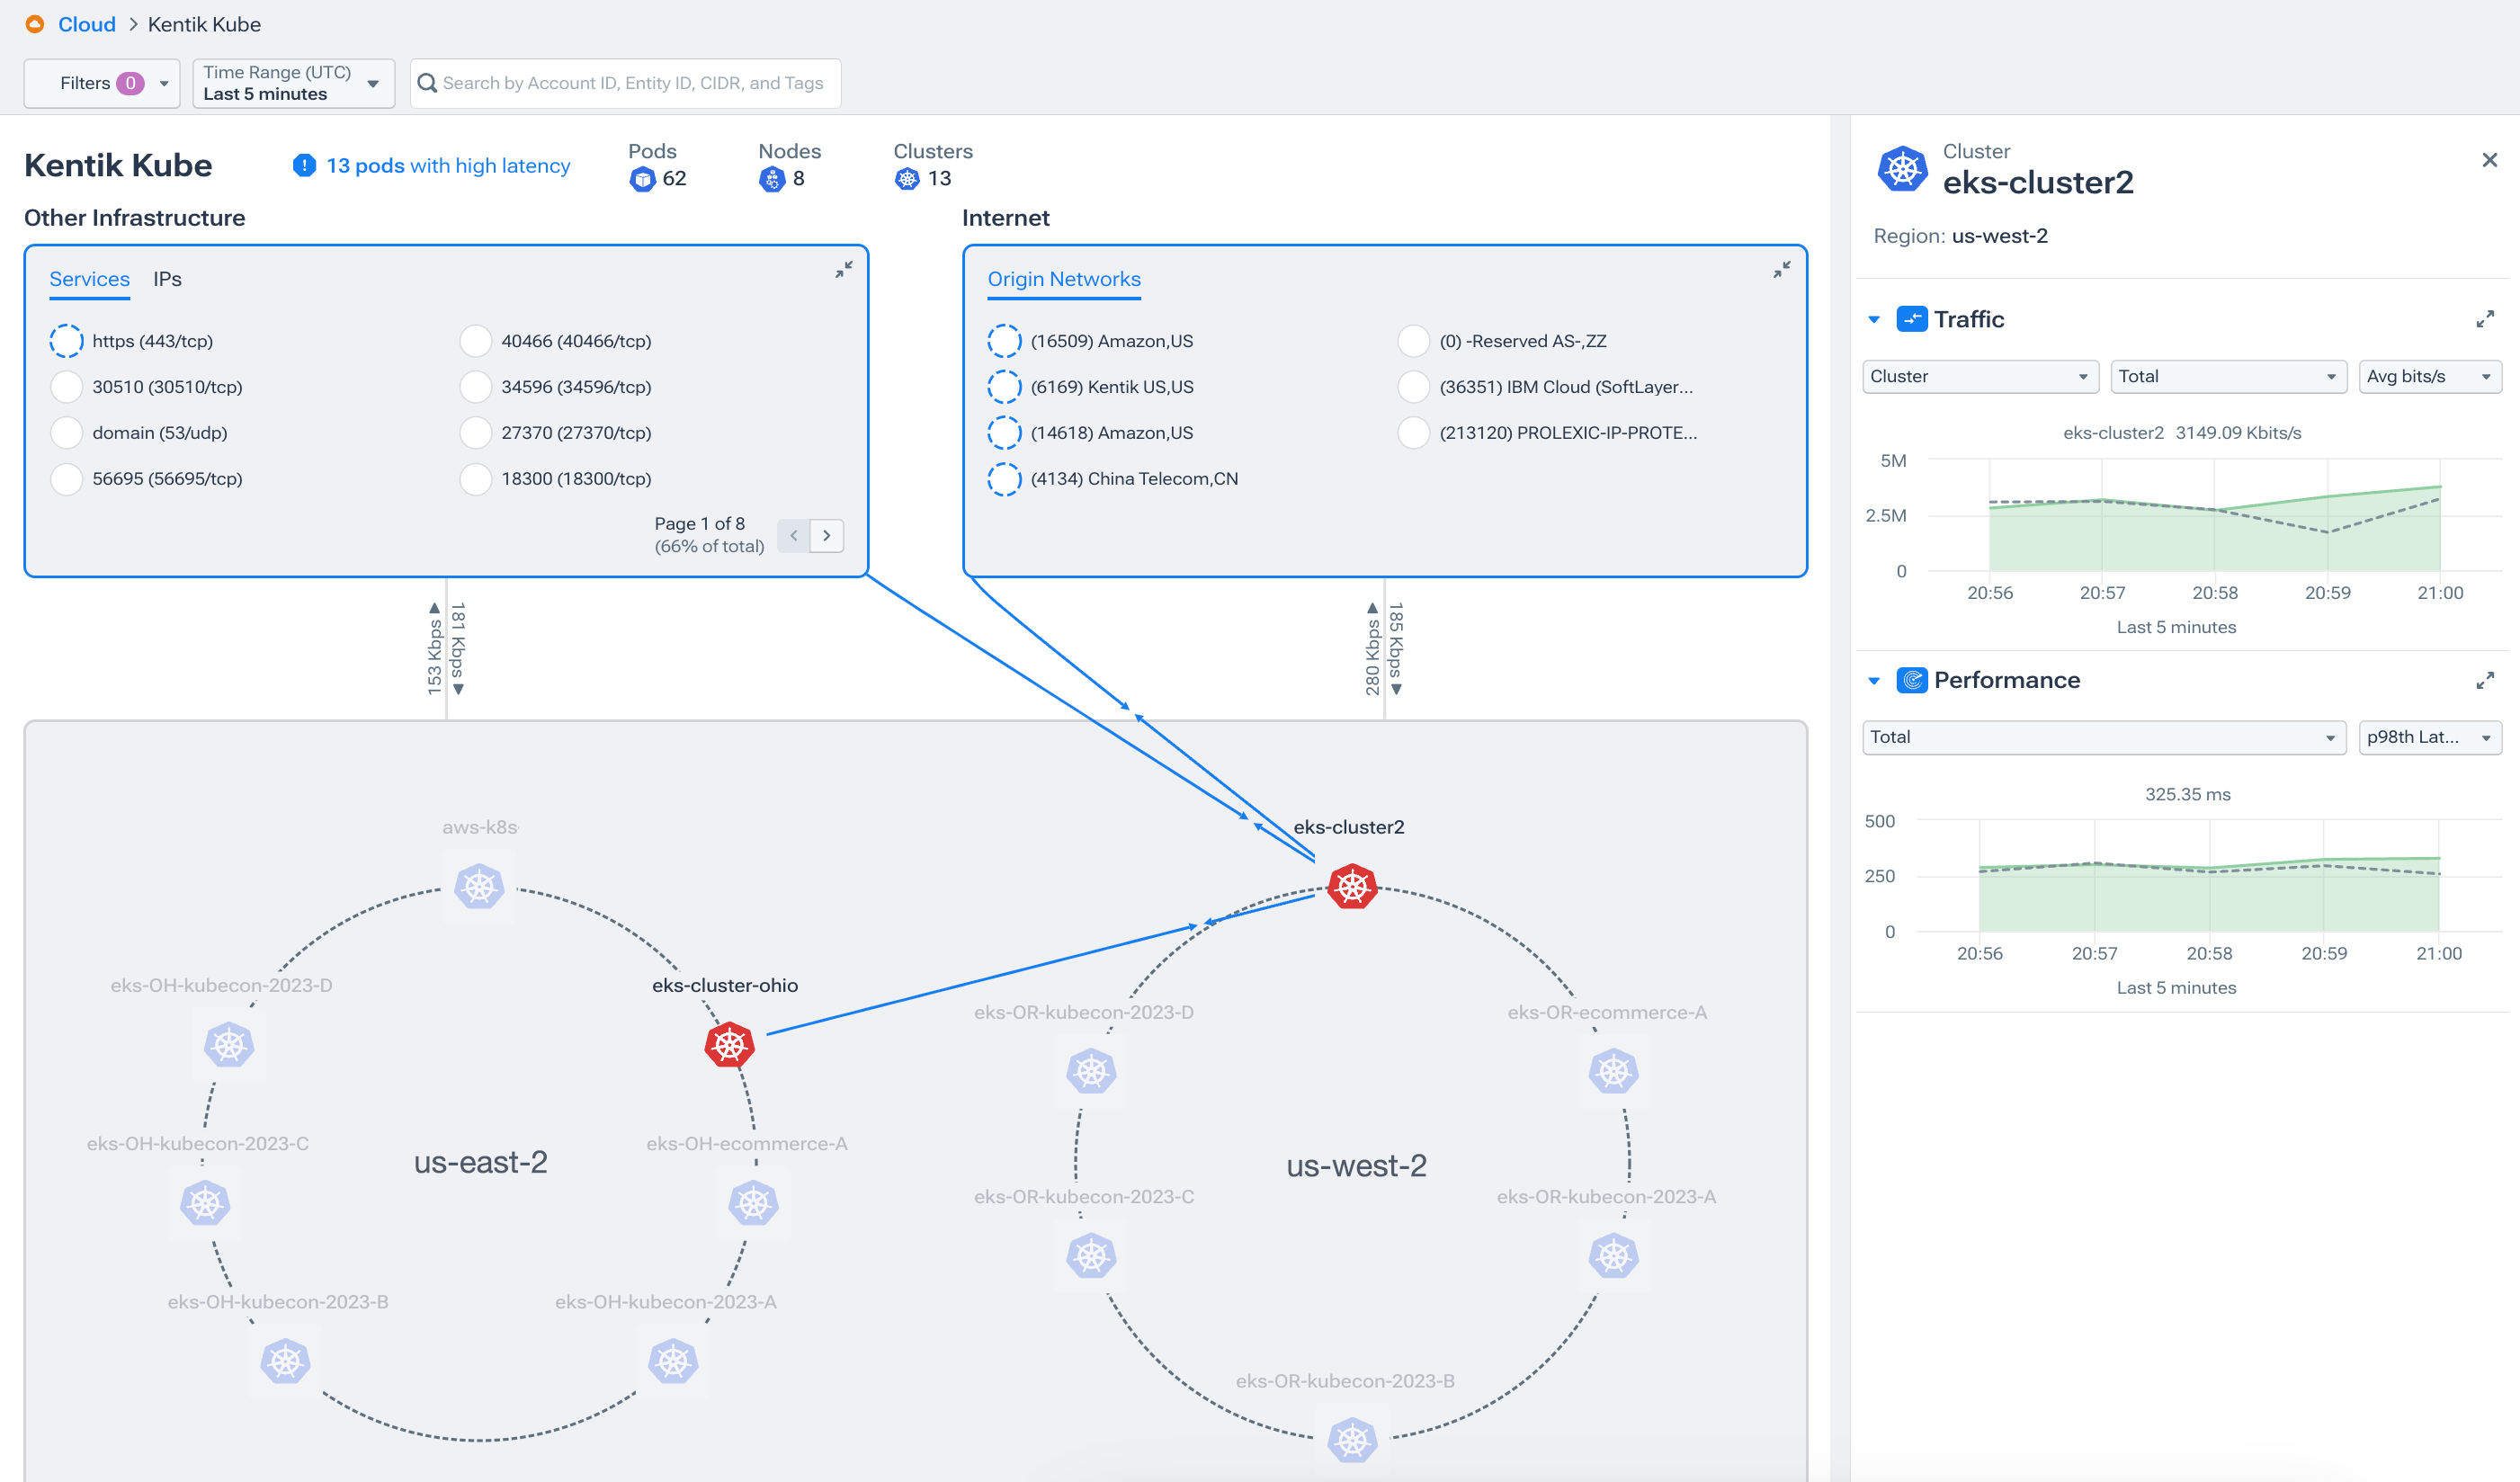
Kentik is proud to announce the general availability of Kentik Kube, an industry-first solution that provides network insight into Kubernetes workloads, revealing the routes enterprise container traffic takes through data centers, public clouds, and the internet.

Enterprises today navigate an intricate landscape, leveraging multiple types of Kubernetes, including AWS’ EKS, Google Cloud’s GKE, Microsoft Azure’s AKS, VMWare’s Tanzu, RedHat’s OpenShift, and myriad other private and public cloud orchestration solutions. This diversity might empower teams with autonomy, but it has also introduced significant complexity in ensuring high-level network visibility, troubleshooting capabilities, and cost transparency. Enterprise organizations with complex networks face a considerable gap in understanding network traffic, particularly in hybrid and multi-cloud infrastructure estates. For example, most Kubernetes monitoring tools don’t adequately reveal cluster-to-cluster traffic, internet-to-service and service-to-internet traffic, and take a more application-centric approach to observability.
Network-layer Kubernetes visibility at your fingertips

Kentik Kube is our response to these challenges. Kentik Kube gives network, cloud, and infrastructure engineers detailed network traffic and performance visibility inside and among their Kubernetes clusters, so they can quickly detect and solve network problems, surface anomalies and compliance issues, and identify outliers and misconfigurations that inflate network traffic costs (more on that below). All traffic data in Kentik, including K8s traffic analysis in Kentik Kube, is automatically enriched with critical business and security metadata that puts the telemetry in context.
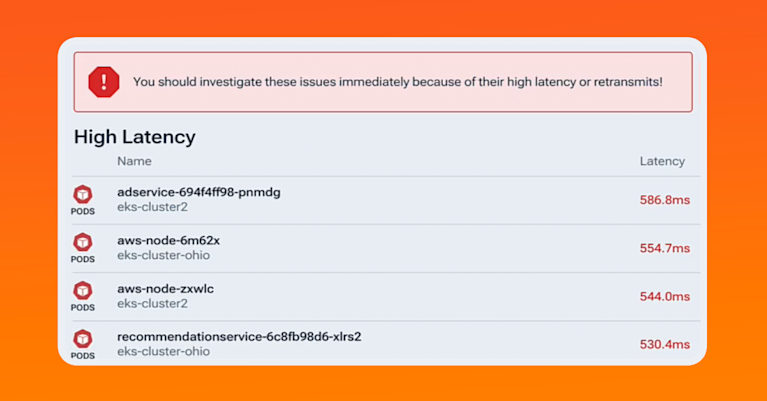
Kentik Kube ensures Kubernetes performance by enabling teams to quickly identify services and pods experiencing network anomalies and delays, helping them troubleshoot and resolve issues more efficiently. With the ability to configure alert policies, teams can proactively address high latency across nodes, pods, workloads, or services.
Kentik customers use hybrid and multi-cloud networks to run their businesses, like most enterprises. Total network observability – one view into context-enriched telemetry from container and VM-based cloud primitives across the major providers, from hybrid cloud interconnect, and from data center workloads of all kinds – empowers their teams to make better decisions faster, with less overhead. Most observability tools start at the application layer to help teams understand issues impacting apps. This approach has a lot of value, but it neglects the bigger picture of how applications and shared services impact each other, and how communications across infrastructure boundaries impact cost and performance. As technologies and teams grow and change, it’s critical that organizations maintain a big picture of how their apps and services use the network to pass data and requests around the entire software estate.
A lack of K8s visibility is more costly than you may think
Let’s face it: Traffic inside Kubernetes can still be a “black box.” Sure, K8s abstractions make it possible to operate cloud-native workloads reliably at scale. But they also make it hard to pinpoint exactly what’s happening under the hood. Since architecting Kubernetes is still a fairly new engineering discipline, the lack of standardization at many companies also makes troubleshooting and correcting configuration errors difficult.
While most enterprises prioritize operating cost reduction, for infrastructure engineers working with new technologies, balancing reliability with cost and performance optimization can be tricky and slow. Regardless of where a team is on the Kubernetes learning curve, they likely deal with the consequences of normal user error. Even the most experienced teams often must contend with old design decisions, as critical infrastructure must be reliable even as we update it according to hard-earned lessons.
Costly architectural decisions and misconfigurations are challenging to spot with application-centric monitoring tools, and many times, these errors impact the way Kubernetes, or cloud-managed Kubernetes services, route traffic. Most teams lack the Kubernetes network observability and expertise needed to identify, understand, and solve these problems quickly. Without context on historical traffic trends and anomalies, inter-service and inter-pod connections, and transfer types – context with IP and port-level specificity – many teams fly blind.
Engineers tasked with architecting in K8s may not even know that transmitting data with a NAT gateway can be expensive or know how to recognize NAT gateways implemented in their environments. But when egress, inter-region transfer, and gateway charges get out of control, this expertise suddenly becomes urgently important – anything to avoid another cloud bill that’s $250,000 over budget. Similarly, awareness of the specific pod, application, or user causing a spike can be critical to controlling runway costs. At many companies, getting this information can take days or weeks while the meter runs.
Kentik Kube was created to address these pain points directly by detecting traffic changes tied to new deployments or misconfigurations before costs escalate. Kentik Kube’s total network visibility also allows teams to trace the history of pod deployments across nodes, identify communication channels between pods, services, and other clusters, and detect and address traffic sent to unapproved destinations or embargoed countries.
Kentik Kube achieves this by collecting metadata across Kubernetes pods, clusters, and services combined with telemetry from a lightweight eBPF agent. This unique dataset, coupled with Kentik’s advanced analytics engine, empowers infrastructure and platform teams to move faster, reduce incident resolution times, and gain critical insights into the health and performance of their networks.
Kentik Kube is available now
As of today, we invite you to experience Kentik Kube firsthand. Sign up for a trial or join us at KubeCon 2023 in Chicago from November 7-9 at booth #B23 for a live demonstration of how Kentik Kube can reduce costs and increase efficiency for your organization. If you’re already a Kentik customer, reach out to your customer service partner to learn more.


