Using Kentik Detect to Find Current Attacks
Summary
With massive data capacity and analytical flexibility, Kentik Detect makes it easy to actively explore network traffic. In this post we look at how to use this capability to rapidly discover and analyze interesting and potentially important DDoS and other attack vectors. We start with filtering by source geo, then zoom in on a time-span with anomalous traffic. By looking at unique source IPs and grouping traffic by destination IP we find both the source and the target of an attack.
Source Geography Analysis in Data Explorer
In an earlier post, DDoS Detection: Separating Friend from Foe, we showed how to use Kentik Detect to diagnose a potential DDoS attack when it’s already apparent that there’s anomalous traffic to a particular IP address. In this post, we’ll look at another way in which Kentik Detect can help protect against attacks, which is to actively explore network traffic to discover attacks that you might not otherwise realize are happening. Specifically, we’ll look at how, starting with a simple source-geography analysis, we can use Kentik Detect’s Data Explorer to discover interesting and potentially important DDoS and other attack vectors.
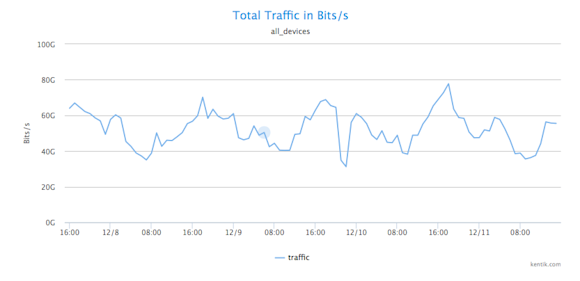
Fortunately, Kentik Detect has several features that make it easy to go beneath this surface picture:
- Alerting: Kentik Detect enables you to craft custom SQL-based alerts that issue notifications on anomalous traffic so you can learn about potentially threatening conditions as they arise. For a look at using our alerting system to protect against threats, see our recent post Detecting Hidden Spambots.
- Full-resolution data collection: Legacy network visibility tools only support drill-down to a limited set of pre-defined and calculated graphs and tables that often lead to analytical dead-ends. But with Kentik’s big data approach to flow records you’re no longer limited by those constraints. Kentik Detect allows you to analyze data on billions of flows, enriched with correlated data on BGP routing and geoIP.
- Flexible analytical options: Kentik Detect provides a comprehensive set of options for shaping the results of query-generated graphs and tables, including grouping, device selection, time range, and units as well as filtering on dozens of different fields. As we go through this example, you’ll see that it’s very easy to change perspective on your data.
Getting Beneath the Surface
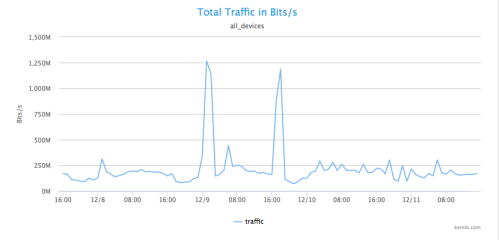
Now let’s look at putting Kentik Detect’s tools to work investigating suspicious traffic. As most of us are aware, most of the attacks on networks worldwide originate from just a few specific regions. With the querying capabilities of the Data Explorer, we can look at traffic that comes from a small set of countries that are typically considered most suspect. In this case, the network doesn’t typically get a lot of traffic from China, so we can use China as a test case to find anomalous traffic spikes.
To show how this process works, let’s first create a visualization in the Data Explorer that’s narrowed to traffic coming only from China. We start by setting the Time Options (upper left) to a time range covering four days starting with the afternoon of December 7th and ending on the afternoon of December 11th, and checking that Group by Metric is set to Total Traffic and Units is set to Bits/second (both defaults). We then set a filter for source geography in the left-hand sidebar:

- Define a filter for traffic whose source is China:
- From the drop-down metrics menu, we choose Source Country.
- We leave the operator setting at “=” (default).
- In the value field, we enter CN for China. - Click the Apply button at the upper right of the page. A graph is rendered and a corresponding table is populated below the graph that shows total traffic in bits per second coming from China.

Unique Source IP Analysis
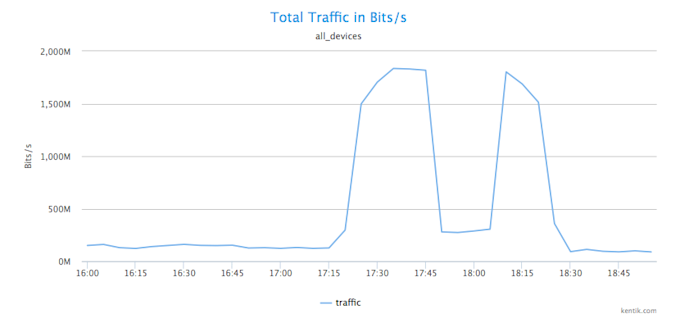
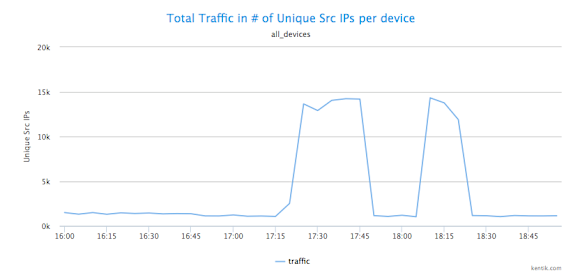
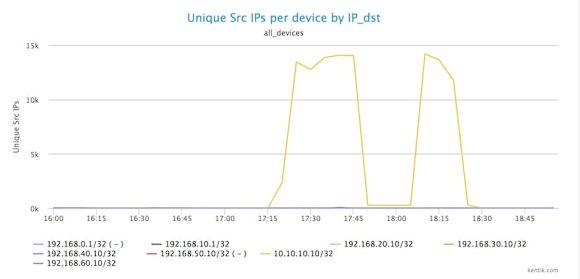
To find out if these traffic spikes are suspicious, we’ll check if they are anomalous not only in terms of bits per second but also in terms of the number of source IPs. We look for a spike in source IPs by selecting Unique Src IPs from the drop-down Units menu, then clicking Apply. We can see in the newly rendered graph that there is in fact a huge increase in the number of unique source IP addresses sending traffic to a particular destination IP.
Who’s Getting All that Traffic?
The next question is clearly which IP or IP’s are getting all this traffic from 14K or so individual host IPs? To get at this, we keep units at Unique Src IPs while choosing Destination » IP/CIDR from the drop-down Group by Metric menu. When we group traffic by destination IPs we can see that the target is one solitary destination IP address: 10.10.10.1. There’s really only one likely explanation for traffic from a suspect country to a single IP that suddenly spikes from nearly nothing to more than 1 Gbps: this is definitely an attack.
Flexibility and capacity
Thanks to Kentik Detect’s analytical flexibility and massive data capacity, we’ve so far been able to rapidly filter by source geo, to zoom into a time period, to look at unique source IPs in our traffic, and to group traffic by destination IP. If our access to data were limited by the same constraints that apply to legacy tools, we’d likely have to end our analysis here because we wouldn’t be able to access the underlying data needed to dig deeper. But it’s worth knowing more: was this just a volumetric attack, or was there more to it? We’ll explore that in our next DDoS-related blog post, where we’ll cover some interesting additional ways that Kentik Detect makes it easy to quickly change perspective on our data so we can gain deeper insight into what’s happening on our network.
Read our solution brief to learn more about Kentik DDoS Detection and Defense.


