What is Synthetic Transaction Monitoring?
Synthetic Transaction Monitoring (STM) is a proactive approach used to measure and test the performance, functionality, and user interaction experience of a web application or service. Unlike traditional monitoring that relies on real-user data, STM creates and uses “synthetic” or simulated transactions to replicate user behaviors or actions on a website or within a web application.
Typically, this involves the use of automated scripts or tools, sometimes called agents, that carry out a series of actions mirroring those a real user might take, such as logging in, browsing items, adding products to a shopping cart, and checking out.
The key benefits of STM include its ability to pinpoint performance or functionality issues before they affect real users, understand user-experience across various geographical locations, and monitor the web application’s performance 24/7, even during off-peak hours when real user traffic might be low.
Synthetic Monitoring vs. Synthetic Transaction Monitoring
Businesses depend on the performance of their applications to protect their brands and grow their businesses. Synthetic monitoring is the active process of simulating visitor or network traffic to a network-accessible resource to test for availability, response time and other performance metrics. These synthetic tests can be targeted at all layers of the stack including the network, routing and application layers.
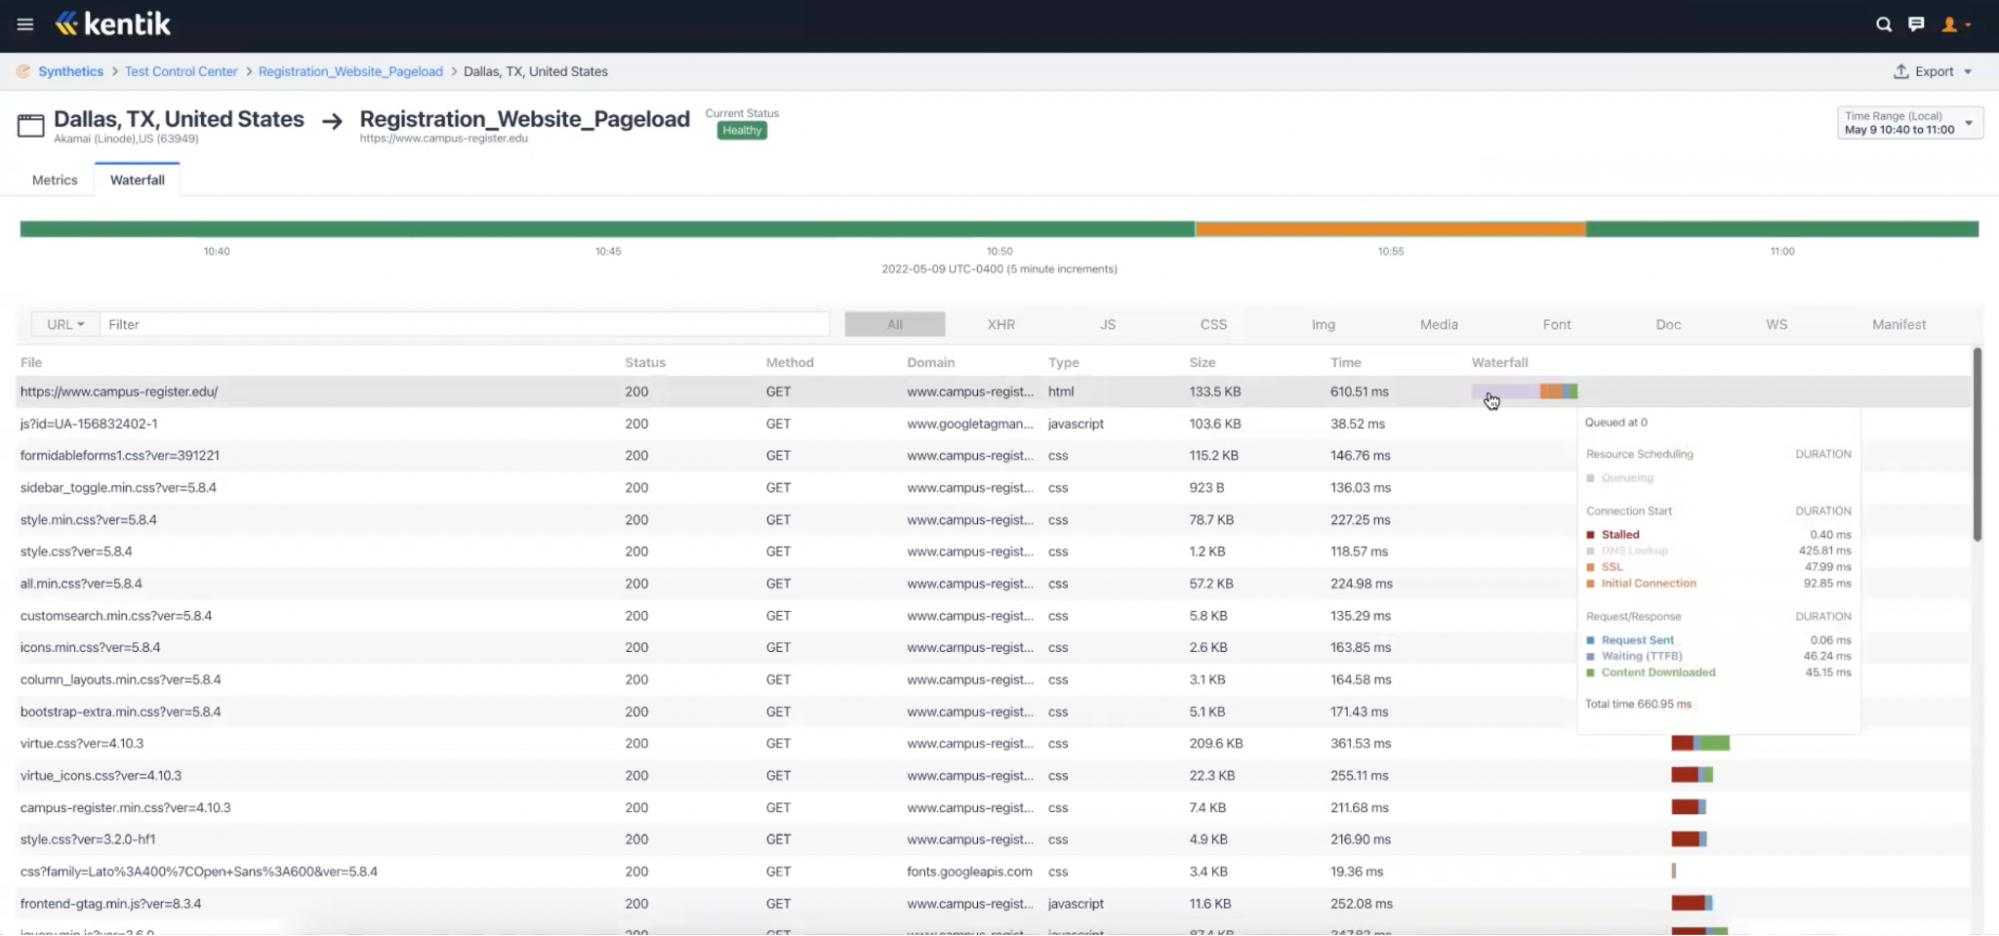
For example, we might perform a synthetic page load test that involves generating traffic to a site and evaluating the load performance of each element of a page. The load order and load duration of each element in the Document Object Model (DOM) of a page being tested can be presented in a waterfall graph.

But what if we wanted to go deeper and understand the performance of a web application in terms of specific user interactions with that site? This is where Synthetic Transaction Monitoring comes in.
While the terms ”synthetic monitoring” and “Synthetic Transaction Monitoring” are sometimes used interchangeably, Synthetic Transaction Monitoring typically refers to the monitoring of web transactions—the interaction between a client (such as a web browser) and a server (e.g., a web server, a backend database, some cloud-based service, or other components of a distributed web application)—performed in response to some specific interactions that users have with a site.
Synthetic Transaction Monitoring can be used to simulate and monitor the interactions that users have with a web application and identify performance or user experience issues. For example, every e-commerce site has many internal and third-party components that enable a customer to shop, including login, search, recommendation engine, product catalog, making payment and selecting delivery options. Delays or errors in any of these steps can impact the customer experience and lead to lost revenue. Synthetic Transaction Monitoring enables web application developers to benchmark the performance of each of these elements and troubleshoot specific performance issues.
About Kentik: Kentik is a network intelligence and observability platform used by modern infrastructure teams to monitor, understand, and operate complex hybrid networks. By combining telemetry such as flow data, routing context, synthetic tests, and network monitoring metrics, Kentik helps teams pinpoint root cause faster and make better decisions about performance, cost, and security.
Learn how AI-powered insights help you predict issues, optimize performance, reduce costs, and enhance security.

Why is Synthetic Transaction Monitoring Important?
Synthetic monitoring is all about proactively testing and monitoring specific elements of your network, the services it relies on, and the applications it delivers. That means using artificial traffic—instead of end-user traffic—to test various components of digital experience including device availability, DNS activity, web application page load times, and BGP activity.
Synthetic Transaction Monitoring allows us to simulate an end-user’s experience interacting with a web application. Beyond just monitoring the network layer, application layer tests allow us to proactively test the availability of an HTTP service, analyze how every component of a web application is loading, and even simulate an end-user interacting with the web application itself.
Imagine an ecommerce website hosted in several public cloud regions. Customers access it from all over the world to (for example) log in, make purchases, book flights, reserve cars, or leave comments on a news article. If any of these application components are unavailable, malfunctioning, or slow to load, that can lead to a lack of customer confidence, lost users, and lost revenues.
Synthetic Transaction Monitoring can be used to actively monitor what it’s like to log into your site, click on various elements on the web page, add something to the shopping cart, and so on. Every step in an end-user’s interaction or customer journey within a site can be simulated, giving us the ability to monitor digital experiences without having to wait for trouble tickets to come in.
Simulating these user-level interactions is crucial to optimizing your online strategy and uncovering transaction steps that aren’t working as intended, before they impact actual users and your organization’s bottom line.
Synthetic Transaction Monitoring Use Cases
Most use cases for Synthetic Transaction Monitoring fall into two categories:
- Testing the responsiveness of the steps in an app that you own from various geographic regions. An example is that you want to simulate your customers’ experience in your e-commerce store from dispersed geographies.
- Testing from your locations to a set of commonly used apps. The best example of this use case is a multi-location corporation that wants to monitor the response times of apps used by employees at different locations/offices, such as Zoom and Microsoft Office.
Synthetic Transaction Monitoring with Kentik
Kentik’s Synthetic Transaction Monitoring features allow developers to easily do the following:
- Record a web transaction using Chrome DevTools in the regular Chrome browser to record a series of interactions and output them to an equivalent Puppeteer script
- Import the Puppeteer script into a Kentik transaction test
- Run the script from any number of public or private application agents
- Measure and alert on the total transaction time
- Capture screenshots during transaction execution
- View and analyze a waterfall graph of all objects on all pages visited
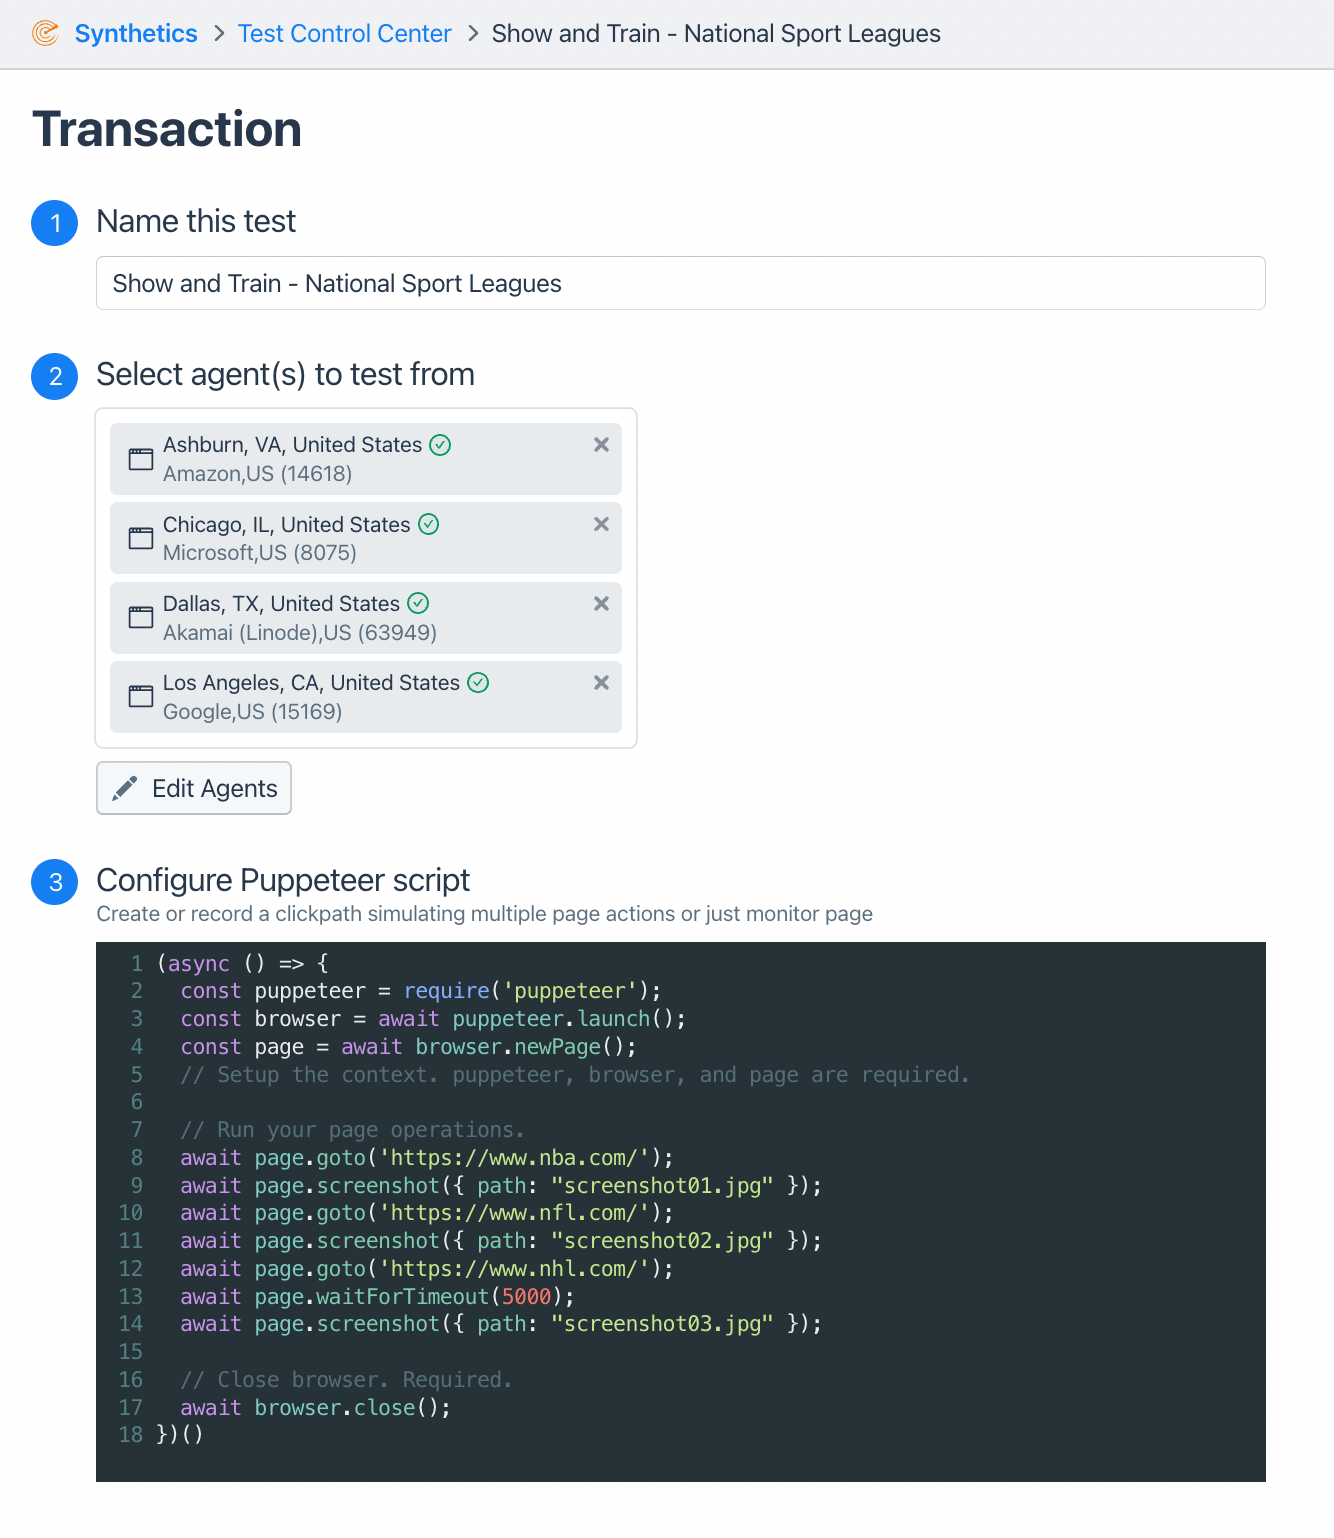
Here’s what the setup looks like in Kentik when configuring the test. In this simple example, we’re configuring four different, geographically-distributed test agents to visit several different URLs and take metrics and screenshots of each:

Synthetic tests can be set as both automatic and periodic on time intervals. Users are able to test from hundreds of Kentik public test agents and private agents can easily be deployed.
Synthetic Transaction Monitoring Test Results
Kentik shows the results of STM tests on a timeline:
- Results are shown over a user-selectable time period.
- Lags in performance are indicated by color: Orange is a warning, red is critical, measured against static or dynamic baselines.
- The graph shows total completion time: Selecting a point on the line will indicate total completion time and the rolling standard deviation baseline.
- Screenshots captured during the transaction process are included.
- The Waterfall tab shows the load order and load duration of each element in the DOM of every page visited.


Frequently Asked Questions—Synthetic Transaction Monitoring
Q: What are synthetic transactions?
A: Synthetic transactions are simulated web transactions, typically HTTP requests—that represent the interaction between a client (such as a web browser) and a server (e.g., a web server, a backend database, some cloud-based service, or other components of a distributed web application)—performed in response to some specific interactions that users have with a web application.
Q: What is synthetic monitoring?
A: Synthetic monitoring is the active process of simulating visitor requests to a network-accessible resource and testing for availability, response time, and other performance metrics. See “What is Synthetic Monitoring?” for more on this topic.
Q: What is the difference between synthetic monitoring and synthetic transaction monitoring?
A: The terms “synthetic monitoring” and “Synthetic Transaction Monitoring” are sometimes used interchangeably, but Synthetic Transaction Monitoring refers specifically to the monitoring of web (HTTP) transactions—the interactions between a local client (such as a web browser) and a remote server, cloud service, or API. Just as when real users interact with a web app, Synthetic Transaction Monitoring can be used to simulate and monitor those same interactions, in a periodic and programmatic way, making it possible to identify performance or user experience issues before they negatively impact real users.
Q: How does synthetic transaction monitoring work?
A: Synthetic Transaction Monitoring works by using “agents” distributed at different locations throughout the world to periodically run proactive tests against a specific target, such as your public website. These agents programmatically run a script that simulates some end user interaction—such as logging into the site, clicking on objects, adding items to a shopping cart—and monitoring the performance of the interactions that are important to you and your business.
About Kentik’s Synthetic Transaction Monitoring Solution
Delivering great digital experiences is critical to the success of your organization. Synthetic Transaction Monitoring can help you accurately monitor digital experiences by measuring both transaction responsiveness as well as emulating user location. Measuring and reporting these performance metrics on an ongoing basis are a critical part of a complete network intelligence and observability solution.
For more information on Kentik’s Synthetic Monitoring capabilities, watch our on-demand webinar, “Debug faster! Measure web page and network performance together”, or request a demo.
Related Reading
Learn more about digital experience management topics in these additional Kentipedia articles and blog posts:


