SaaS Network Performance Monitoring
What is SaaS Network Performance Monitoring?
Network Performance Monitoring (NPM) refers to the process of measuring, diagnosing and optimizing the service quality of a network as experienced by users. SaaS NPM is the collection, retention and analysis of network performance monitoring data in a SaaS repository, as opposed to traditional physical or virtual appliances.
NPM Solution Deployment Models
NPM solutions have traditionally utilized an appliance deployment model. An appliance-based PCAP probe with one or more interfaces connects to router or switch span ports or to an intervening packet broker device (such as those offered by Gigamon or Ixia). The appliance records all packets passing across the interface into memory and then into longer-term storage. In virtualized datacenters, virtual probes may be used, but they are also dependent on network links in one form or another.
Physical and virtual appliances are costly from a hardware and (in the case of commercial solutions) software licensing point of view. As a result, in most cases, it is only fiscally feasible to deploy PCAP probes to a few, selected points in the network. In addition, the appliance deployment model was developed based on pre-cloud assumptions of centralized datacenters holding relatively monolithic application instances. As cloud and distributed application models have proliferated, the appliance model for packet capture is less feasible, because in many cloud hosting environments, there is no way to deploy even a virtual appliance.
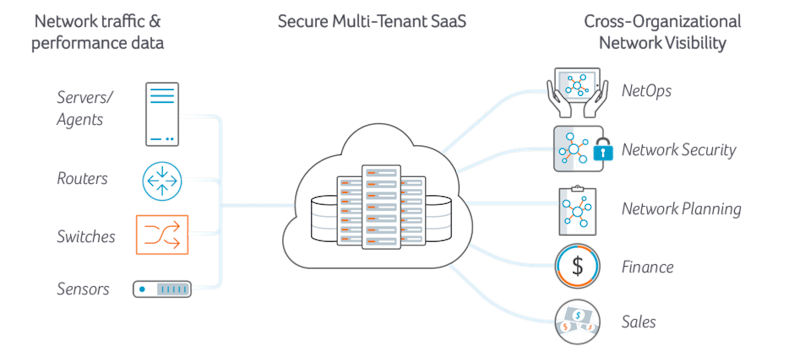
A cloud-friendly and highly scalable SaaS model for network performance monitoring splits the monitoring function from the storage and analysis functions. Monitoring is accomplished with the deployment of lightweight monitoring software agents that export PCAP-based statistics gathered on servers and open source proxy servers such as HAProxy and NGNIX. Exported statistics are sent to a SaaS repository that scales horizontally to store unsummarized data and provides Big Data-based analytics for alerting, diagnostics and other use cases. While host-based performance metric export doesn’t provide the full granularity of raw PCAP, it provides a highly scalable and cost-effective method for ubiquitously gathering, retaining and analyzing key performance data, and thus complements PCAP.
The definitive guide to running a healthy, secure, high-performance network

Benefits of Deploying NPM as SaaS

The SaaS model allows for easy integration of other data types such as volumetric flow records from network infrastructure devices, BGP routing updates, Geolocation and SNMP interface data. There are multiple benefits to this data integration. First, when performance metric data is gathered from packets within the context of statefully tracked traffic flows, the metrics are easily mapped to Internet routing paths gained from BGP updates.
For digital businesses whose use experience is inextricably tied to Internet traffic delivery, path insight allows for rapid analysis and correlation of performance issues with controllable variables such as first hop ASNs. For example, by isolating first hop ASN and destination ASN path pairs, it is relatively easy to find out if a particular first hop ASN is the cause of performance degradation. This analysis provides an actionable next step, such as shifting traffic delivery to a different datacenter or first hop ASN.
SaaS solutions are architected to scale on demand, without forcing additional CapEx costs of additional appliance hardware. Monthly subscription costs are typically tied to the number of devices being monitored, so they grow smoothly, predictably, and proportionately to the value delivered.
Kentik offers the industry’s only Big Data-based, SaaS NPM solution that integrates nProbe host agent performance metrics and billions of NetFlow, sFlow, IPFIX, BGP records matched with geolocation data.
Learn More About Kentik’s SaaS Network Performance Monitoring Solutions
Kentik offers a suite of advanced network monitoring and diagnostics solutions designed for today’s complex, multicloud network environments, delivered entirely as SaaS.
The Kentik Network Observability Platform empowers network pros to monitor, run and troubleshoot all of their networks, from on-premises to the cloud. Kentik’s network monitoring solution addresses all three pillars of modern network monitoring, delivering visibility into network flow, powerful synthetic testing capabilities, and Kentik NMS, the next-generation network performance monitoring system.
To see how Kentik can bring the benefits of SaaS network observability to your organization, request a demo or sign up for a free trial today.


