Kubernetes Networking
Understand your Kubernetes networks, from container, to data center, to public cloud.
Improve network performance
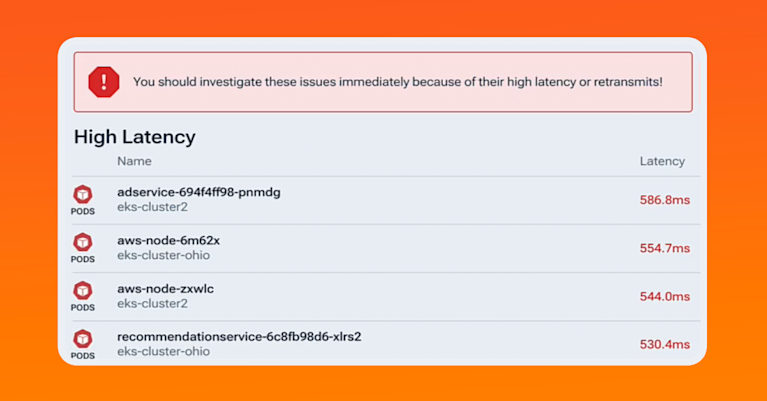
- Discover exactly which services and pods are experiencing network latency and see which applications are affected.
- Identify service misconfigurations or policy violations without capturing packets.
- Proactively configure alert policies to find latency problems that impact nodes, pods, workloads, or services.
Gain end-to-end K8s visibility
- Identify all clients and requesters consuming your Kubernetes services.
- Know exactly who was talking to which pod, and when.
- Get alerts and auditing on traffic to and from embargoed, prohibited, or watchlisted domains.
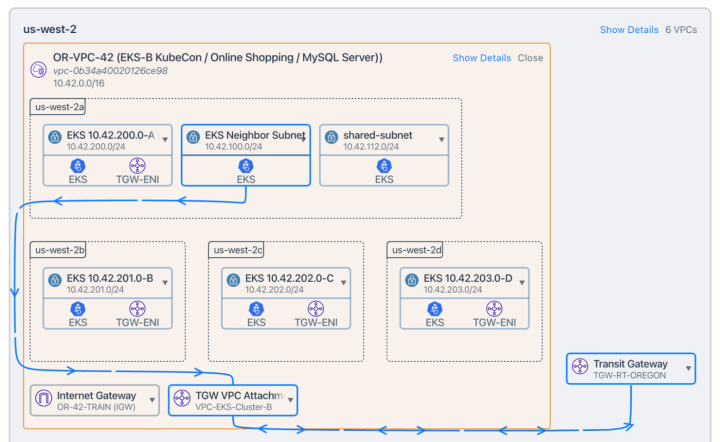
Unify Kubernetes and enterprise data centers
- Infrastructure engineers get a consistent model to support performance monitoring, troubleshooting, and policy validation.
- Cloud, container, on-prem, and internet networking are seamlessly integrated in a single solution.
- Kentik Kube is the industry’s first solution that unifies the network performance of on-prem and cloud Kubernetes environments.
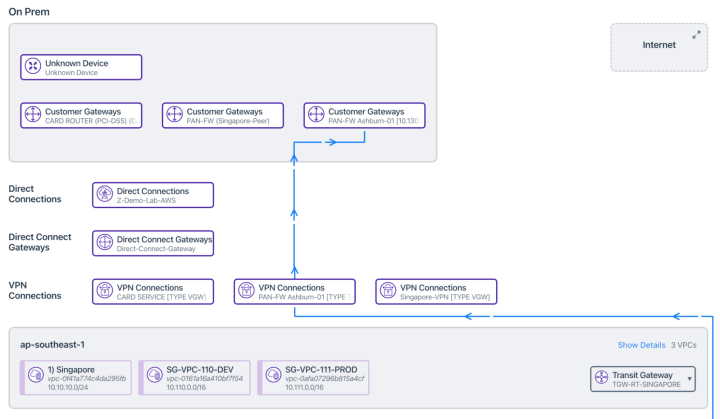
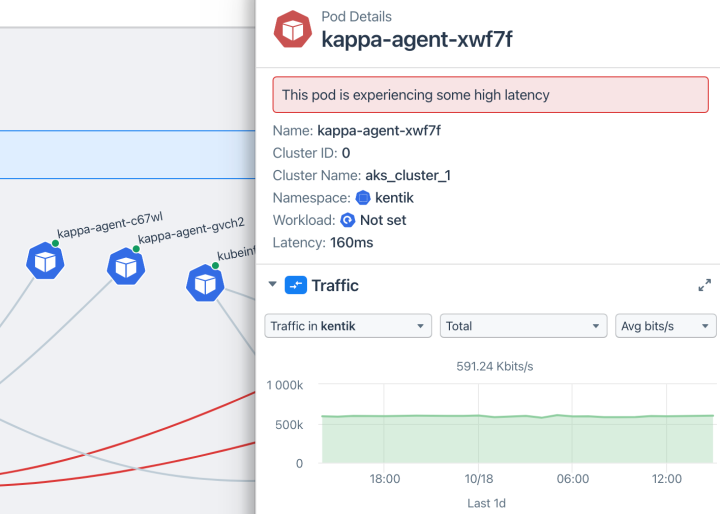
Troubleshoot performance problems
- See connectivity health within and between pods and the rest of your network.
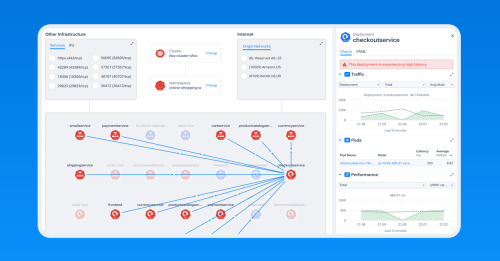
- Identify problems and root causes with pod-level visibility into traffic spikes and trends, transit and transfer, and egress.
- Quickly understand traffic down to the request and pod responding.
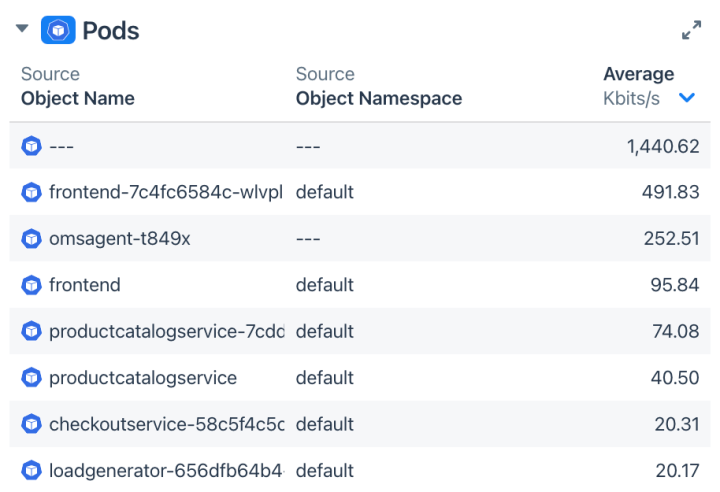
List top users for Kubernetes services
- List out the top traffic producers by object name or application.
- Get a good picture of the network interaction within your microservices framework.
- Identify applications that may be overloading the system, creating delays, or knocking deployments out of balance.
Deploy easily
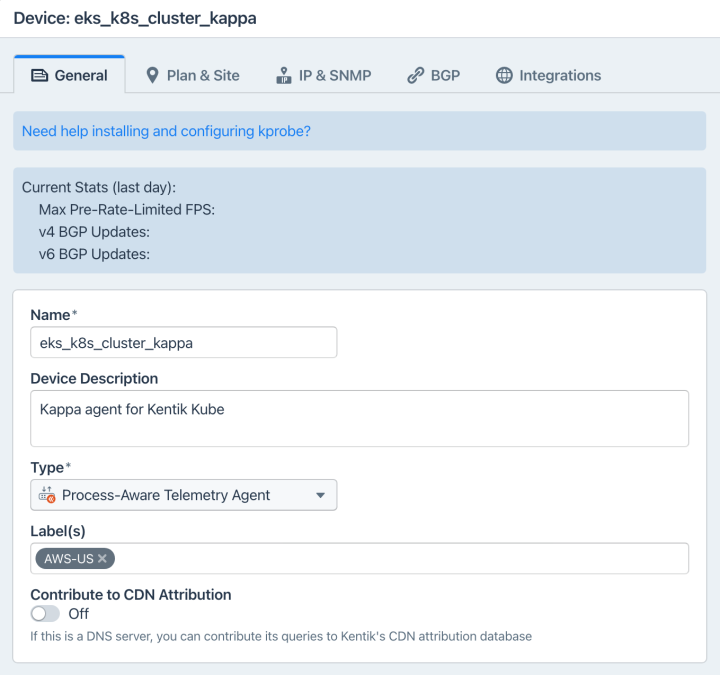
- Deploy Kubernetes network observability using a lightweight eBPF agent installed on your Kubernetes cluster.
- The agent sends data back to the Kentik SaaS platform, allowing you to query, graph, and alert on conditions in your data.
- Kentik’s solution works alongside any other networking CNI that you use.
See your container networks in context
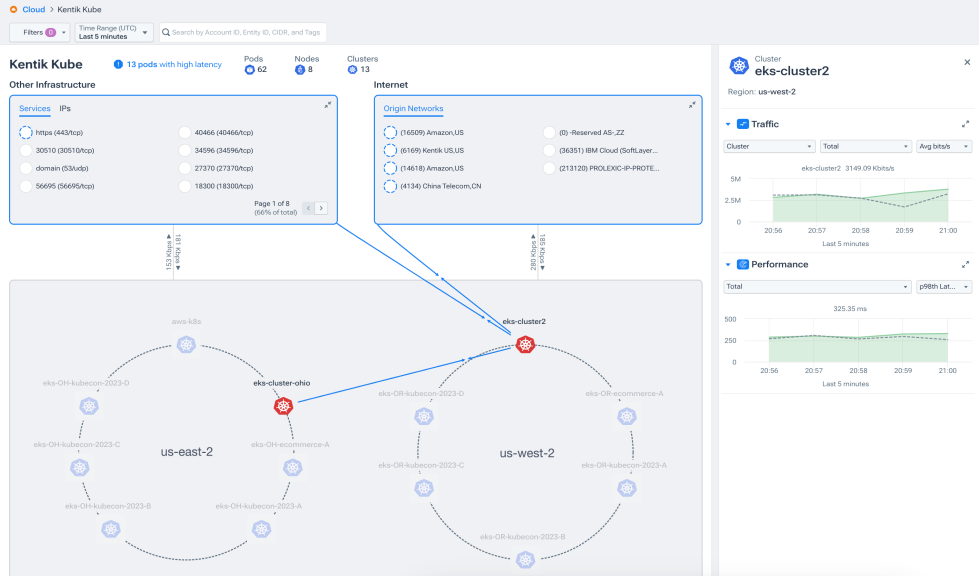
- See your network’s big picture and put your Kubernetes clusters in context with the rest of your data centers, multi or hybrid clouds, and the internet.
- Kentik gives you the big picture and shows you how everything relates.
- See how traffic flows at the macro level and report important health conditions up to the highest level for complete visibility.

“Visibility into cloud-deployed Kubernetes clusters in Kentik is super clear and makes troubleshooting so much easier.”
Louis Bolanos
Staff Cloud Network Engineer, Box
Troubleshooting Kubernetes Network Performance Issues with Kentik Kube
Explore the platform
We use cookies to deliver our services.
By using our website, you agree to the use of cookies as described in our Privacy Policy.

