Troubleshooting a SaaS Performance Problem with Kentik


Summary
Discover how Kentik’s network observability platform aids in troubleshooting SaaS performance problems, offering a detailed view of packet loss, latency, jitter, DNS resolution time, and more. Phil Gervasi explains how to use Kentik’s synthetic testing and State of the Internet service to monitor popular SaaS providers like Microsoft 365.
SaaS applications make provisioning new apps simple for IT operations, but what’s not so easy is troubleshooting performance problems considering we don’t own or manage the SaaS provider’s network or the public internet.
Kentik’s network observability platform can monitor SaaS providers like Office365, Salesforce, GitHub, ServiceNow, and many more, gathering information about packet loss, HTTP latency, jitter, DNS resolution time, web page load time, etc. In that way, you can monitor a SaaS application’s connection and detailed performance characteristics, including tracing the network path over the public internet.
Synthetic testing and SaaS monitoring
We use a synthetic testing mechanism to continually interact with a particular SaaS provider and capture metrics from test agents deployed anywhere in the world. Agents are lightweight programs that can be deployed almost anywhere, including individual branch offices, to test SaaS application delivery to and from a specific location.
Tests include simple ping tests to check connectivity and gather metrics on loss, latency, and jitter. Synthetic tests can also monitor a web server’s response to an HTTP(S) request or API call, simulate an end user interacting with an application, measure the responses from DNS requests, and so on.
The State of the Internet
The State of the Internet is a service Kentik provides all our customers as a built-in function of the platform. We’ve deployed test agents globally in strategic locations to gather performance metrics of many of the most popular SaaS providers and services.
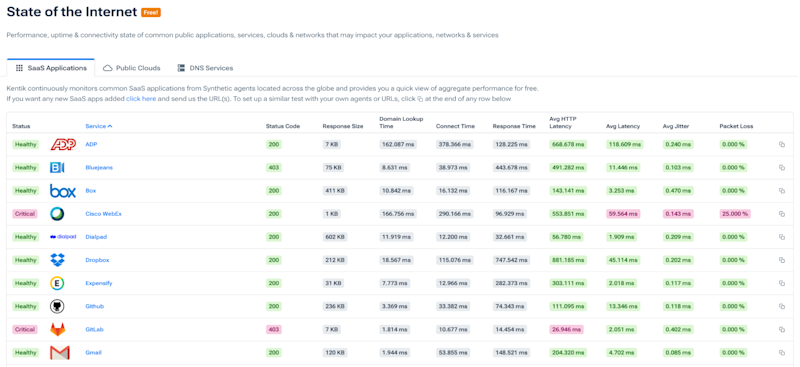
Notice in the image above that we’re reporting on the HTTP status code, response size, domain lookup time, connection time, response time, HTTP latency, network latency, jitter, and packet loss.
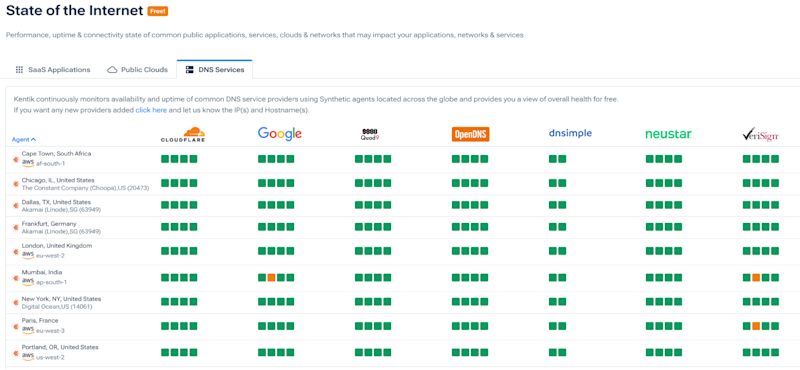
Additionally, we monitor the major cloud providers, such as AWS and Azure, from multiple vantage points. And since DNS plays a critical role in an end user’s interaction with an application over the internet, we also track public DNS services looking at both connectivity and tracking the actual name resolution times.
How to troubleshoot a slow SaaS application
To troubleshoot the performance of a specific SaaS application for your end users in a particular location, we can deploy private test agents in that branch office or even in a home network to capture metrics from that location programmatically.
For example, to monitor Microsoft 365 performance from a branch office, we can deploy test agents on-premises at that location. We can then use the results of those tests in real-time, or better yet, run them continuously to collect information over time. That means we can troubleshoot an issue as it’s happening, but we can also go back in time in our data to see what was happening when end users experienced a problem.
Scenario: Monitoring Microsoft 365
Imagine Microsoft 365 feels very slow to the end users in our upstate New York branch office. This is an essential suite of productivity applications for our end users, so we monitor programmatically and tie this to our alerting systems.
For our example, I’ve set up tests to monitor Microsoft 365 (among other SaaS apps), and I’ve set up tests to monitor several on-prem devices like the gateway, office router, and an on-prem wireless controller.
For this scenario, we received trouble tickets that our end users couldn’t log into Microsoft 365 earlier in the day for about an hour. Sometimes the login was slow and failed, and sometimes the login page itself wouldn’t load at all.
Kentik integrates with most ticketing and alerting systems, so real-time alerts generated by the platform can be emailed, part of a ChatOps workflow, or sent to whatever ticketing system you prefer, such as ServiceNow.
The workflow
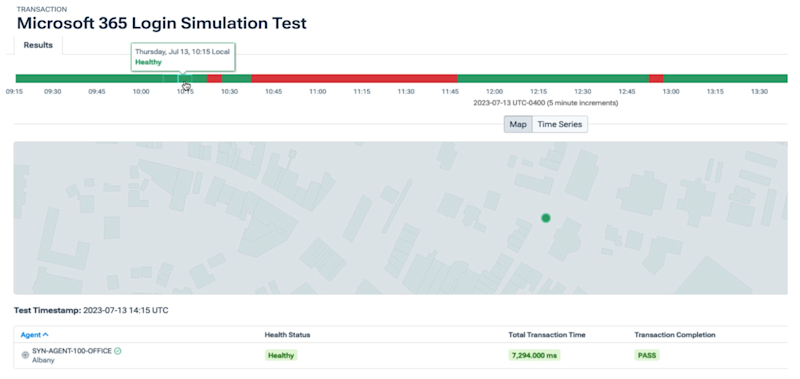
We can start by filtering tests to look at only Microsoft 365. Since logins are failing, starting with our login simulation test makes sense. This is a synthetic transaction monitor that uses a built-in script to interact with an application and capture the overall transaction time and all its individual components. In our demo example, the test logs into Microsoft 365 to track how long it takes to go through the process until I get all our apps like PowerPoint, Word, etc.
In the image below, notice that when we look back over the past six hours, we see that the test was reporting as PASS before and after that one hour when logins were failing. Also, notice that when the test passes, the total transaction time is around seven to eight seconds which the system established as the average time it takes for the script to complete successfully.
Notice in the image below that during the period users were experiencing issues, the total transaction time spikes to over 20 seconds, which we know is causing the test to fail by looking at the indicator that says transaction timeout. This indicates something is slowing everything down and causing a timeout which is exactly what our end users reported.
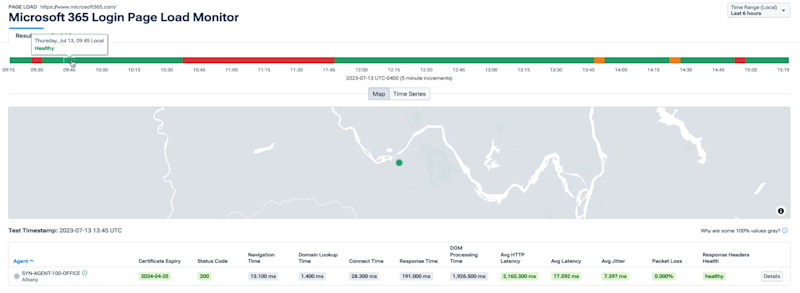
We can also analyze the login page loading by looking at our page load test. Below, notice that when things are working fine, we see a 200 status code, navigation time, and domain lookup time are very low. Our average HTTP latency is around a second and a half, which is normal. Our average latency, which represents the connection time, or in other words, network latency, is around 15 or 16 milliseconds. These all indicate good performance.
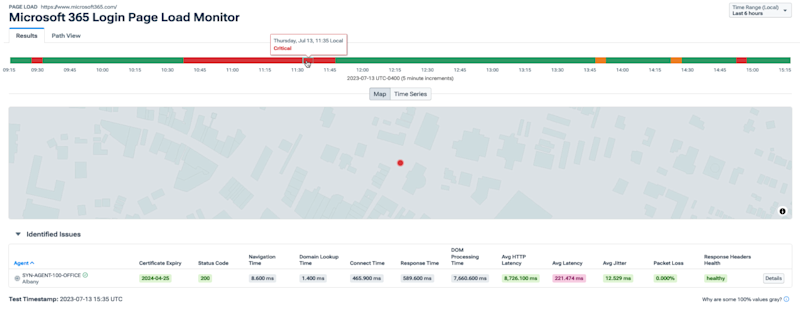
Next, in the screenshot below, take a closer look at the time period in which users reported issues. The navigation time and domain lookup time look ok, suggesting this is likely not a DNS problem. However, notice that the HTTP latency spiked significantly. This would certainly affect application performance and an end-user’s experience. Also, see that the average latency, which, remember, is network related, spiked as well, suggesting that there is possibly a network issue.
Analyzing page load test results
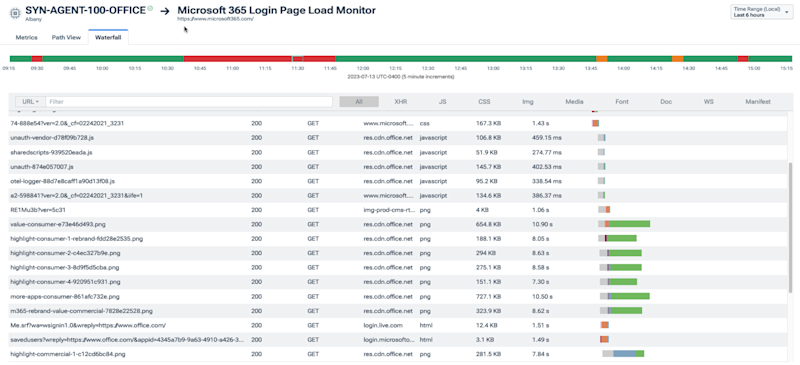
To analyze the individual components of the page load, we can look at the Waterfall breakdown (below). In our scenario, no one file or element stands out as the culprit, but we do see that many files are taking a very long time — several seconds — to queue and ultimately send. Clearly, something is slowing the actual transmission of data, and it doesn‘t seem to be any particular corrupt file or a DNS problem.
Since we now suspect this is a network issue, let’s look at the local network resources to see if anything is causing or reporting latency at our locally connected devices.
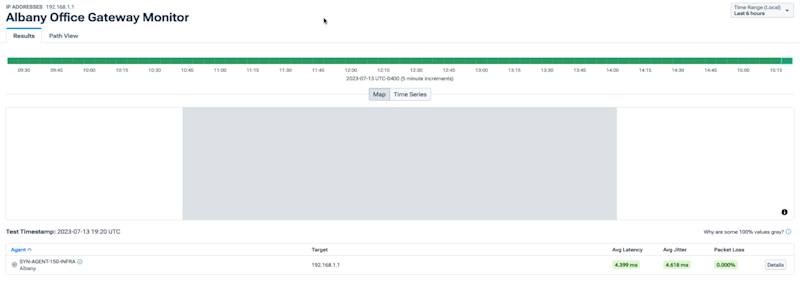
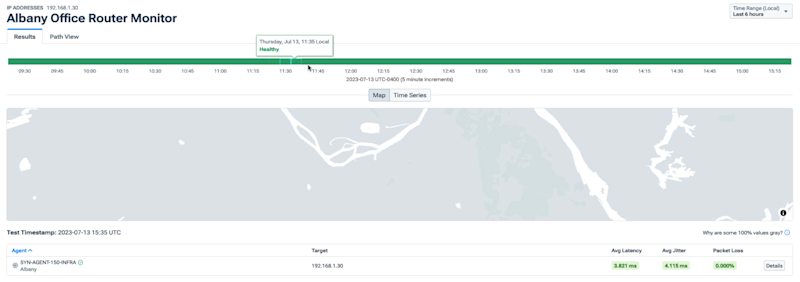
The following screenshots show that both the gateway device and our local office router report no latency, jitter, or packet loss problems during that one hour. This indicated that the network problem must not be on my local network.
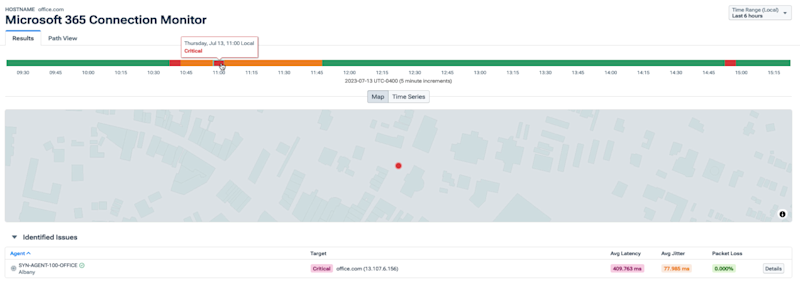
We can also monitor the connection to a SaaS app over the public internet using the network connection test, either by IP address or hostname. In our scenario, we use hostname because Microsoft uses a variety of IPs for connectivity.
Looking back at that one hour, we can see in the graphic below that there was an apparent and dramatic increase in latency which went away at the same time our end-users reported the login problem went away.
This is helpful, but to figure out exactly where the latency is happening, we can look at the path view generated using traceroute, or more specifically, Paris traceroute. In the next image, notice that there’s network latency with our upstream provider during that period, which just happens to go away right around the time the Microsoft 365 performance problems go away.
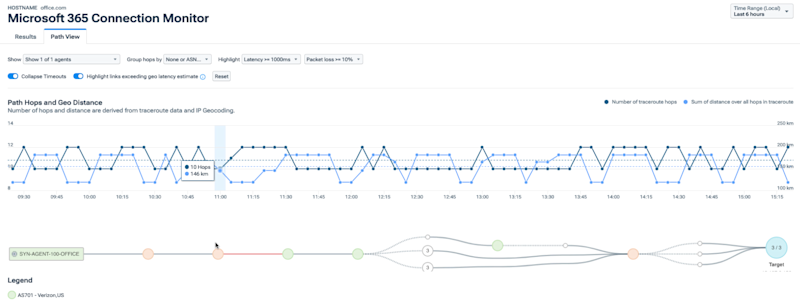
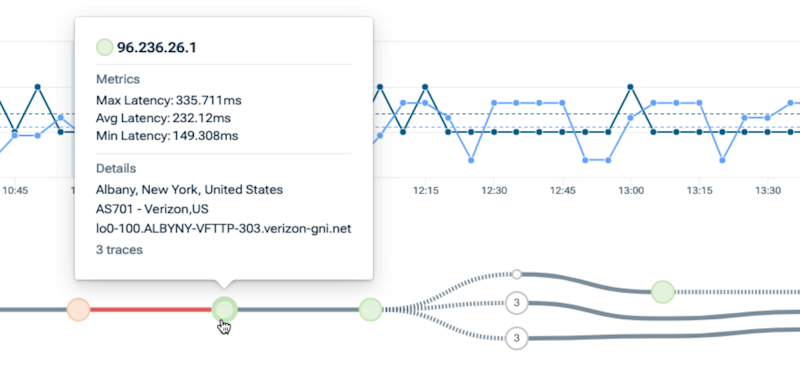
With Kentik, we were able to investigate a slow SaaS application both from a global perspective using the State of the Internet and also from a regional perspective with custom performance monitoring from one of our regional branch offices. We identified that there was no local network problem, no DNS problem, and no individual file or web page element that slowed things down on its own. Still, there was significant latency in at least one hop upstream from our local last-mile provider.
Video: Microsoft 365 troubleshooting
Follow along with me as I walk through the troubleshooting steps outlined above in this short video:
To learn more about Kentik and how we can help you monitor your SaaS applications, request a demo or start a free trial today.
