


Summary
Kentik Detect now incorporates IP reputation data from Spamhaus, enabling users to identify infected or compromised hosts. In this post we look at the types of threat feed information we use from Spamhaus, and then dive into how to use that information to reveal problem hosts on an ad hoc basis, to generate scheduled reports about infections, and to set up alerting when your network is found to have carried compromised traffic.
New Feature Uses Threat Feeds to Reveal Compromised Hosts
In our previous post, on CDN Attribution, we mentioned that our development team has been hard at work enabling new ways to visualize and investigate network traffic patterns in Kentik Detect®. One of these new features is the ability to find traffic from infected or compromised hosts. What makes this possible is the fact that we now enrich flow records (NetFlow, sFlow, IPFIX, etc.) in Kentik Detect with IP reputation data from our friends at Spamhaus. Based on this information, we’ve exposed two new dimensions that you can use for group-by or filtering: Bot Net CC and Threat List Host. In this post, we’ll walk through a use case for the Bot Net CC dimension, but first let’s look deeper into the threat feed information from Spamhaus and the corresponding dimensions in Kentik Detect:
- Bot Net CC: This dimension is based on a list of IPs where botnet command and control (CC) servers are known to be running (or were running in the past). By looking for IPs that are communicating with these CC IPs you can identify hosts (or subscribers) in your network that are potentially infected with malware or otherwise participating in botnet activity.
- Threat List Host: This dimension includes a broader set of potentially malicious IPs on the Internet. The IPs are identified as malware distribution points, phishing websites, spam sources, etc. When this column is populated in Kentik Detect’s datastore we identify the specific type of threat associated with the IP. This dimension can help hosting providers identify IPs in their own network that are “doing bad stuff,” but it can also enable any network operator to identify client IPs that are talking to remote IPs on the list.
Querying for Bots
To illustrate the use of Bot Net CC, let’s go back to the fictional enterprise from our last post, Pear, Inc. The savvy reader is probably already aware that a popular method of Distributed Denial of Service (DDoS) attacks is to infect hosts with a virus. These hosts then communicate with a Command and Control (C&C) server that tells them where to send attack traffic. Pear’s IT Security department wants to see if they have any hosts on their network that have been compromised and are communicating with a C&C server, thereby participating in a botnet.

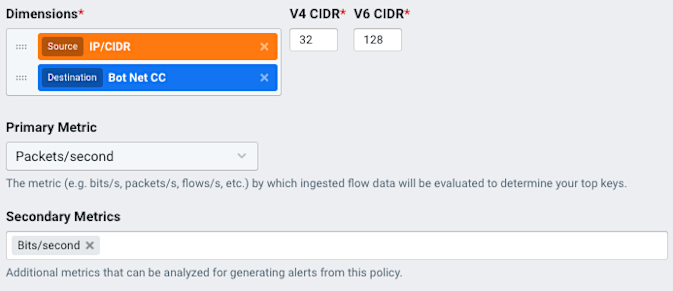
We can check this by building a query in the sidebar panes of the Data Explorer (Data Explorer » Explorer View). Using the Group By Dimensions selector in the Query pane, we set the query to look at two dimensions that, when combined (shown at right), will give the list of compromised hosts on our network: Source IP/CIDR and Destination Bot Net CC. Also in the sidebar (for details on sidebar settings, refer to the Sidebar Panes article in our Knowledge Base), we set the Time pane to look back at the last hour, and in the Devices pane we choose All so that we can look at our entire network. We’ll also build a filter in the Filtering pane (shown at right) that will ignore our normal network traffic and look only at botnet traffic:

- Click anywhere in the pane to open the Filtering Options dialog.
- In the Ad-Hoc Filter Groups pane, click Add Filter Group.
- Change “Include” to “Exclude”.
- Change the dimension to Destination Bot Net CC.
- Click Save Changes.
After our query configuration is complete, we click on the Run Query button at the top of the sidebar. If there were four infected hosts then the query would return a graph that looks similar to the below. Based on these results, the IT Security staff at Pear would know which hosts to examine for botnet malware, so it can be identified and removed.

Pear could take this a step further by running this query as a scheduled report that is emailed to Kentik Detect users within the Pear organization that are assigned to the report as subscribers. Reports are based on dashboards. The following steps show how to save the query to a new dashboard and then set up a weekly report:

- From the drop-down View Options menu at the upper right of the Data Explorer display area (above the graph), choose Add to Dashboard » New Dashboard. The Add Dashboard dialog will open.
- Enter “Bot Traffic” in the Name field, then click Add Dashboard in the lower right corner. The Add Panel dialog will open.
- Leave the dialog settings at defaults (the name of the panel will be “Top Source IP/CIDR, Dest Bot Net CC by Average bits/s”) and click the Add Panel button. You’ll be taken to the new “Bot Traffic” dashboard.
- Click Admin in the main portal navbar, then choose the Subscriptions page from the sidebar.
- Click the Add Subscription button at upper right to open the Add Subscription dialog.
- Fill out the subscription settings as shown in the screenshot above, then click the Add Subscription button.
If the Pear IT Security department were to follow the steps above, they would receive an email every Monday with a list of infected hosts covering the previous seven days.
Proactive Alerting for Compromised Hosts
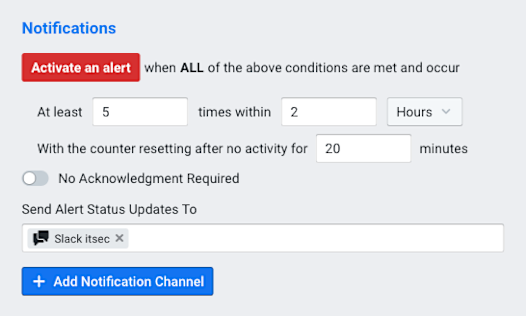
Getting a scheduled report is nice, but it would be even more helpful to be notified automatically whenever an infected host is found. By creating an alert policy in Kentik Detect’s alerting system, Pear’s IT department could get a Slack notification in their #itsec channel any time a new host starts talking to a C&C server. To do this, we would choose Alerting from the main portal navbar, then click Policies in the sidebar. On the resulting Policies page we click the Add Policy button. In the resulting Add Alert Policy dialog, we make settings on the following tabs:
- General Settings tab: We give our policy a name and change the drop-down Policy Dashboard menu to Bot Traffic, the dashboard we created in the previous section. Note that we leave Silent Mode enabled so that the alert does not activate while the alerting system is determining what’s normal (the baseline). It’s also nice to add a description so that everyone in the organization can see at a glance what this policy is for.

-
Dataset tab: In the Data Funneling pane we click anywhere in the Dimensions selector to add the same dimensions we used in our original query: Source IP/CIDR and Destination Bot Net CC. We’ll also click in the Secondary Metrics selector and choose Bits/second.

-
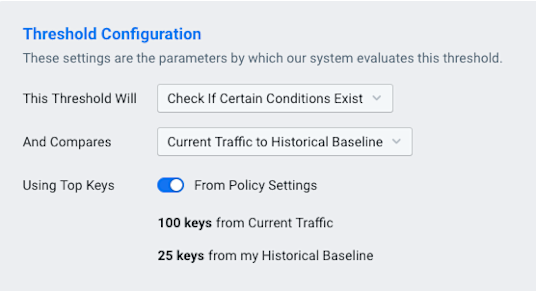
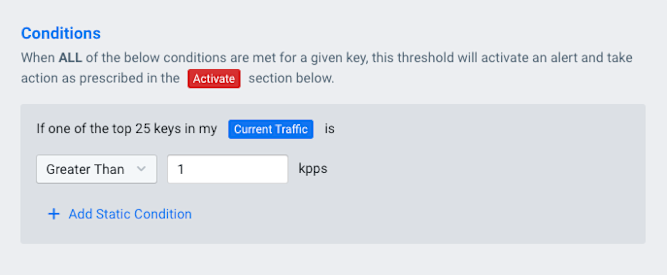
Alert Thresholds tab: We choose a criticality level (e.g. Major) from the list at left, then set the switch at right to Enabled, which reveals a number of panes containing controls. In the Threshold Configuration pane, we choose Check If Certain Conditions Exist from the drop-down This Threshold Will menu. Leave the other settings at their defaults.
-
Historical Baseline tab: Leave default settings.


Once all of the required fields have been specified there will be a green check mark on all of the tabs. When we click on the Add Alert Policy button, the policy will begin in Silent Mode, studying the normal patterns of traffic. After the Silent Mode end date, the IT Security department will get a Slack notification every time a new host starts talking to a botnet C&C server. (For more information on setting up policies, you can refer to our Knowledge Base article or our blog post on Configuring Alert Policies.)
Summary
This is just a taste of the ways that Kentik Detect’s new Threat Feeds information can enable your company to see compromised hosts on their network that they’ve never been able to see before. This insight can be used for both proactive monitoring and data forensics to protect the company’s infrastructure. If you are an existing customer and would like help setting up or using this feature, get in touch with our Kentik support team. If you are not already a Kentik customer, it’s easy to get started: request a demo or sign up for a free trial.