Kentik brings network observability to New Relic
The app is broken … is it the network? The infrastructure? The code? When an application is suddenly not reachable and/or not performing, the troubleshooting teams responsible for fixing it (ITOps, DevOps, NetOps, CloudOps, SREs) have been challenged with determining this answer. In the best case, figuring out where to troubleshoot takes too long. In the worst case, the different teams involved add finger pointing and blame to the problem — with an extra side of cranky when this happens at 2am.
This challenge is solved by adding Kentik’s network observability data to New Relic’s application experience telemetry right inside the New Relic One observability platform. Teams are united at shared dashboards and data sets where they can see their critical network data right alongside their application and infrastructure data.
Observability to reduce MTTR
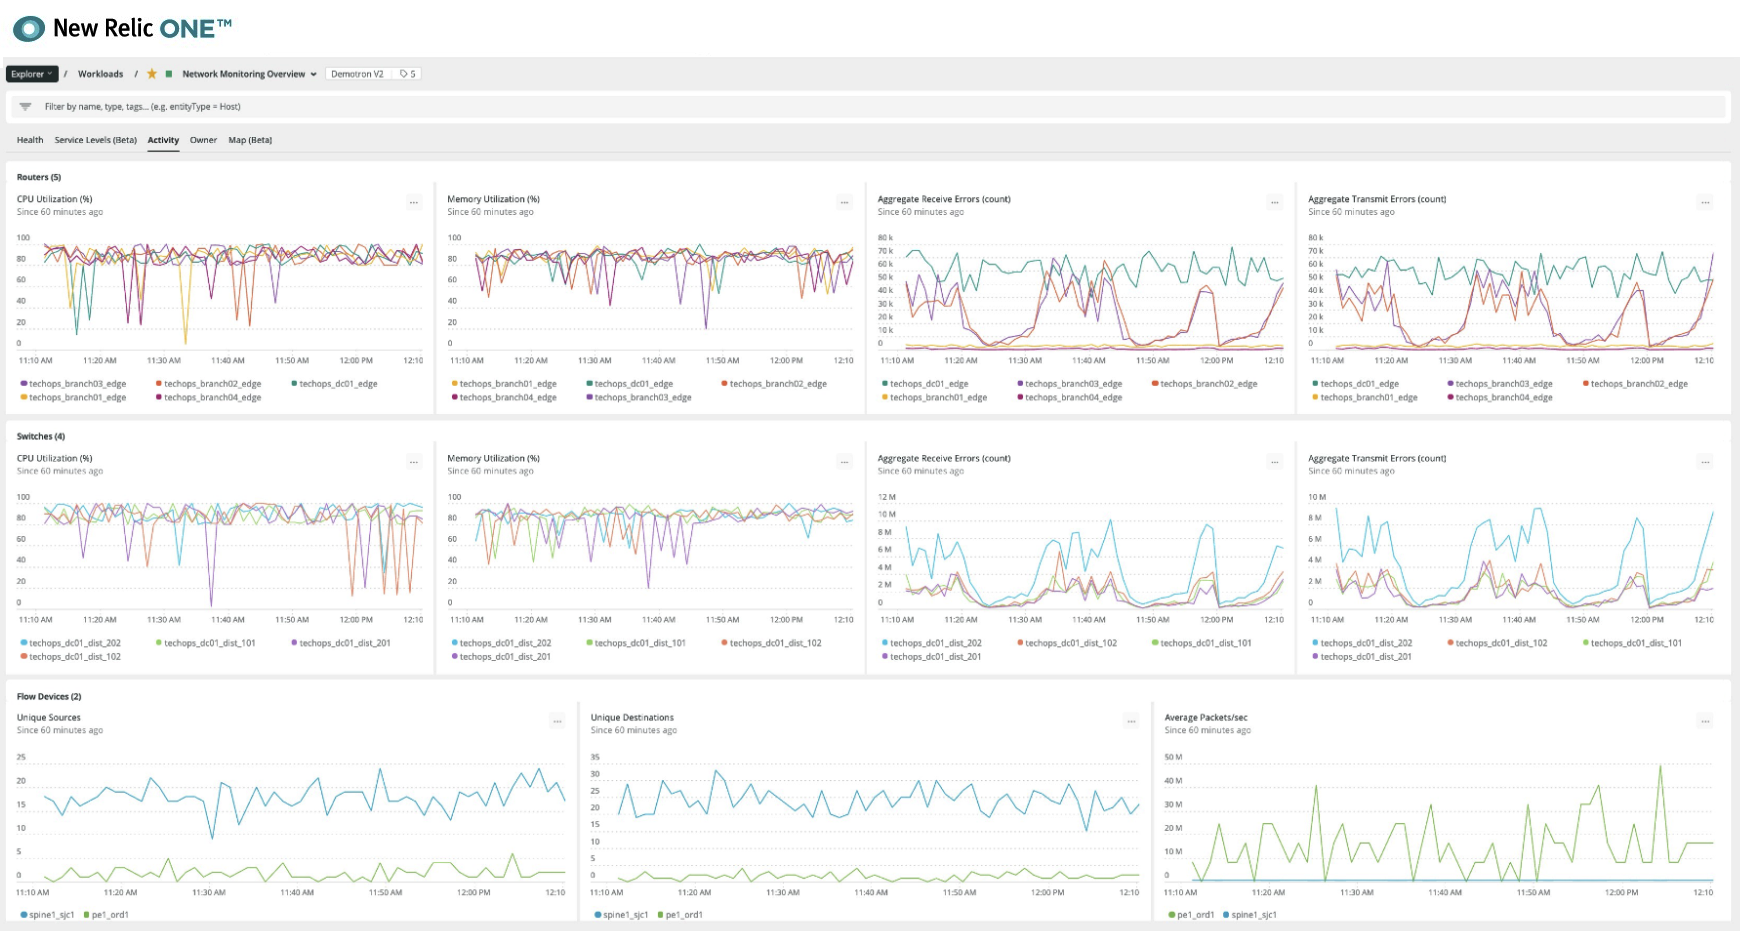
Is it the network, the application, or something else? Guessing what’s behind a performance or outage issue takes time. A lack of network context with application and infrastructure performance data is a blind spot that not only causes delays, but also adds unnecessary friction between NetOps and DevOps teams. By sending network data directly into the New Relic One platform, both teams have the same data they need, all in one place, to make fast troubleshooting decisions and reduce MTTR.
Synthetics to predict and prevent issues
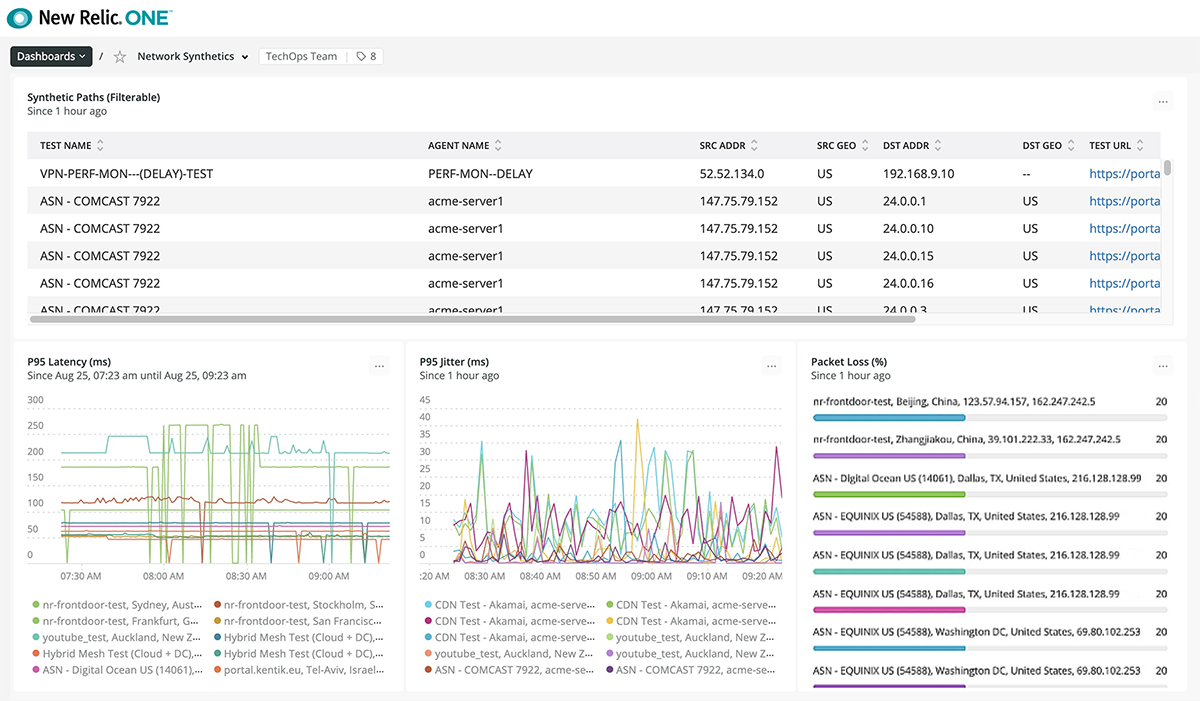
Network synthetic testing from Kentik combined with New Relic’s application synthetic testing helps predict application performance issues before users are affected. Ops teams can proactively diagnose and prevent these events before they have business impact. The powerful duo of network and application synthetic testing provides a complete view of availability and reachability.

Key benefits
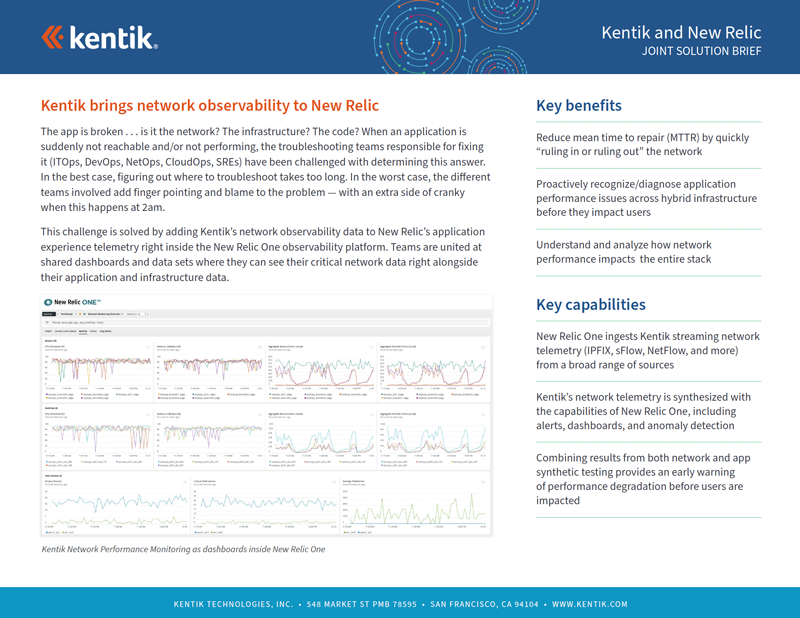
- Reduce mean time to repair (MTTR) by quickly “ruling in or ruling out” the network
- Proactively recognize/diagnose application performance issues across hybrid infrastructure before they impact users
- Understand and analyze how network performance impacts the entire stack
Key capabilities
- New Relic One ingests Kentik streaming network telemetry (IPFIX, sFlow, NetFlow, and more) from a broad range of sources
- Kentik’s network telemetry is synthesized with the capabilities of New Relic One, including alerts, dashboards, and anomaly detection
- Combining results from both network and app synthetic testing provides an early warning of performance degradation before users are impacted
Platform
Solutions
- Reduce Cloud Spend
- Migrate To and From Any Cloud
- Improve Cloud Performance
- Optimize Enterprise WAN
- Network Performance Monitoring
- Deliver Exceptional Digital Experiences
- Detect and Mitigate DDoS
- Harden Network Policy Management
- Investigate Security Incidents
- Visualize All Cloud and Network Traffic
- Troubleshoot Any Network
- Understand Internet Performance
- Optimize Data Center Networks
- Consolidate Legacy Tools
- Optimize Peering and Transit
- Plan Network Capacity
- Reduce Network Spend
- Grow Subscriber Revenue
