Overview
In today’s commoditized infrastructure services marketplace, service providers and MSPs must continuously add value to their connectivity, bandwidth, and remote services to maintain market competitiveness. Network observability and analytics have become an important source for differentiation and new business opportunities, as well as an important foundation for transparency, validation, and trust. My Kentik Portal lifts the hurdles of in-house development and costly deployment and maintenance providing instant time-to-market.
My Kentik Portal Enables More Business
My Kentik Portal (MKP) is a flexible, user-friendly, multi-tenant white-label network observability cloud platform that enables Kentik customers to market network analytics on top of their existing services. One-size-fits-all rarely works to deliver value through data; MKP’s analytics data can be customized to serve customers’ unique requirements. Kentik customers can use MKP to monetize their network data to deliver network observability and analytics services, and value in multiple ways, including:
- Benchmark against competition
- Validate SLAs
- Track KPIs (e.g. uptime and MTTR)
- Analyze security incidents
- Optimize cost and performance
- Plan capacity
- Enable network analytics self-service
- Reduce support load by empowering tenants to observe their networks
- Identify opportunities for new and targeted services
My Kentik Portal Serves Landlords and Their Tenants
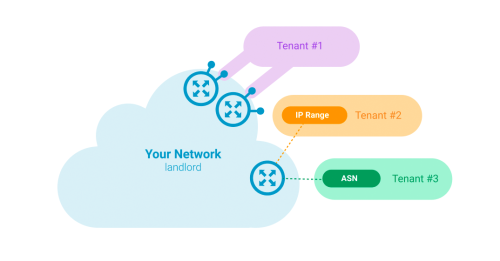
The landlord interface allows landlords to provision and configure tenants. It is also the place where landlords will configure general attributes of the tenant interface such as branding, or the URL at which the latter is available.
The tenant interface is a standalone branded portal from which tenants are able to consume the analytics and alerts configured for them by landlords.
Slice and Package to Fit Your Customer Base
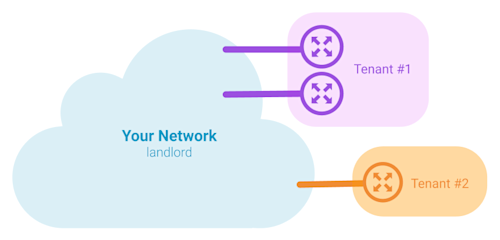
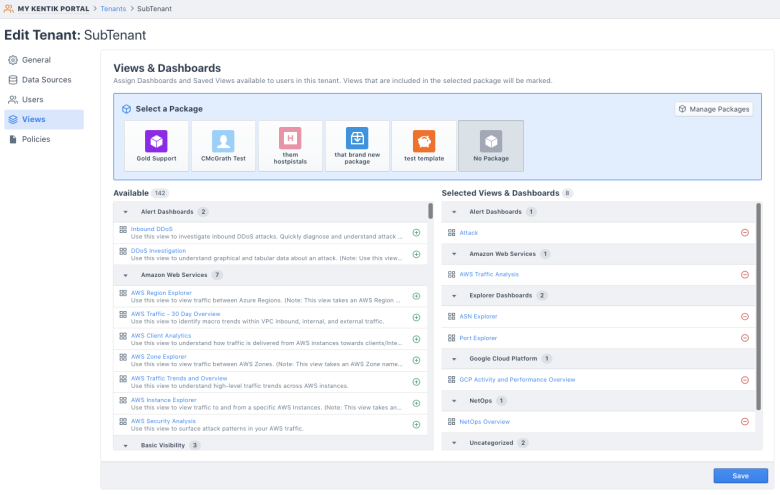
MSPs can offer curated network observability packages and analytics based on the tenants’ infrastructure data.
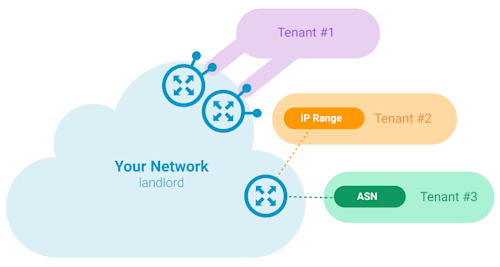
Service providers can offer curated network observability and analytics based on the tenants’ traffic data.
How to Start with My Kentik Portal
Starting with MKP is effortless. MKP is included in Kentik Pro for up to 50 tenants and in Premium for up to 100 tenants. Customers can find My Kentik Portal in the menu bar, select it, and start registering their tenants. Customers can also request an “Advanced My Kentik Portal” add-on, which lifts all tenant caps (i.e. no limit to the number of tenants) and removes Kentik branding (“Powered by Kentik” mentions).
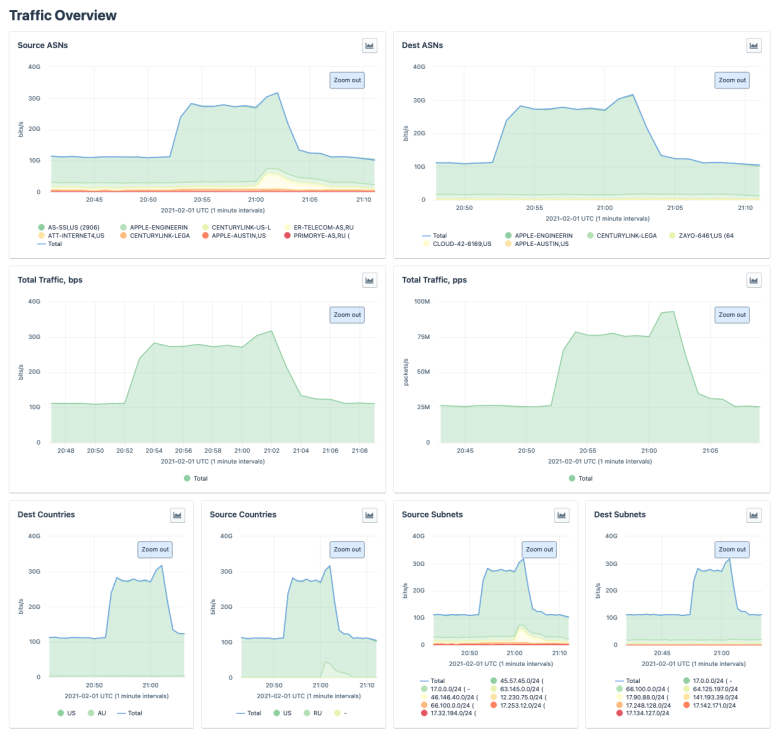
Key Features and Benefits
Out-of-the-Box: Get instant time to market.
- Start without any in-house development. Ready-to-use, powerful, and user-friendly query and insights engine for network data analytics over hundreds of metrics and context dimensions.
Tenant Analytics Self-service: Achieve in-product organic sales growth.
- Offer a display menu of network analytics packages that tenants can themselves add to their service.
OTT Visibility: Get margins back.
- Reveal over-the-top streaming content consumption, and build premium service packages to share these detailed insights with tenants.
Branding Opportunities: Keep brand awareness.
- Provide a branded experience that includes logo, notification emails, a support URL, and email information.
DDoS Defense: Provide protection and intelligence against attacks.
- Offer comprehensive DDoS protection with detection, mitigation, incident analysis, and forensics.
Tenant Data Protection: Build services on top of security best practices.
- Ensure tight security posture with tenant data partitions secured in the data-store.
Alert and Notification Integration: Offer seamless response team experience.
- Integrate with tenants’ choice of notification channels: PagerDuty, ServiceNow, OpsGenie, Slack, Syslog, and JSON webhooks.
API-powered Workflows: Achieve scalable operations.
- Automate ordering and provisioning workflows using APIs for customer onboarding and user registration.
Secure Single Sign-on: Provide seamless authentication experience.
- Stay safe and user friendly with SAML2 SSO and 2-factor tenant authentication.
Data Partition Flexibility: Accommodate customer uniqueness with precise data access.
- Serve unique customers partitioning network observability data by site, device, interface, ASN, CIDRs, and custom dimensions for complex scenarios.
Integrated into the Kentik Platform: Provide network observability with SaaS quality.
- Take full advantage of Kentik’s scalable, multi-source data ingestion and enrichment, alerting and insights, dashboarding, and guided workflows.
Solutions
- Reduce Cloud Spend
- Migrate To and From Any Cloud
- Improve Cloud Performance
- Optimize Enterprise WAN
- Network Performance Monitoring
- Deliver Exceptional Digital Experiences
- Detect and Mitigate DDoS
- Harden Zero-Trust Cloud Network Policy
- Investigate Security Incidents
- Visualize All Cloud and Network Traffic
- Troubleshoot Any Network
- Understand Internet Performance
- Optimize Data Center Networks
- Consolidate Legacy Tools
- Optimize Peering and Transit
- Plan Network Capacity
- Grow Subscriber Revenue
