Building and Operating Networks: Assuring What Matters


Summary
In part 1 of this blog series, Kentik director of technical product management Greg Villain discusses what matters with network interconnection and their cost considerations. Greg examines the different types of interconnections, necessary operational measures, and applicable elements of network observability.
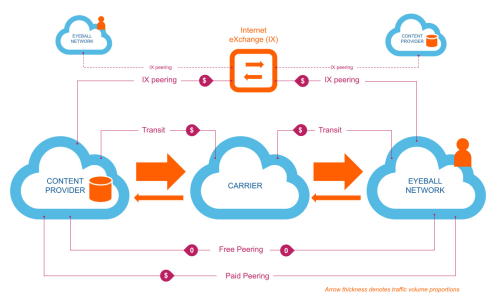
Network Interconnection: Part 1 of a new series Building and Operating Networks
Key Attributes of a Network
Networks come in all shapes and sizes, and they all have different purposes. Whether you’re a network service provider or an enterprise running your own hybrid, global network, each network scenario has a unique set of constraints and optimal operating conditions.
At Kentik, we pride ourselves as a pioneer and leader in network observability. Our platform caters to both standard and custom use cases depending on the unique needs of our customers.
This blog examines several different network interconnection models, essential considerations for each, and how “what matters” can be optimized with network observability.
The Basic Dynamics of Network Interconnection
First, let’s lay out a few simple principles that govern the way networks are interconnected.
As trivial as it seems, no network originates and terminates traffic within itself as a closed environment. Hence the importance of the name “internet,” meaning between and among networks.
Of course, there are corner cases, such as residential ISPs that offer IPTV services living within their own boundaries. But for this blog, let’s set aside any corner cases.
For a given network, traffic sourced from within the network is considered free. However, content sourced from outside needs to be carried over to the eyeball network’s (defined below) subscribers in the local loop at a cost.
Handovers are configured on the edge of a network, at locations where multiple networks meet and are usually described as interconnects. These interconnects have a cost associated with them (explicit or hidden). These costs are directly related to the amount of traffic flowing through them.
There is a hierarchy of interconnection methods based on technical and financial attributes.
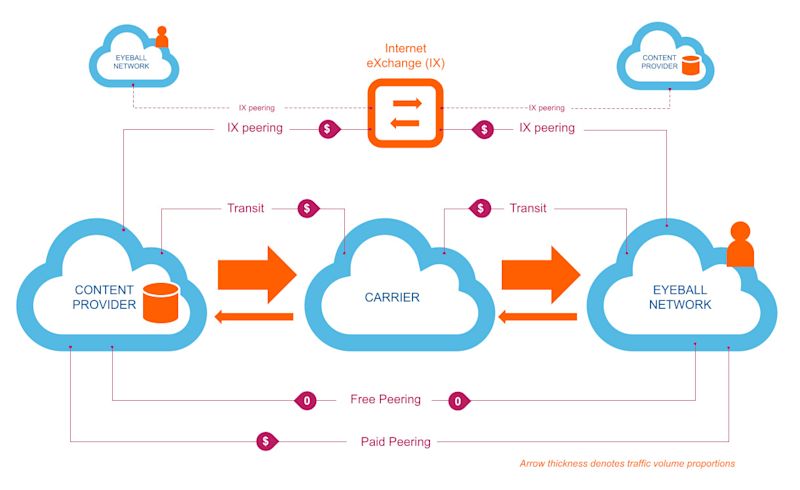
Let’s summarize the different types of interconnects:
- Transit is a default path for any traffic that comes and goes from outside of the network. Often referred to as “full routes,” it means that these connections hold the entire reachability for any and all destinations on the internet.
- Peering is a supplemental, narrower set of sources or destinations to go in or out of the network to a specific source or destination network. They come in multiple flavors:
- Free peering: the relationship with the interconnected network is not metered nor paid, relying on a mutual interest for both parties interconnecting
- Paid peering: one of the two interconnecting networks pays the other to interconnect, usually based on the amount of traffic flowing between them in either direction
- IX (Internet eXchange), also known as “peering fabrics.” Peering fabrics are facilities where networks can meet to exchange traffic on a shared switching platform. An IX charges member networks for access ports but offers the benefit of the availability of multiple potential peering partners through the same infrastructure.
Given these different types, defining a sensible interconnection policy is not a trivial task. Network operators need to track multiple metrics, but we’ll come back to this later.
Different Types of Networks
Let’s start with a simple categorization of the types of networks out there. This basic classification will help us to understand the underlying goals of each.
Eyeball Networks
This term refers to residential or enterprise ISPs. A simpler description is that these networks have users directly attached to them who consume content traffic (hence “eyeball”).

Here are some of main properties of eyeball networks:
- Their traffic profile is mostly INBOUND — users consume content pulled from outside of the network boundary. In other words, their traffic ratio is 1:N, where N>>1.
- Their footprint is mostly local (country specific in most cases). They are not in the business of cross-continental telecommunications.
- From a routing perspective, being heavy inbound, a big challenge for eyeball networks is the difficulty to influence inbound traffic routing. BGP really isn’t tailored for this.
- Subscriber satisfaction in an eyeball network is derived mostly from “download” performance, i.e., the speed at which they can obtain their favorite content.
- Depending on the locale, the eyeball network ISP may be in a very competitive market where an internet subscription is considered a commodity. This creates a difficult challenge for these operators, needing to balance performance and cost.
A good example of an eyeball network is unbundling of the copper local loop in some countries where the incumbent is legally obligated to offer other ISPs the possibility to rent the last mile copper pair to deliver DSL-based internet access. In these situations, this legal aspect drove internet plans prices down and made them very competitive markets.
Content Networks
Content networks are the reverse of the eyeball networks: these networks originate the majority of traffic, destined to be consumed by end-users.

Content networks’ main attributes are:
- Their traffic profile is mostly OUTBOUND — they push content to users who are not located within their network. In other words, their traffic ratio is 1:N, where N>>1.
- Typical examples of content networks are gaming companies, social networks, hosting providers, content delivery networks (CDNs).
- Their footprint is varied and dependent on the monetization of their content in multiple locales.
- From a routing perspective, their life is much easier than eyeballs since BGP makes it trivial to select exit points for traffic.
- Financial dynamics can be diverse: subscription-based, advertisements, revenue sharing.
- One of their main objectives is to achieve high performance towards consumers, even while the destination consumer may be multiple networks away. Obviously, the fewer the hops, the better. Complexities are usually proportional to the geographical spread of their user base, as maintaining maximum performance across virtually every ISP in every locale is unrealistic.
Carrier Networks
These networks are the providers of all the other networks: in essence, they transport packets from content networks to eyeball networks across the globe and are “the backbone of the internet.”

Here are their main characteristics:
- Carriers make money by transporting content traffic to eyeball users, i.e., by selling traffic capacity to/from any destination/source anywhere in the world. In other words, their traffic ratio is considered 1:1.
- Their main challenge is to remain attractive to both content providers and eyeball networks: it means they need to maintain balanced demand on both sides of the equation. They need to have enough eyeballs connected to attract content providers and enough content providers to attract eyeballs.
- Most carriers don’t pay for traffic. Selling access to traffic is the core business they are in. In exchange, they offer a global footprint and connect content to eyeballs over long distances. A carrier without any paid interconnect is usually named a tier 1.
- Carriers operate in a largely commoditized industry. Their margins are usually low, i.e. their success depends on financial efficiency.
What Dimensions Matter?
There’s an interesting parallel to be drawn between building and operating a network and engineering a distributed datastore. Some may already be familiar with the CAP Theorem, formulated by Eric Brewer. In this theorem, C stands for Consistency, A for Availability, and P for Partition Tolerance — it lays out this simple rule:
“When building a distributed datastore, you can only select two of these three as design constraints.”
On the consumption side, when selecting a datastore for a given task, one must evaluate which of these two is more important for the underlying storage task and choose the datastore that fits accordingly.
The dynamic is very similar for each network. As listed in the quick shorthand summary in the previous section, each network comes with its own challenges, but building and operating a network always requires an understanding and observation of three well-known dimensions:
- Cost
- Performance
- Reliability
While less drastic than the CAP theorem (you can effectively get a variable amount of the three without having to exclude one completely), the art of the game for any network is to be able to make the right decisions, according to their constraints in each of these categories.
Since we’ve determined that Interconnection is one of the defining elements of any network, it only makes sense to leverage these to evaluate the constraints of any interconnection.
Cost
Generally, a transit interconnect is more expensive than peering on a cost per Mbps basis. More so, peering at an IX mutualizes the cost of interconnection over multiple peerable networks. Both require common locations and cross-connects that need to be factored into the eventual cost per Mbps.
Cost is an important factor for eyeball networks, as they usually operate in a competitive market.
To give the reader an idea: a pretty common plan in the US can be found for $40 for 100Mbps, which means $0.4/Mbps, without even considering the cost of labor and maintenance. This traffic cost needs to be put in perspective with the interconnection cost at the edge, more specifically, the cost of transit.
The diagram below illustrates the different modes of interconnection together with the associated money-flows that can take place between a variety of networks.

Performance
Performance relies among others on the number of hops to reach a specific destination. A blunt estimate is that performance decreases as the number of hops between a source and a destination increases.
With that in mind, a direct peering connection allows for content to go directly from the content provider to the subscriber. Additionally, the distance between the content and the subscriber is a crucial factor: because of the limits of the speed of light, the further the source from the destination, and the higher the latency.
These two aforementioned aspects are the key reasons behind the rise of content delivery networks in the early 2000s, whose value add is to both reduce the number of hops between content and consumer as well as the geographical distance across the broadest footprint possible. For a content provider with a user base across the world, performance to users becomes problematic because of the need to optimize for a large set of local eyeball networks.
Reliability
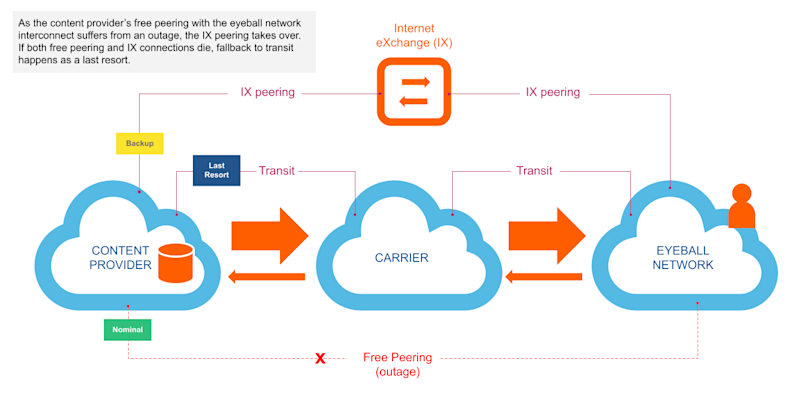
As a rule of thumb, the more available paths to choose from between a source and a destination, the more reliable the eventual service rendered between the two. For example, if the primary path fails, a backup path is immediately available.
With the diversity of paths comes additional costs, as multiplying logical and physical routes implies diversifying providers, i.e. multiplying the number of interconnecting interfaces towards these next or previous hops.
With a larger number of interfaces on the edge comes a sizable management cost overhead because of the additional number of moving pieces.
Network reliability is one of the areas most prone to the law of diminishing returns. Every additional path added inbound or outbound becomes increasingly costly and decreasingly beneficial. Some experts go as far as saying that reliability never being total; choosing carefully when not to be reliable is a key strategic consideration for a network operator.
The diagram below illustrates diverse paths between two given networks, and the associated failover modes (configuration dependent).

Enter Network Observability
We’ve established earlier that the top dimensions against which any network should benchmark itself are cost, performance and reliability. Given this, the underlying success on any network-reliant enterprise lies in its ability to do the following for any of these attributes:
- Measure
- Track
- Fine-tune
- Improve
- Plan
- Fix
In short, these are all the crucial activities that network observability can deliver.
Rightfully, the reader may ask, “It’s not like anything here is novel. Why does network observability brand itself as a novel concept?”
One of the answers to this question relates to the lack of a cohesive approach to the tasks of managing networking costs, performance and reliability, throughout the industry.
While network and infrastructure-heavy companies naturally structure themselves around functions (sales, network engineering, reliability engineering, software engineering, operations, support), they often suffer from the perennial organizational silos when the service they deliver demands horizontal attention across goals (cost, performance, reliability) and tasks (measure, track, tune, fix).
Some of the usual symptoms are:
- Absence/lack of shared, baselined metrics
- Absence/lack of shared best practices across teams
- Absence/lack of end to end performance measurements
- Loss of efficiency when information is required to cross silos
- Difficulty in mapping executive strategy into technical infrastructure plans
Network observability’s mandate is to bring down the boundaries between teams, tools and methodologies as it pertains to the network. Its ambition is to make it trivial to answer virtually any question about the network and easily understand the answers. Lastly, network observability streamlines the activity of building and running networks.
In the next blog post, we’ll discuss how Kentik instruments and supports tracking and planning of your connectivity costs.


