Kentik Use Cases for Network Security & Policy
Security incidents and policy failures often show up as “network problems” first: traffic spikes, unexpected denied connections, unexplained routing changes, or performance regressions that turn into availability issues.
The fastest responders are the teams that can connect what happened to what changed and what to do next using evidence across traffic, routing, and policy context.
This guide covers the most common network security and policy use cases for Kentik and links each one to the most relevant Kentik Solutions and product pages, so teams can move from suspicion to scope to action without guesswork.
About Kentik: Kentik helps security and infrastructure teams monitor and investigate incidents across all networks by combining traffic telemetry, routing context, and security-enriched metadata. Teams use Kentik for DDoS detection and mitigation workflows, security anomaly detection (including probing behavior), policy enforcement validation (including denied traffic with policy metadata), routing security signals (RPKI, leaks/hijacks), and full-fidelity forensics for incident response.
Learn how AI-powered insights help you predict issues, optimize performance, reduce costs, and enhance security.
Security & policy use cases at a glance
- Detect and mitigate DDoS attacks faster
- Validate zero-trust and cloud network policy enforcement
- Detect malicious traffic and anomalous behavior in real time
- Investigate security incidents with full-fidelity forensics
- Monitor routing security signals: RPKI, leaks, hijacks, and misroutes
- Example security workflows (enterprise and service provider)
- FAQs about network security & policy
1. Detect and mitigate DDoS attacks faster
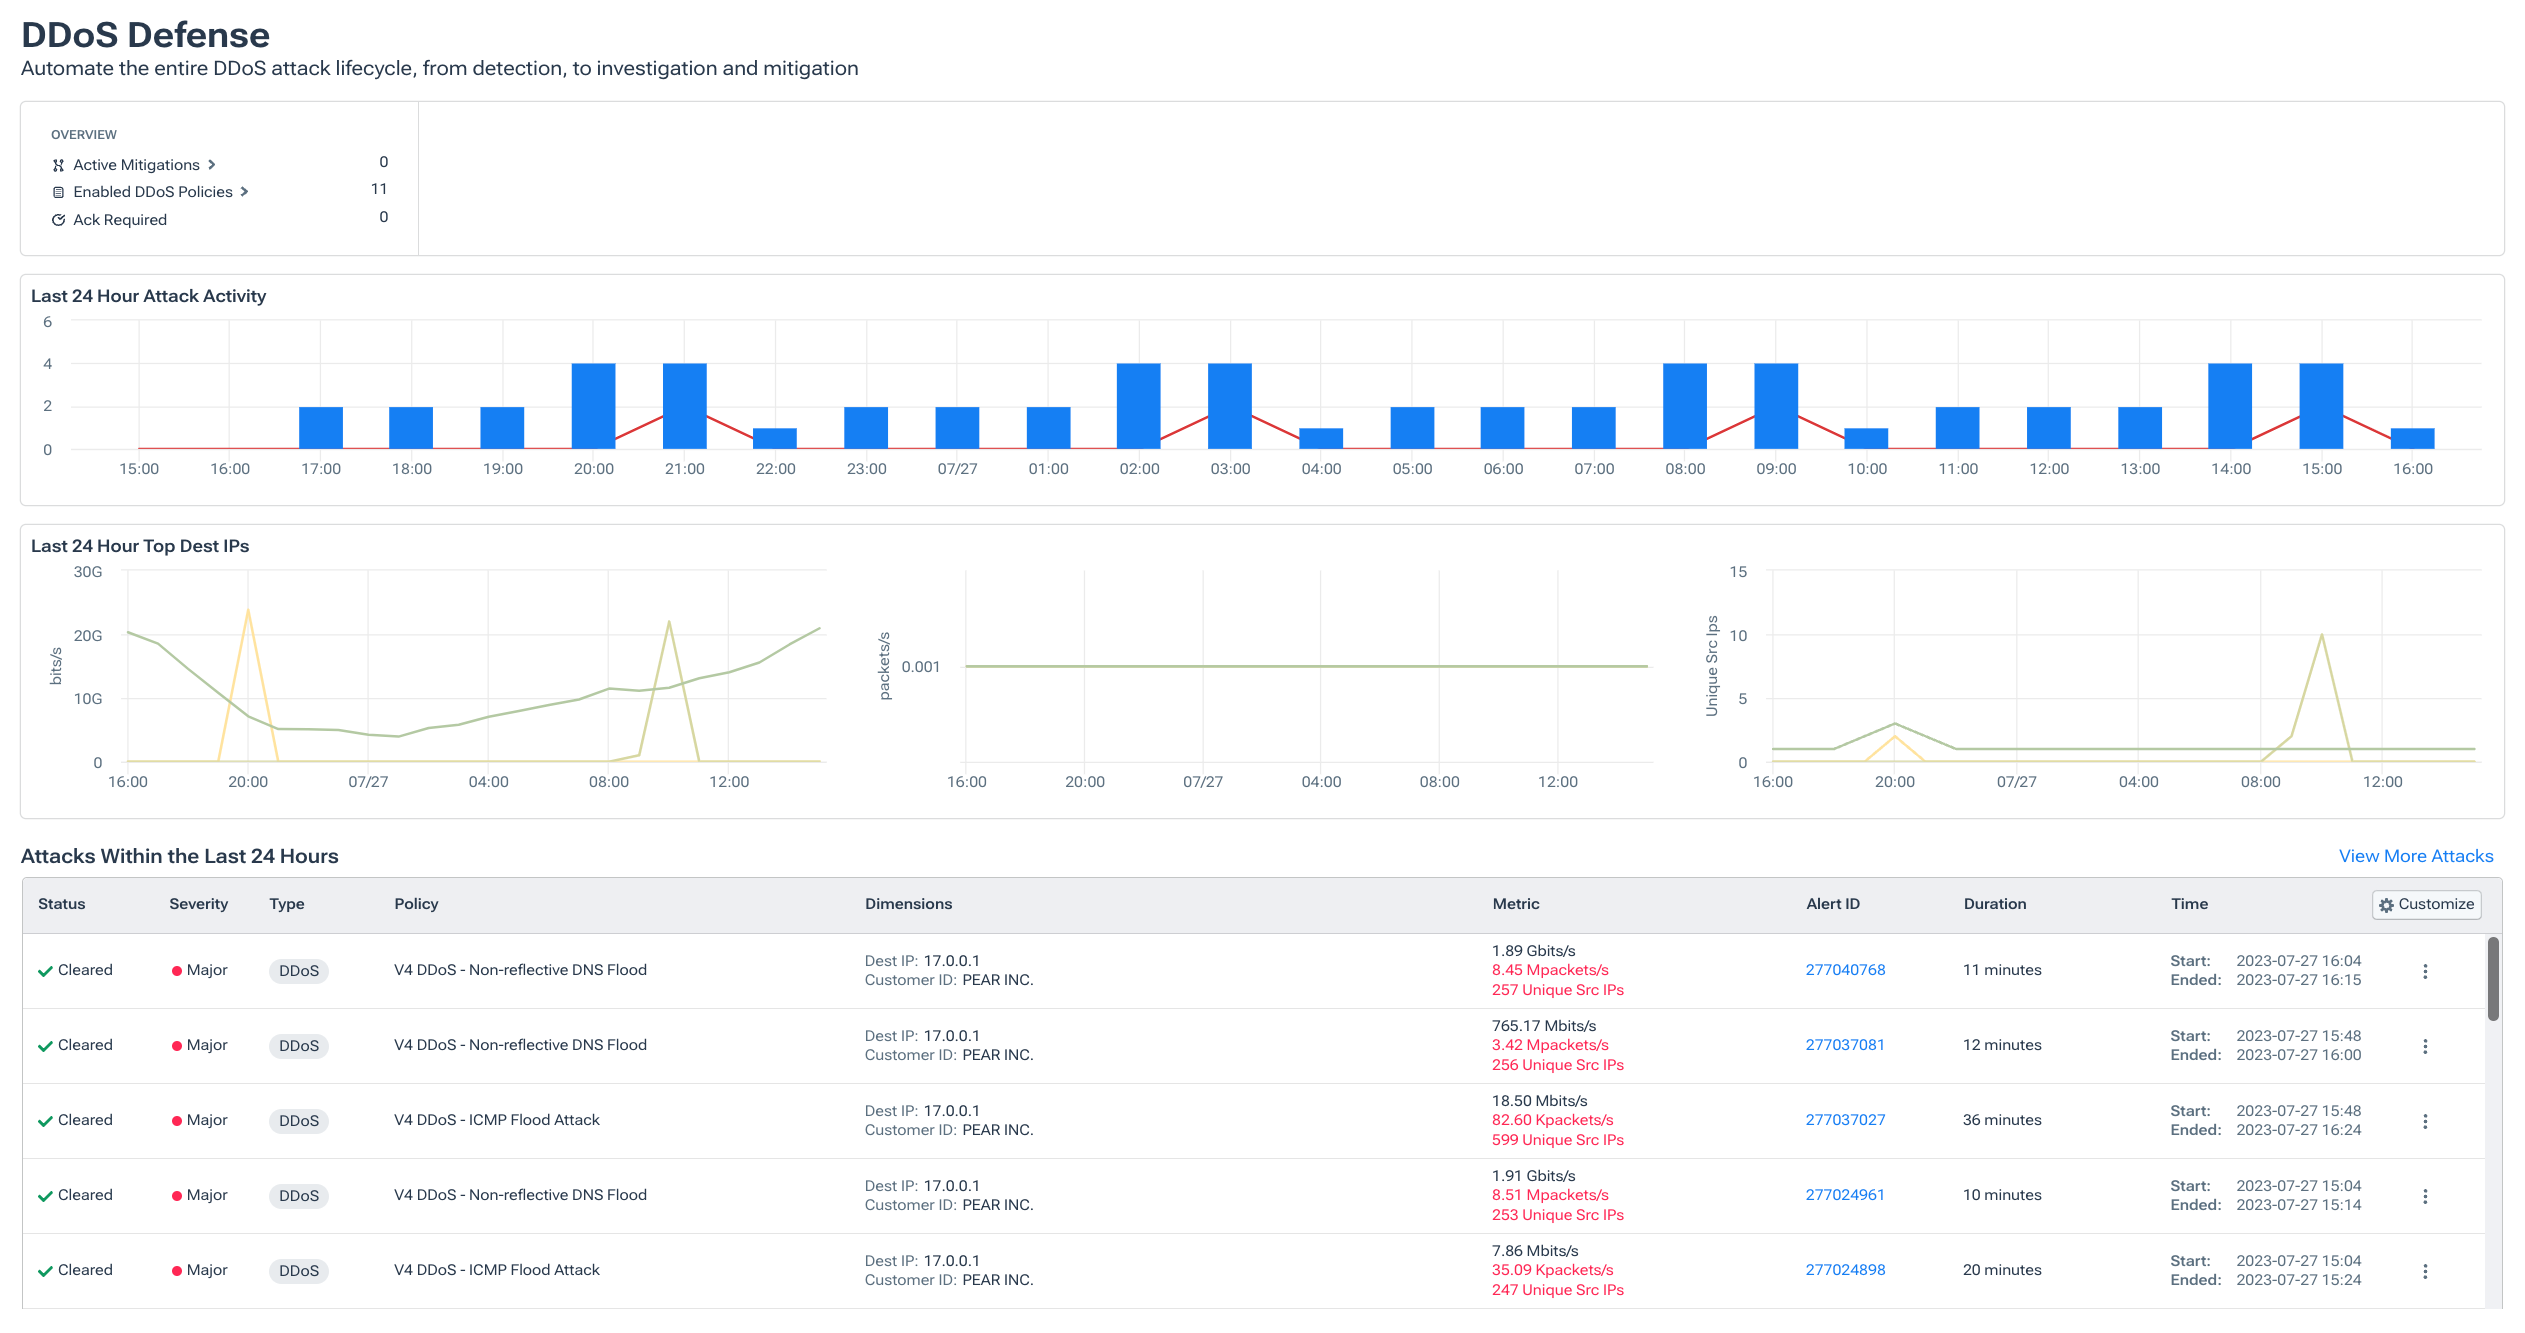
Kentik helps teams detect suspicious traffic early, confirm whether it’s an attack, and move quickly from investigation to mitigation with repeatable workflows.
Teams ask:
- Is this spike a real DDoS attack or normal traffic growth?
- What’s the likely vector, who is being targeted, and how is it distributed?
- What’s the fastest mitigation path for this situation (RTBH, Flowspec, scrubbing integration)?
- How do we reduce false positives and respond consistently every time?
What you need to see:
- Baselines that distinguish attack behavior from normal variation
- Attack breakdown by source/destination, ASN, geo, protocol/vector, and time window
- Threat intelligence enrichment (reputation, botnet/C2 indicators where available)
- A mitigation path that triggers the right action quickly and predictably
How Kentik helps:
- Uses ML-based traffic profiling and configurable attack profiles to detect DDoS patterns and reduce false positives.
- Enriches traffic with threat intelligence feeds and security context to support confident triage.
- Supports mitigation workflows including RTBH and Flowspec, plus integrations with mitigation providers.
- Helps teams confirm whether mitigation is working by monitoring how traffic patterns shift after action.
Related solution page: Detect and Mitigate DDoS
Related product context: Network Security and Compliance
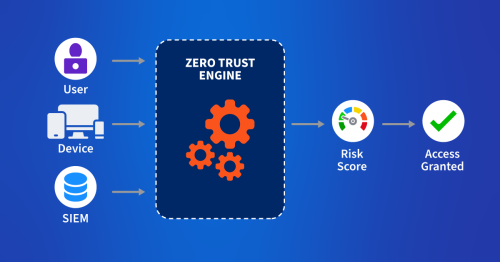
2. Validate zero-trust and cloud network policy enforcement
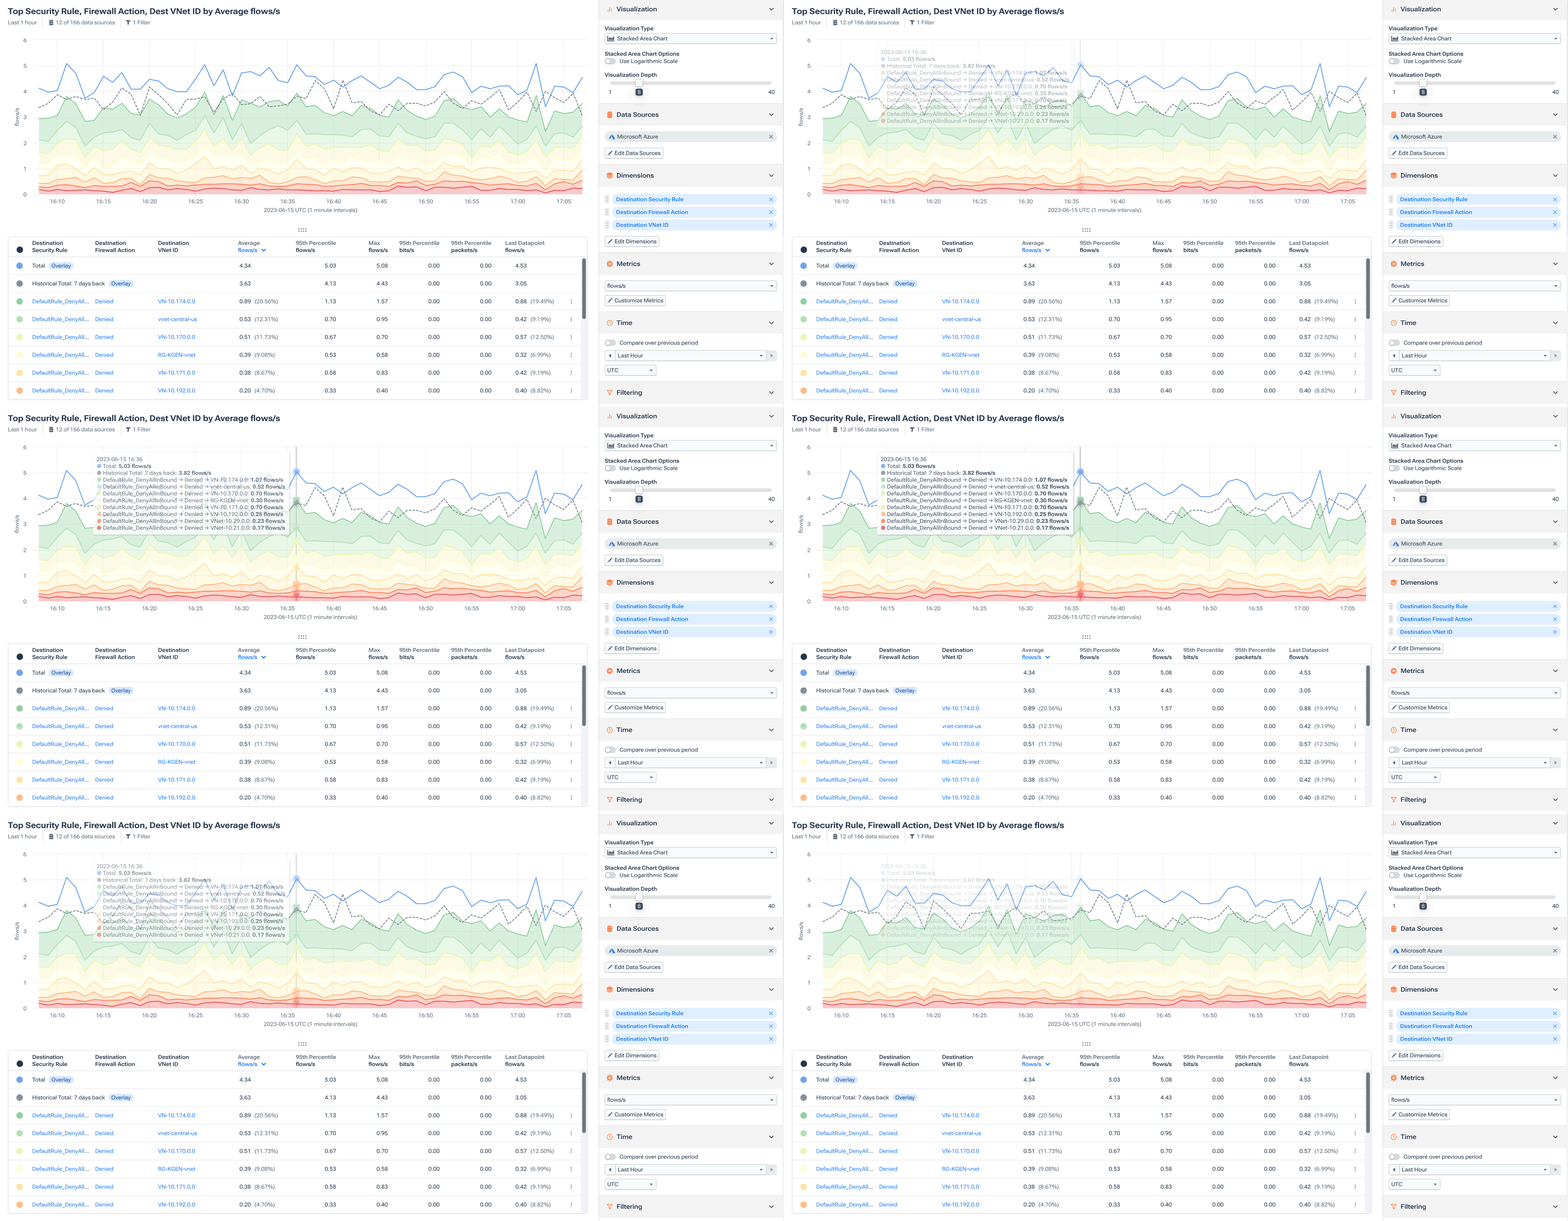
Kentik helps teams prove that policy intent matches reality by making allowed, denied, and rejected traffic visible, searchable, and explainable with policy metadata.
Teams ask:
- Are security groups, ACLs, and perimeter rules enforcing least privilege as intended?
- Which denied flows are expected noise vs real outages or misconfigurations?
- Where do we have policy drift or unexpected cross-segment communication?
- Can we unblock teams fast when “it can’t connect” is actually a policy issue?
What you need to see:
- Allowed/denied/rejected traffic enriched with policy metadata
- Context tying flows to cloud objects, environments, applications, and owners
- Fast queries to isolate the specific control causing impact (SG/NSG/ACL/firewall/gateway)
- Alerts for suspicious rejected-traffic patterns, drift, and unexpected access
How Kentik helps:
- Surfaces inbound, outbound, and denied traffic with policy metadata to speed investigations.
- Makes it practical to verify that perimeter rules, security group rules, and ACLs behave as intended in real traffic.
- Helps identify suspicious traffic flowing through permissive or misconfigured policies.
- Supports fast ticket resolution for common cloud connectivity issues by showing where and why traffic is blocked.
Related solution page: Harden Network Policy Management
3. Detect malicious traffic and anomalous behavior in real time
Kentik helps teams detect probing behavior, suspicious traffic patterns, and security anomalies across hybrid networks using enriched telemetry and alerting.
Teams ask:
- Are we seeing scanning or probing behavior right now?
- Is there suspicious traffic to or from prohibited geographies or known bad destinations?
- Are rejected-traffic anomalies or policy exceptions indicating active threat activity?
- How do we reduce noise while still catching meaningful security signals early?
What you need to see:
- Security-oriented anomaly detection (not only “volume spikes”)
- Enrichment (reputation, geo, ASN, routing, policy context) to reduce guesswork
- Alerts that connect unusual traffic to who/what/where so responders can act quickly
How Kentik helps:
- Identifies network-probing behavior and audits unusual internet traffic with enriched context.
- Detects communications to or from embargoed/prohibited geographies and supports real-time alerting.
- Helps validate policy compliance by alerting on rejected-traffic anomalies and suspicious patterns.
- Enables responders to pivot quickly by dimensions like destination, ASN, region, policy signals, and traffic characteristics.
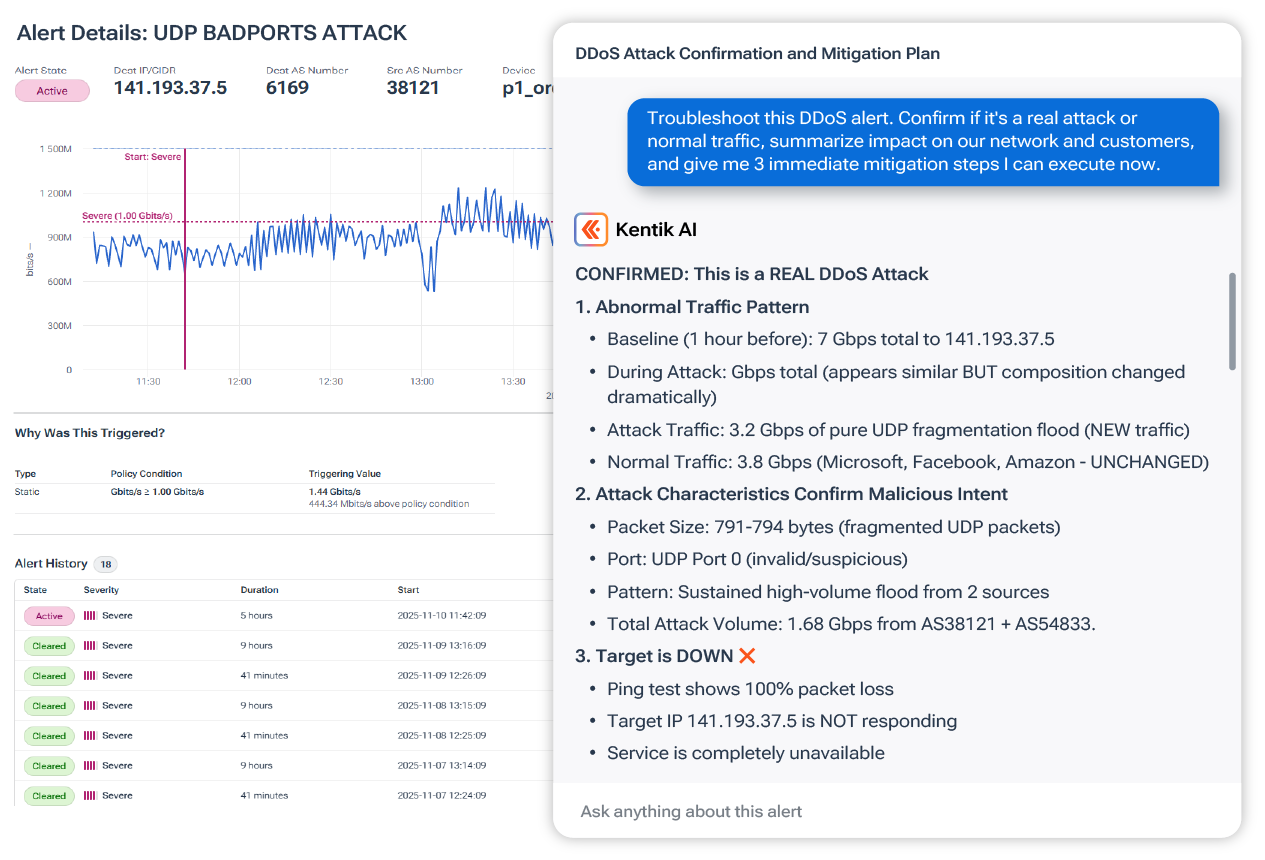
- Kentik AI Advisor can help assess business impact and accelerate detection and mitigation during DDoS attacks.
Related product pages: Network Security and Compliance and AI Advisor
4. Investigate security incidents with full-fidelity forensics
Kentik helps teams reconstruct incidents with full-fidelity data retention and enriched context so investigations remain explainable, auditable, and actionable.
Teams ask:
- What happened, when, and what systems were involved?
- Was there pre-breach reconnaissance, lateral movement, or exfiltration?
- What traffic patterns preceded the incident, and what changed during it?
- Can we produce a defensible timeline for leadership, postmortems, and compliance?
What you need to see:
- High-resolution historical visibility that remains reliable during traffic spikes
- Enrichment that adds business and security context (identity, environment, application, routing, geo)
- The ability to trace activity inside and outside your networks across cloud and data center
How Kentik helps:
- Enables lossless lookbacks and full-fidelity investigations to identify pre-breach recon and historical exfiltration/infiltration.
- Helps trace traffic across complex hybrid environments and pivot quickly using high-cardinality dimensions.
- Supports investigation of prohibited domains/geographies, unusual origins, and suspicious internal movement patterns.
- Provides evidence-backed context you can use for escalation, remediation, and reporting.
Related solution page: Investigate Security Incidents
Related data-export features: Kentik Firehose
This short demo shows how to perform a forensic analysis after a security breach using Kentik. Leveraging Kentik’s visibility into public cloud traffic, we showcase how engineers can effectively identify, analyze, and respond to security incidents:
5. Monitor routing security signals: RPKI, leaks, hijacks, and misroutes
Kentik helps teams treat routing security as a first-class security signal by monitoring reachability, unexpected origins, RPKI invalids, and leak/hijack indicators and connecting those events to impact.
Teams ask:
- Are unexpected origins or path changes creating risk or service impact?
- Are RPKI invalids appearing and do we need to investigate enforcement or misconfigurations?
- Did traffic start taking unusual paths or becoming unreachable from parts of the internet?
- Can we detect leaks/hijacks quickly and quantify blast radius?
What you need to see:
- Prefix reachability from many vantage points
- AS path visibility and time-series routing events (announcements/withdrawals/path changes)
- Alerts on suspicious conditions (unexpected origins, RPKI invalids, leaks/hijacks, route flaps)
- Correlation between routing events and traffic/performance impact
How Kentik helps:
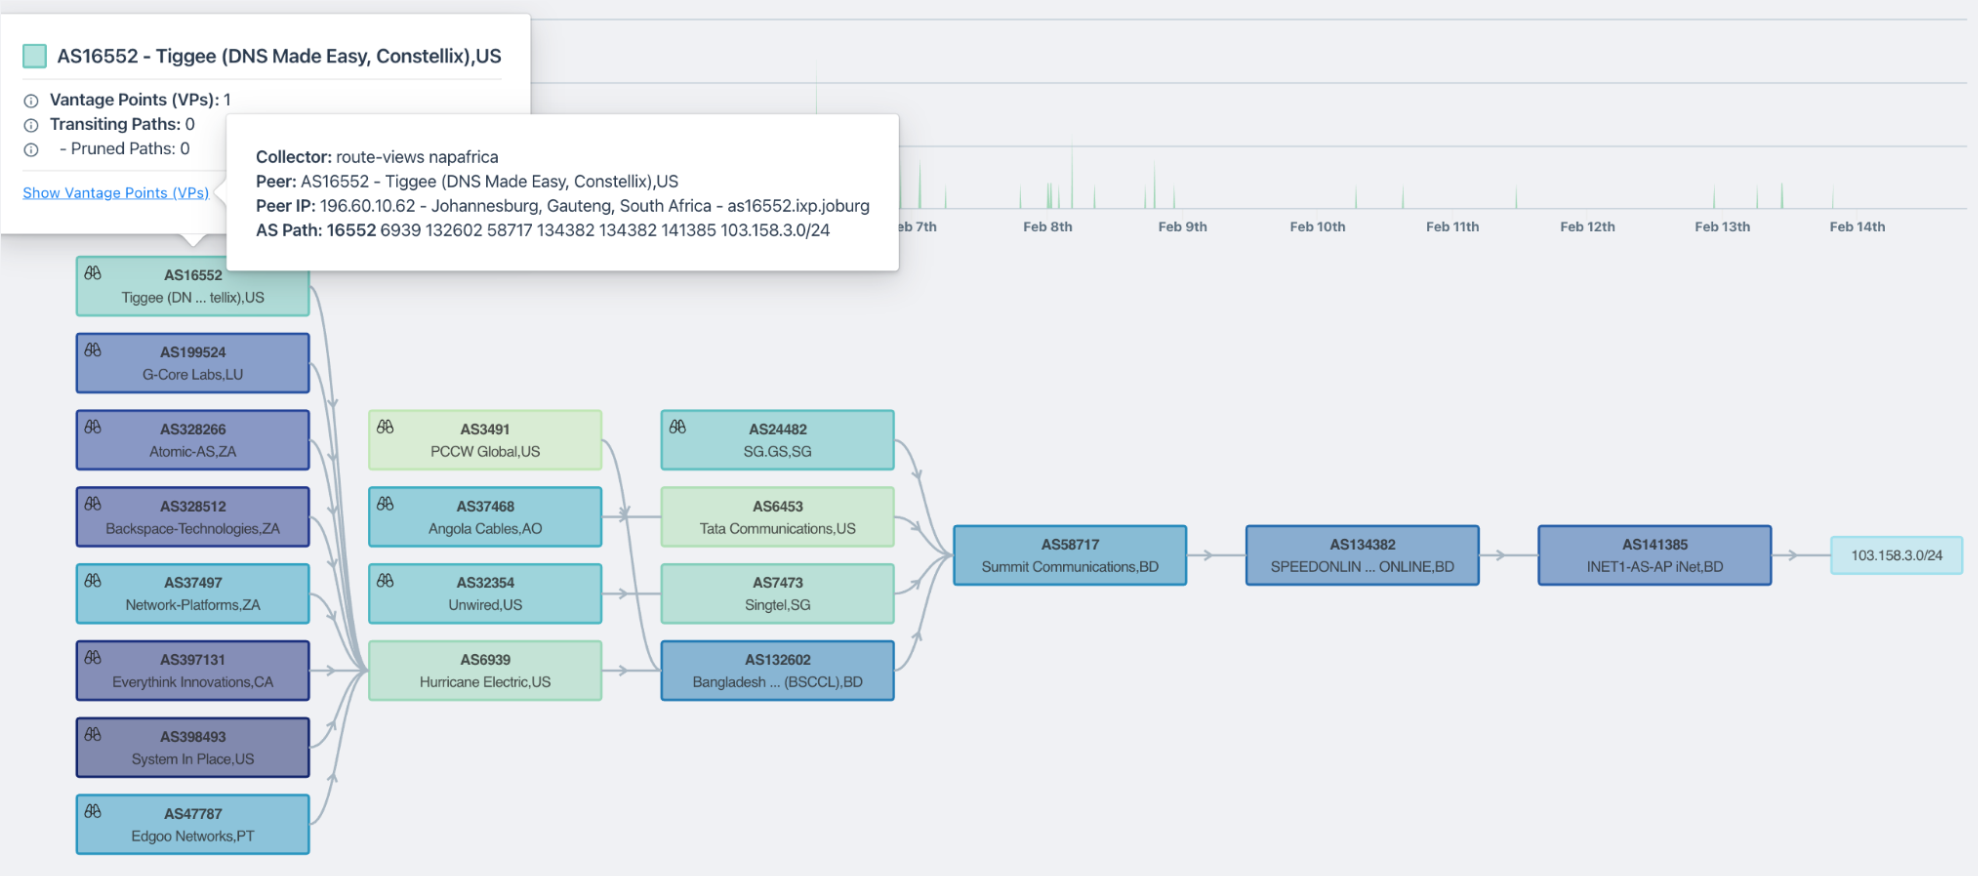
- Monitors prefixes from thousands of vantage points and visualizes AS paths dynamically over time.
- Alerts on critical BGP activity that could affect traffic, security, and performance.
- Supports hijack/leak detection workflows and routing verification after changes or mitigations.
- Helps teams correlate routing events with impact to prioritize response and escalation.
Related pages:
Example security workflows (enterprise and service provider)
The sections above describe the core security and policy capabilities (DDoS detection and mitigation, denied-traffic policy validation, security anomaly detection, forensic investigations, and routing security signals). Below are practical examples showing how teams combine those capabilities in real operations.
Enterprise workflow examples
1. “Is this a DDoS?” triage to mitigation
- Compare the spike to baselines to confirm it’s abnormal behavior.
- Break down by target, vector, geo, ASN, and source distribution to confirm DDoS characteristics.
- Choose the smallest effective mitigation (filter/rate-limit, RTBH/Flowspec, or scrubbing integration).
- Validate success by watching how traffic distribution and service experience change after action.
2. “It can’t connect” denied traffic and policy troubleshooting
- Identify the failing time window and the impacted workload-to-service pair.
- Use denied/rejected traffic views enriched with policy metadata to isolate the enforcing control.
- Verify whether the deny is intended policy or drift/misconfiguration.
- Fix or request change with evidence (what is blocked, where, and by which control).
3. “Are we being scanned?” probing and anomaly response
- Alert on probing patterns and suspicious rejected-traffic anomalies.
- Pivot by destination, port/protocol, source ASN/geo/reputation, and impacted assets.
- Decide response: block, rate-limit, tighten policy, or hand off to endpoint/security tooling with evidence.
4. “What happened?” incident reconstruction and reporting
- Establish the incident window and baseline window.
- Reconstruct the sequence: recon, lateral movement indicators, unusual egress/exfil patterns.
- Document scope (assets, destinations, accounts/environments, regions) and the most likely path of activity.
- Export or share evidence for downstream response workflows and postmortems.
Service provider workflow examples
1. DDoS defense with redundant visibility
- Detect attacks early and validate distribution and vectors.
- Trigger mitigation via RTBH/Flowspec or partner integration and confirm traffic shifts as expected.
- Use an independent visibility layer to validate mitigation effectiveness even if primary systems are under stress.
2. Policy compliance at scale
- Monitor rejected/denied traffic anomalies and suspicious patterns by customer/service.
- Produce consistent evidence and reporting for enforcement actions.
- Prioritize response by scope and business impact.
3. Routing-security monitoring for customer assurance
- Alert on reachability issues, unexpected origins, RPKI invalids, and leak/hijack signals.
- Correlate routing events with traffic and customer impact.
- Provide concise, timestamped evidence for upstream escalation and customer communications.
FAQs about network security & policy
How do I tell the difference between a DDoS attack and normal traffic growth?
Compare current behavior to baselines and look for attack-like distribution patterns (sources, ASNs, geos, vectors, protocol mix). Then validate whether the traffic profile matches known attack patterns or normal variation. See: Detect and Mitigate DDoS
What should I look at first to choose a DDoS mitigation action?
Start with the vector, target(s), and distribution (who/where), then choose the least disruptive mitigation that fits the situation (filter/rate-limit, RTBH/Flowspec, or scrubbing integration). Speed comes from having the breakdown ready immediately. See: Detect and Mitigate DDoS
How do I validate zero-trust segmentation and detect policy drift?
Continuously compare observed communication patterns to intended segmentation and alert on unexpected cross-segment flows or suspicious rejected-traffic anomalies. The goal is to catch drift before it becomes exposure or outage. See: Harden Network Policy Management
How do I troubleshoot denied traffic in cloud networks?
Use denied/allowed visibility enriched with policy metadata and isolate which security group/NSG/ACL/firewall rule caused the block. Fast troubleshooting requires both traffic evidence and policy context. See: Harden Network Policy Management
How do I detect scanning or probing behavior using network telemetry?
Look for unusual connection patterns (many destinations/ports, repeated failures, low-and-slow scans), then correlate with reputation, geo, ASN, and policy context so you can decide what to block and why. See: Network Security and Compliance
What should I retain for incident investigation and compliance?
Retain high-resolution historical visibility and enrich telemetry with business and security context so investigations are explainable and auditable. The goal is to reconstruct what happened across cloud and data center, even during spikes. See: Investigate Security Incidents
How do routing anomalies (BGP leaks/hijacks) relate to security risk?
Routing anomalies can redirect traffic through unintended networks, enabling interception risk, policy bypass, or disruption. Monitoring unexpected origins, RPKI invalids, and reachability changes helps teams detect these events earlier and quantify impact. See: BGP Route Monitoring
How can AI accelerate incident investigation and reporting?
AI can help by correlating telemetry sources, summarizing anomalies, and drafting evidence-backed handoffs and postmortem narratives, as long as conclusions remain tied to underlying data. See: Kentik AI
How do I build a reliable DDoS detection-to-mitigation workflow?
Baseline normal traffic, alert on meaningful anomalies, investigate distribution (sources, ASNs, geos, vectors), and automate mitigation paths where appropriate. Validate mitigation with “before vs after” traffic behavior. See: Detect and Mitigate DDoS
Why would a service provider want a redundant DDoS backup?
A secondary visibility and detection layer helps validate mitigation effectiveness and provides resilience if primary tooling is degraded during large attacks. A common pattern is detecting in Kentik and triggering on-demand mitigation via partner integrations. See: Kentik + Cloudflare Magic Transit
How can threat or botnet traffic increase network spend?
Malicious or abusive traffic can consume expensive capacity, especially on constrained or high-cost links. Identifying and stopping it reduces waste and can improve QoE. See: Network Security and Compliance
How do I enforce customer or regulatory policy at scale?
Detect suspicious patterns that indicate violations, investigate and document evidence by customer/service, and prioritize enforcement based on scope and impact. Policy-aware visibility into allowed/denied/rejected traffic makes enforcement repeatable. See: Harden Network Policy Management

