Understanding and Controlling AWS Transit Gateway Costs with Kentik


Summary
AWS Transit Gateway costs are multifaceted and can get out of control quickly. In this post, discover how Kentik can help you understand and control the network traffic driving AWS Transit Gateway costs. Learn how Kentik can help you understand traffic patterns, optimize data flows, and keep your Transit Gateway costs in check.
As organizations increasingly rely on cloud environments like AWS, managing costs effectively becomes just as critical as keeping the packets flowing. One significant cost area engineers need to pay attention to is the AWS Transit Gateway.
While the Transit Gateway offers a powerful and scalable way to connect VPCs, on-premises data centers, and other networks, the costs associated with its usage can quickly balloon, especially when network traffic isn’t well-understood or optimized. This is where Kentik can play a vital role in identifying the network traffic driving Transit Gateway costs, enabling businesses to optimize their network architecture and reduce expenses.
Where AWS Transit Gateway cost comes from
TGWs are a standard way to connect VPCs and on-prem networks through a central hub. This simplifies network management and reduces the complexity of multiple VPN connections. The problem is that the cost structure of the TGW is multi-faceted, including charges for each GB of network data processed, charges for each attachment used to connect VPCs and other network components, and also hourly costs per attachment.
The AWS Transit Gateway pricing website provides an example that can help. Imagine a TGW deployed in the US East region with a VPC attached. To send traffic from an EC2 instance in that VPC to another VPC, you’d create a route via your TGW.
After sending 1 GB of data, the breakdown looks something like this:
- First, we have the TGW hourly charge. This is the hourly charge for the TGW; for US East, it’s $0.05 per VPC attachment, which, for our example, comes to $0.1 per hour since we have two VPCs total.
- Second, we have the TGW data processing charge. Since 1 GB was sent from an EC2 instance in a VPC attached to a TGW, you’ll incur a data processing charge of $0.02.
- Next, we have the TGW data processing charge across peering attachments. In this example, 1 GB was sent from an EC2 instance in a VPC attached to a Transit Gateway in the US East over a peering attachment to a different Transit Gateway in the US West.
For the cross-peering attachment, the total traffic-related charges will be $0.04. This figure comes from $0.02 for the first TGW data processing and an additional $0.02 for outbound inter-region data transfer charges. Since the traffic inbound from the US West is an inbound inter-region data transfer, there aren’t any charges on that side.
In the example AWS provides us on their website, we can see how a simple data transfer over time and at scale, including multiple regions, multiple attachments, and large amounts of data, can result in huge fees.
It goes without saying that if you want to control cloud costs, understanding the traffic that passes through the TGW is extremely important. Without visibility into this traffic, you could unknowingly (and very easily) incur high charges due to inefficient routing, unnecessary data transfer between VPCs, or other suboptimal network behaviors.
How Kentik helps monitor AWS Transit Gateway costs
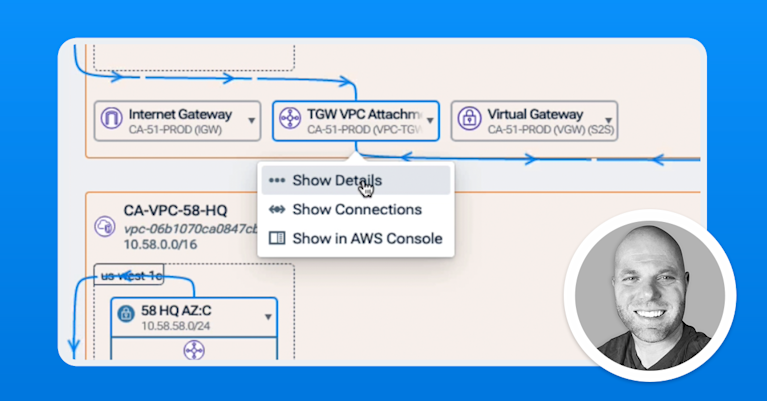
Kentik is designed to help organizations understand, manage, and optimize their networks, both on-premises and in the cloud. This includes robust support for AWS environments, including detailed insights into traffic passing through AWS Transit Gateways.

AWS VPC Flow Logs and cloud metrics provide the bulk of telemetry data for detailed visibility into the traffic flowing through your AWS environment down to a specific TGW. Then, by adding relevant metadata to these logs, such as application IDs, security tags, and project or department identifiers, we can start to make sense of flows and metrics that tell us things like VPC, port, protocol, source IP, and destination IP.
In this way, Kentik can understand quite a bit about the traffic going over a busy TGW – volume, application type, patterns in seasonality, which attachments are used for a particular flow, unusual behavior, etc. These data points are correlated to provide context to a TGW cost calculation and help an engineer understand which components of your infrastructure drive the most traffic through the TGW and, thus, where the most significant costs are coming from.
Identifying high-cost traffic patterns
Once all the data is visualized, Kentik allows you to drill down into specific traffic you’ve identified contributing to high TGW costs. You may find that certain VPCs are communicating more than necessary or that a DNS problem is causing an unexpected traffic volume between your on-prem data center and your cloud environment.
Kentik’s advanced analytics is all about finding meaningful insights in the data so you can take action. For example, you might discover that a routing problem is causing specific applications to inefficiently route traffic through the TGW when they could use a more direct or less expensive route.
This is the point of network observability—the ability to answer any question about your network. In this case, it’s a question of cost, which is a function of TGW traffic.
For instance, in Kentik, you can filter for specific types of traffic patterns that imply some sort of growing problem. With traditional visibility tools, alerts don’t fire until a threshold is reached, or in other words, something bad already happened. Instead, Kentik analyzes a trend over time and sees traffic creeping up on a particular TGW. Though not hitting any thresholds yet, it’s a pattern that’s unusual and potentially bad over time.
As another example, inter-VPC traffic is prevalent and, in many cases, unavoidable due to how modern distributed applications work. With Kentik, we can filter cloud telemetry to see traffic from a specific VPC to another specific VPC and filter for things like application, TGW, attachments, department tags, and so on to understand what’s driving our TGW cost.
Traffic attribution and cost allocation
One of the challenges in cloud environments is attributing costs to specific applications, departments, or business units. Kentik’s ability to tag and categorize traffic by various dimensions, such as VPCs, tags in AWS, or specific services, allows you to map network traffic to the respective cost centers within your organization.
This traffic attribution is especially useful when you need to understand who’s responsible for driving TGW costs. For instance, if a particular business unit generates significant traffic between VPCs across regions, Kentik can help you identify this and attribute the associated costs accordingly. This visibility allows you to implement accurate chargeback models or take corrective actions to optimize traffic flows.
Transitioning to cloud quickly complicates networking. Learn the top 3 AWS gotchas and how to avoid them.

Optimizing network traffic to reduce costs
After identifying the traffic patterns and sources driving AWS Transit Gateway costs, the next step is optimization. Kentik observes traffic over time and, therefore, can identify traffic patterns behind unnecessary data transfers.
An example could be observing a trend in cross-VPC traffic, which is driving TGW network data processing charges. With this information, an engineer could consolidate certain VPCs to minimize this kind of cross-VPC traffic or possibly use a Direct Connect for large volumes of data transfers, thereby reducing TGW charges. Since Kentik also monitors traffic in real-time, when you implement these optimizations, you can immediately see the impact on your TGW costs.
Proactive cost management with alerting and reporting
An essential part of controlling cloud costs is the alerting capability that can notify you of traffic patterns likely to result in increased AWS TGW. Remember that Kentik was designed for the engineer, so any time a certain type of traffic is identified, or a pattern is recognized, an alert can be set up based on the filters used to get that data. Then, with whatever static or dynamic thresholds work for your organization, you can proactively manage and mitigate costs before they blow up your cloud bill.
Lastly, accurate and usable reporting tools are crucial for generating detailed reports on the traffic you’ve identified as driving TGW costs. Whether these reports show traffic trends over time or identify specific cost drivers, they are especially valuable for periodic reviews of your cloud network’s performance and cost efficiency.
So, to conclude, though AWS Transit Gateway provides a powerful way to connect and manage your cloud and on-premises networks, the costs associated with its use can become problematic if not carefully monitored. Kentik offers a powerful solution for identifying and understanding the network traffic driving these costs. You can effectively manage and reduce your AWS Transit Gateway expenses by leveraging Kentik’s capabilities to ingest cloud telemetry, visualize traffic, identify cost-driving patterns, attribute costs, and optimize traffic flows.


