Understanding the Deficiencies of AWS CloudWatch for Cloud Visibility

Summary
While CloudWatch offers basic monitoring and log aggregation, it lacks the contextual depth, multi-cloud integration, and cost efficiency required by modern IT operations. In this post, learn how Kentik delivers more detailed insights, faster queries, and more cost-effective coverage across various cloud and on-premises resources.
The complexity of modern networking requires effective monitoring and observability, especially when much of the network we rely on is in the public cloud. This applies to the security, performance, and cost-efficiency of cloud infrastructures.
AWS CloudWatch, a native solution offered by Amazon Web Services, is a popular tool for monitoring cloud resources. Though it may be sufficient for some organizations, for many, it lacks the data and functionality to provide contextually relevant network observability, especially in a multi-cloud environment.
AWS CloudWatch is designed to provide a broad overview of cloud resource performance, making it appropriate for basic monitoring tasks. With CloudWatch, we can visualize and analyze primary cloud performance and operational data. This includes collecting and storing logs and application and infrastructure metrics. It also provides basic dashboards, alarms, logs, and metrics correlation.
However, this broad scope often comes at the expense of the focus and contextually relevant visibility of a full-fledged network observability solution.
Limitations of CloudWatch
First, CloudWatch aggregates data which can make in-depth analysis and troubleshooting much more cumbersome, especially for network engineers.
The challenge is that as companies mature in their cloud adoption, they end up with hundreds of accounts spread over dozens of regions. Looking at the data one by one is not effective to quickly understand the root cause of a network issue that is impacting application performance.
For example, CloudWatch allows viewing data on a per-account and per-region basis, but it lacks the capability to seamlessly integrate and analyze data across multiple accounts and regions simultaneously, not to mention multiple public clouds, which are completely out of CloudWatch’s scope.
It’s possible to put data from other data sources into CloudWatch, but it comes with added complexity and expense if egressing data from other clouds. This isn’t an effective way to manage cloud visibility.
A common complaint among CloudWatch users is that it simply isn’t intuitive for monitoring metrics. Whether that’s because CloudWatch uses a very basic UI or because all metrics data is dumped into one bucket and highly aggregated (or more likely both), it’s difficult to parse and analyze metrics for specific networking use cases. To make things worse, CloudWatch will take several minutes to run a query, which is an eternity for engineers troubleshooting a problem in real time.
CloudWatch seems to have been built for more generic use cases and isn’t as useful for network or network security engineers trying to understand logs and metrics in context, or in other words, an application, workload ID, geographic region, and so on. What’s missing here is the context we find in modern network observability platforms, namely, the addition of enrichment data relevant data to the overall dataset to put raw logs and metrics into the context of what’s important to a network operator. This could be application or workload tags, geographic identifiers, DNS information, and so on.
This isn’t necessarily a dealbreaker for some. Still, it points out that CloudWatch was built as a generic metrics and log aggregator, not an actual observability tool for accommodating specific networking use cases.
For example, most metrics are tied to an interface, such as bytes in and out. This may be enough for some narrow use cases like an engineer interested in getting an alert if a NAT gateway is overloaded. However, there’s no context attached to these metrics, so it’s difficult to understand the path view of traffic to and from that gateway, possible routing issues causing the spike, what specific application traffic is overwhelming the interface, and so on.
Second, Cloudwatch is generally built with AWS telemetry in mind.
Most organizations are operating multi-cloud environments, whether that’s multiple public cloud services like AWS and Azure, a single cloud service and a SaaS provider, or a mixture of public cloud and on-premises resources. Often this is by design over time, though sometimes it happens due to shadow IT.
As an organization grows, CloudWatch can quickly get very expensive.
When we add up the total amount of flow data and cloud metrics, the amount of information stored by AWS is significant. There’s a cost associated with that which really can’t be avoided. However, CloudWatch also charges to query that data with tools like Athena.
For an organization fully invested in the public cloud, such as AWS, querying cloud telemetry is part of the average daily network, cloud, and security operations. This means the cost of normal IT operations can become cost-prohibitive. Additionally, because CloudWatch is limited to only AWS logs and metrics, there is also a cost to fill in the gaps with other tools to provide the missing visibility. This means the cost of licensing and storage and the operational cost of running more visibility tools.
Kentik puts everything into context
It’s important to remember that Kentik is a network observability platform, not a network visibility platform. That means Kentik provides much more than visibility into logs and metrics on colorful graphs. Instead, It ingests information to put it into context.
Alongside AWS VPC flow logs and cloud metrics, Kentik also ingests telemetry from other cloud and SaaS providers, campus and data center networks, the public internet, as well as a variety of metadata such as application and security tags, IPAM and DNS information, geographic identifiers, and so on. All of this information is analyzed together, and in this way, an engineer can understand why a metric is what it is and why it’s vital in the first place.
For example, if an engineer suspects a NAT gateway is overloaded, they can look into this network element with CloudWatch. However, with Kentik there would be context to help them figure out what applications or services are being affected, what caused the issue, and, therefore, the best way to go about fixing the problem.
CloudWatch metrics are highly aggregated, and a bytes-in and bytes-out count, though helpful for figuring out which interface is being overutilized, doesn’t tell us the specifics of the application traffic going through that gateway.
On the other hand, Kentik can quickly pivot between cloud metrics and flow data and beyond, looking at the relevant routes, DNS servers involved, firewall rules, security tags, and so on. Kentik is designed to be consumed by a network operations team focused on troubleshooting real problems, analyzing historical data, and understanding application traffic end-to-end. To that end, queries can take seconds rather than minutes with CloudWatch.
Multi-cloud is becoming the norm
Today, most organizations are multi-cloud, so understanding application traffic usually means understanding how multiple public clouds communicate with each other over the internet.
As a simple example, imagine a line of business web application. The front end is hosted in one public cloud, while specific backend components are hosted in a different one. Certainly, this is not ideal, but technical and/or business constraints frequently create these situations.
To troubleshoot an application performance issue, we’d need telemetry from both public cloud providers, AWS and Azure, in this example, as well as information about the connectivity over the internet between these instances. CloudWatch, though a decent log and metrics aggregator, wouldn’t help us piece this puzzle together across clouds.

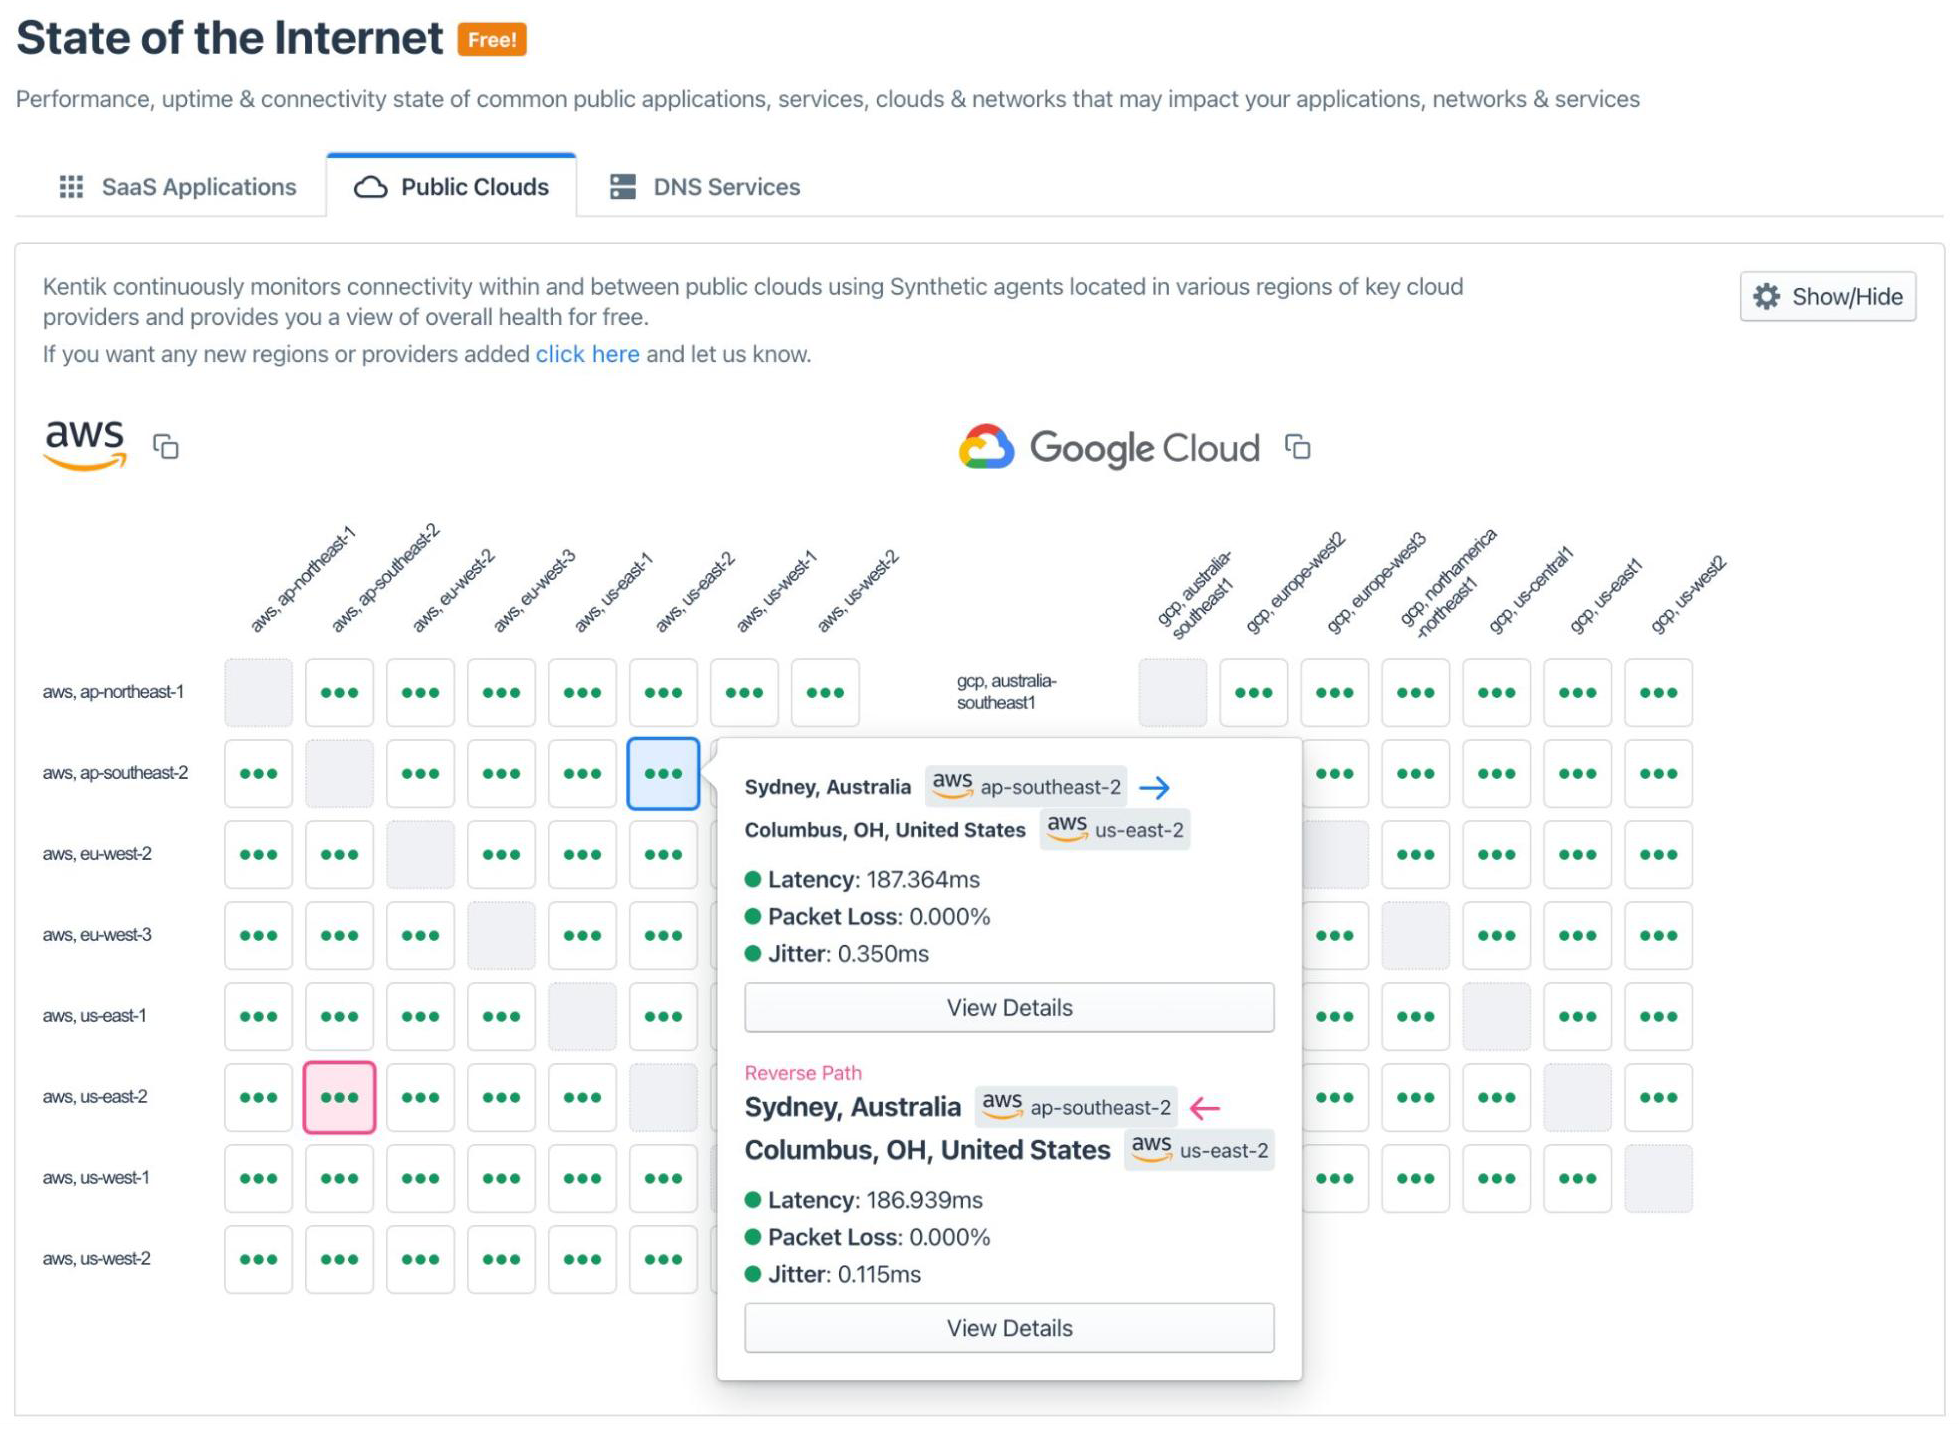
Kentik’s global mesh of synthetic test agents as well as privately deployed test agents measure network performance over the public internet including the path between public clouds. For most IT teams, this requires additional tools and licensing, but Kentik integrates all of this telemetry into a single platform.
Cost efficiency
First, though using AWS Athena with S3 for aggregating VPC flow records is an improvement over traditional CloudWatch, this method is costly. Each query incurs a cost for every read, even if querying the data with your own mechanism. This alone has priced some organizations out of CloudWatch, leaving them looking for an alternative.
Kentik solves this problem by creating a read-only account in an AWS instance to ingest and store logs into a separate S3 bucket and using AWS API endpoints to get metrics and metadata. Then, Kentik can query that data at no cost other than the Kentik licensing itself, which is not based on the number of queries made.
AWS still charges for generating the logs, which is unavoidable without doing your own instrumentation on your instances, but an IT team can avoid any additional cost for individual queries by using Kentik. And because all those logs never leave AWS, there’s no cost incurred for egress traffic.
Second, because Kentik ingests telemetry from multiple public clouds, as well as on-premises resources, SaaS providers, and third party telemetry such as public DNS metrics and global routing information, switching to Kentik means IT teams no longer need to juggle many observability tools for one environment.
This also benefits the democratization of information among teams because Kentik’s intuitive interface allows various teams within an organization to access and utilize network data independently, reducing reliance on one team for all cloud operations. The cost efficiency gained by streamlining IT operations can’t be understated.
Kentik largely eliminates the complexity and access control limitations of CloudWatch even when using a CloudWatch and Athena solution. With Kentik, security, networking, and cloud teams all have the same information and access to the same data, though presented in dashboards that make the most sense for them.
Conclusion
CloudWatch is an effective generic log aggregator for AWS telemetry, but it doesn’t meet the demands of today’s IT operations teams. Slow and expensive queries, aggregate data that are difficult to parse, a generic user interface, and enormous operating costs make CloudWatch a deficient built-in visibility solution for your cloud environment.
Thankfully, AWS is open to third parties solving some of these problems. Kentik integrates with AWS and all the major public clouds and was built specifically for engineers analyzing data and fixing issues in complex, multi-cloud environments. Cheaper, faster, and both more granular in depth and more expansive in scope, Kentik is a solution designed for modern, real-world IT operations. To learn more about Kentik as a complement to CloudWatch, see “CloudWatch Alternatives: Enhancing Multicloud Network Observability.”
