Three Little NetFlow Databases in a Big Bad World

Summary
Obsolete architectures for NetFlow analytics may seem merely quaint and old-fashioned, but the harm they can do to your network is no fairy tale. Without real-time, at-scale access to unsummarized traffic data, you can’t fully protect your network from hazards like attacks, performance issues, and excess transit costs. In this post we compare three database approaches to assess the impact of system architecture on network visibility.
Storybook Endings Require Architecture That Can’t Be Blown Down

I hope I’m not going out on a limb when I say that most of us have heard of the tale of the three little pigs and the big bad wolf. Today we’ll use that classic fable to talk about three ways that folks have tried to collect and analyze flow data — with varying degrees of success…
Once upon a time there were three organizations that wanted to keep themselves safe from network performance problems, congestion, weird traffic shifts, sub-optimal planning, costly transit, and many other issues. They decided that what they needed was to be able to collect, store, and analyze network flow data like NetFlow, sFlow, and IPFIX. So they all set out to build their own flow analytics system, each one based on a different database.
Single Server Straw House
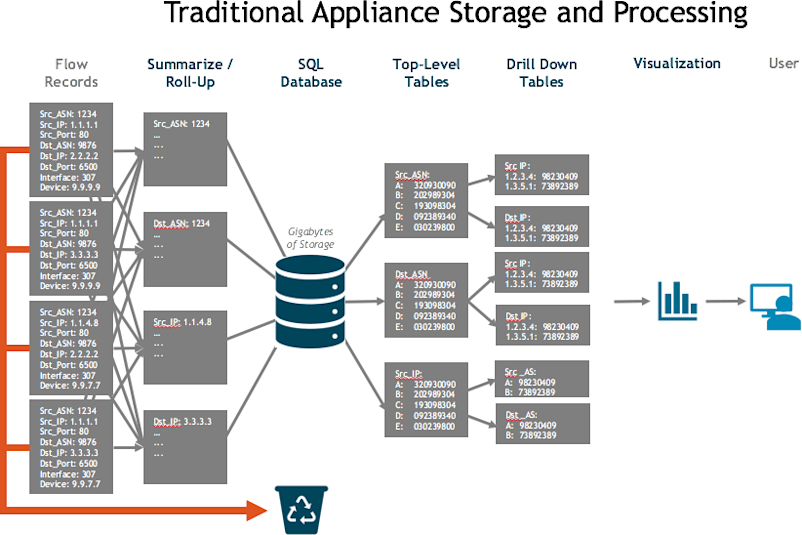
The first organization decided to build with straw… that is, with a single-server software architecture using a relational database like mySQL to contain the data. But the single server architecture was weak. Its walls were made of thin stalks of memory, CPU, and storage. And the relational database was too slow and cumbersome to be of much help. So most of the data had to be rolled up into summaries, and because the straw hut was so tiny the vast majority of details had to be thrown away. Sad! What little data was left over was packed into inflexible tables with maybe one or two drill-down tables, each with only a single indexed column.

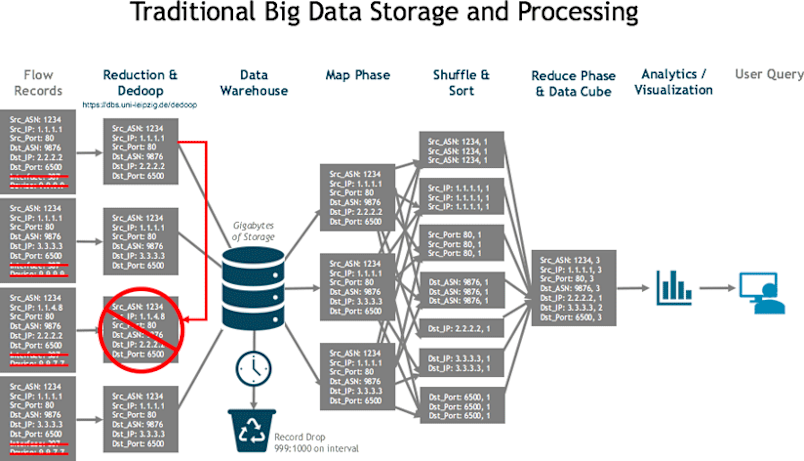
Needless to say, the little straw hut of sparse, summarized data was no match for the huffing and puffing of real-world use cases. When the big bad wolf came to the door, the system collapsed. Traditional Big Data Wood House The second organization chose to build using a traditional, Hadoop-style big data system. While this allowed much more space for data, it was still rather fragile. Like most such systems, it had to discard data by subsampling the flow records it received. What was left was MapReduced into data cubes — basically complex multi dimensional counters— which reduced cardinality and created duplicates that had to be resolved because they could no longer tell the difference between them. The cubes were essentially pre-digested data, which made it easier for a single-server system to return quick responses to queries. The problem was that they lose fidelity, and they had to pre-build the data cube to run a query, a process that took from minutes to days.

This inflexibility meant that their structure couldn’t bend to new pressures and requirements, like new use cases that required a different set of queries than the ones their cubes had been built for. So instead of a strong, unified data structure they ended up with many different and fragile fragments of data pre-compiled as separate tools for different use cases. As those fragmented tools multiplied, their teams lost efficiencies. So while the “wooden house” of traditional big data was bigger and better than a tiny straw hut, it still couldn’t stand up to the big bad wolf of pressure from the requirements of digital transformation. Despite the best efforts of the organization’s network operations, engineering, and planning teams, the wooden house ultimately collapsed.
Steel Reinforced Kentik House
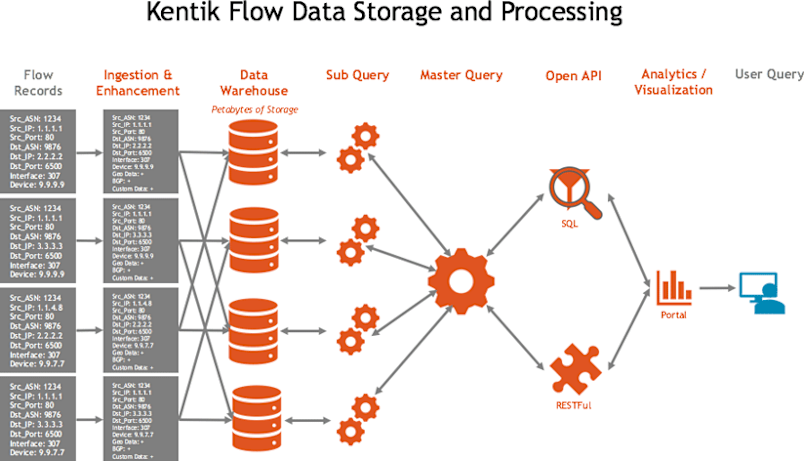
The third organization chose to build its network protections on the solid foundation of Kentik Detect. Kentik doesn’t roll up, summarize, reduce, chop, boil, or fricassee network flow data. All of the data in the fields of the received flow records is not only retained but also enriched with added information from BGP, GeoIP, and custom data sources. This enhanced data is stored in a massive, scale-out infrastructure with Petabytes of capacity. When a user submits a query, the Kentik Data Engine breaks it into thousands of subqueries that are sharded across the entire storage layer using a fairness queueing methodology (see our post on Designing for Database Fairness).

Compared to the straw and wooden houses of the first two organizations, Kentik’s data analytics architecture was like building with steel-reinforced concrete. No more siloed, weak strands or fragile datacubes. Answers came back in a few seconds, even on large datasets. And the sheer power of the Kentik platform meant that it could support a ton of different use cases, automation via native APIs, and webhooks. The biggest, baddest wolves huffed and puffed around the clock, but the Kentik house kept the third organization safe and sound.
Enter the House of Kentik
So maybe this analogy is a bit precious, but the truth remains that Kentik’s architecture provides unsurpassed flow data analytics and stands up to the toughest use cases. And you needn’t take just our word for it. Check out what Pandora says about their experience with Kentik in this cool video. Visit our Customers page to see who else is using Kentik. Or step inside today for your own look around: request a demo or start a free trial.
