The Visibility Gap: Bridging Flow and Metrics


Summary
The tools we use shape how we see problems. When flow and metrics are siloed, so is your visibility.
There are two truths most network engineers will agree on: You can’t fix what you can’t see, and incomplete visibility stinks. Unfortunately, this is the scenario network engineers find themselves in all too often when dealing with the complexity and scale of modern network environments.
Almost every network uses a tool to monitor the status, performance, and availability of its network devices. These network monitoring tools help network engineers get alerted to problems like packet loss or link utilization that can point to performance issues for the end user.
However, as network traffic becomes more voluminous and complex, often an NMS tool is only enough to alert you to a problem, but doesn’t tell you what’s causing it. In other cases, it could alert you to a problem, and you need to know what is impacted.
For that, you turn to flow to understand what your traffic is doing – who’s talking to whom, how much, and when. It helps you answer qualitative questions about network behavior, is indispensable for troubleshooting performance problems, and isolating the root cause.
However, when the data lives in separate tools – as is often the case – engineers are left trying to stitch together siloed alerts, timelines, interfaces, and even ownership with manual processes, hopeful intuition, and a little luck. And when you’re in the middle of an incident or facing performance degradation, that’s not good enough.
That’s why unifying traffic analysis with performance metrics and service states isn’t just convenient – it’s foundational to modern netops.
It’s the network. It’s not the network.
Take any network issue: a slow app, a traffic spike, a dropped session. There is always a relationship between what traffic is doing and how devices handle it. However, the direction of causality isn’t always obvious. Is the traffic causing a device to stutter under load, leading to performance issues, or is it a problem on the device disrupting traffic?
Solving these types of questions requires information about both the device and the traffic.
If you only have one half of the picture, it’s easy to make the wrong call. You chase ghosts, misdiagnose the root cause, or overlook the real issue entirely. The result: higher MTTR, more user complaints, recurring incidents that never get fully resolved, and an app team that always blames the network first instead of their own buggy app.
That’s what turns investigation from reactive fire drills into confident, focused troubleshooting.
Tooling for modern NetOps
Unfortunately, most network teams still find themselves blind to half the picture. Nearly every operator uses some form of NMS, usually built around polling devices via SNMP. This model still serves many companies well – when infrastructure is static, traffic patterns are fairly predictable, and visibility into device health is “good enough.”
For most companies today, though, infrastructure is elastic, distributed, and in constant motion. Containers spin up and down in seconds. Applications are decomposed into services that communicate with each other across clouds and data centers. Depending on your environment, east-west traffic can easily dominate over north-south traffic. And performance degradations aren’t always caused by device failure – sometimes, they’re caused by traffic volume or behavior.
That shift exposes the limits of SNMP polling. It’s limited by relatively long polling intervals, so it can miss the very conditions you’re trying to detect. It provides little to no visibility into which applications or endpoints are generating traffic – it tells you what is happening on a device, but never why.
That’s where flow comes in.
Flow data shows you the conversations – who’s talking to whom, how much, and when. It’s how you answer questions like: What’s driving this spike? Which app is chewing up the uplink? Is this backup traffic or a misconfigured job? You can’t see those things in SNMP. You need a flow technology, such as NetFlow or sFlow, to figure these things out.
Now, granted, network operators have long been aware of this. That’s why flow tools exist to analyze and understand traffic flow. It’s why Kentik started as a flow analysis tool – to help network operators quickly and accurately answer these questions.
However, even in enterprises that collect flow data, it’s often siloed in a separate tool – disconnected from network monitoring. So, when something breaks, engineers are left hopping between dashboards, manually correlating timestamps, device IDs, IP addresses, and other telemetry just to piece together a complete picture. In some cases, traffic data isn’t even being collected where it should be (or at all), making it even more challenging to isolate the cause of a performance issue on the network. And sometimes, devices are only monitored in one tool and not the other. So even if you wanted to correlate, you can’t.
This fragmentation is inefficient at best and risky at worst in modern network environments. There needs to be a better way to merge and unify these data sources in context.
Unified telemetry for unified thinking
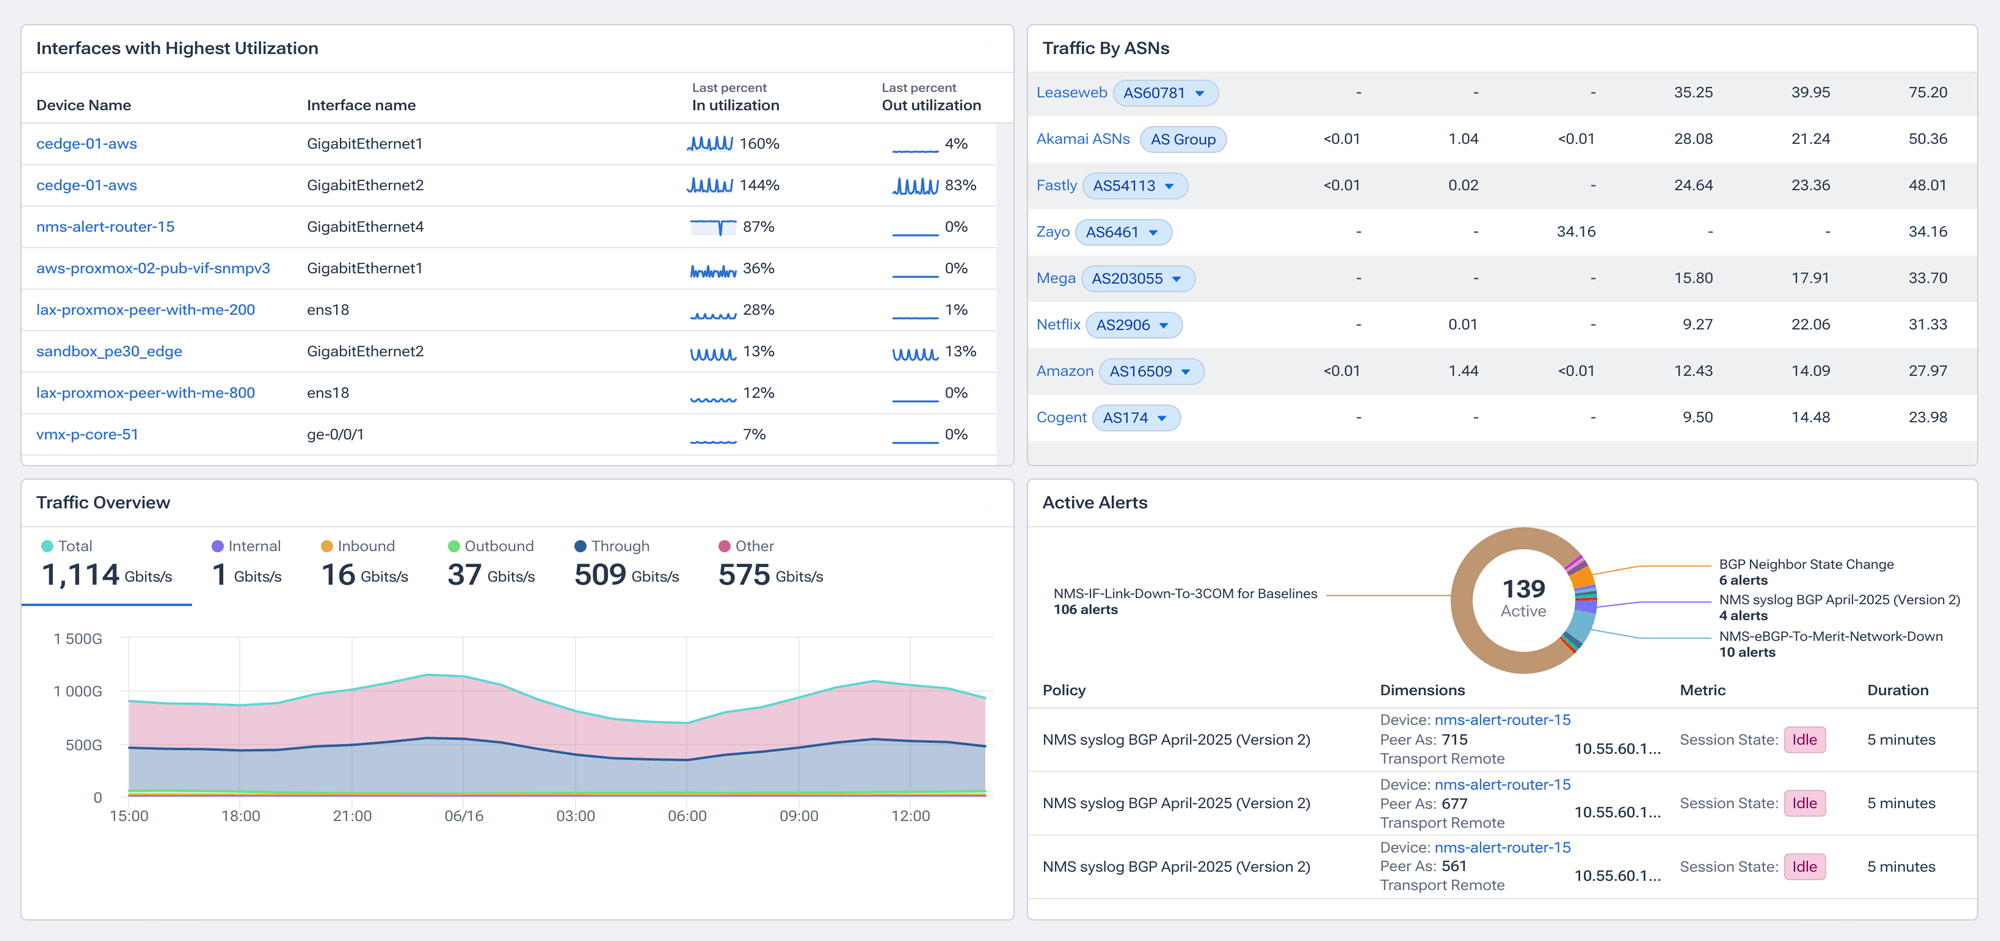
Kentik is the first network intelligence platform to unify world-class flow analysis with cutting-edge metrics and device monitoring.

When you bring flow analysis and network monitoring together in one system, you’re not just unifying tools – you’re unifying your thinking. Engineers can finally reason about traffic and infrastructure as two sides of the same coin, using the same timeline, same context, and the same UI.
No more bouncing between tabs or cross-checking timestamps. When an alert fires on an interface, you can immediately see what traffic was on that interface at that moment. You can ask, “Is this spike the problem or the result of one?” and get an answer in seconds.
This matters because modern troubleshooting is about navigating ambiguity quickly. Sometimes the traffic pattern is the clue, and sometimes it’s the outcome. Only when flow and metrics are side-by-side can you trace causality with confidence – not with hunches or heroics.
Learn how AI-powered insights help you predict issues, optimize performance, reduce costs, and enhance security.

And once both data types are in one place, AI can do its job properly. Kentik can correlate flow and metrics to surface what is most likely contributing to a change, highlight anomalies, and even suggest root causes – all without requiring you to build dozens of saved views or manually create filters.
This is the kind of speed and clarity that modern NetOps teams need – whether you’re trying to cut down MTTR, plan for capacity, or just get ahead of the next finger-pointing incident.
Better planning, better ops, better together
By embracing unified network telemetry, organizations can break down operational silos and foster collaboration between teams. This shift from isolated tools to a cohesive platform isn’t just about incident response; it also enables engineers to proactively manage the network’s health and performance. Capacity planning transitions from anecdotal to evidence-based, with clearly identified traffic drivers, at-risk interfaces, and potential capacity runouts. Reporting becomes simpler, alerting smarter, and the entire team adopts a more integrated mindset. You start to finally move beyond network operations and management to true network intelligence that supports the business.
Want to see it in action? Reach out. We’ll show you what unified network intelligence looks like — and how it can change the way you troubleshoot.


