Summary
To monitor your SaaS applications, it has to be done by thinking creatively. Traditional tactics lack insight. It’s time to consider synthetic monitoring.
One of the positive things that came out of events in 2020 was that many of us started working from home. At first, it was kind of weird. But once we realized that what we needed was available online, it became easier. All we had to do was figure out a few new apps, like Slack, Asana and Google Docs. Then, after a couple of weeks of working from home, many of us started having thoughts like, “I wonder if I could wear shorts and my favorite slippers? I mean, no one sees me from the waist down.”

Yeah, it’s awesome, isn’t it? But, we also learned something else: When there is a network problem, we have to figure it out ourselves, which is less awesome.
Leading up to SaaS offerings, everything we communicated with over the network to do our jobs (other than surf the web and send email) was hosted on-premises. The mail server, the CRM, the file servers, etc. were all hosted in the corporate data center. If we had a connection problem, we’d call over the cubical something like, “Hey Darla, can you see the Skywalker server? I’m having trouble connecting.” Depending on how that went, we’d try a few things and then call the help desk. Loaded with SNMP tools like HPOV, Wireshark and Telnet, the network team could figure out the connectivity problem and get us back up and running.
Sitting at home and struggling to connect to Chorus or Monday.com, or having intermittent issues with a Zoom connection, we’ve all pretty much all settled in on doing our own troubleshooting or reshuffling our workloads until internet connectivity issues clear up. Is this really the way it’s going to be going forward? Are those who work from home forced to solve their own network-related problems? Is there no other way?
It’s time to get creative
While the internet is just a network, the problem is that your company cannot get end-to-end visibility with traditional network monitoring tools. The NetOps team can’t Telnet to routers and look at routing tables, and they can’t change routes or span a port to collect packets. This all means that traditional tools won’t provide the value they once did. As a result, we have to get creative and come up with new tools to regain visibility. The SaaS apps that many of us are using are likely hosted somewhere across the internet. And if the problem isn’t in your home, it’s somewhere between your home and a server located in a data center — who knows where?
Should you tolerate interruptions?
There are ways to gain visibility into the cloud path of application latency. But, even if you can identify the service provider introducing the problem, what can you do about it?
And, wait, back up a minute. Aren’t intermittent connectivity issues expected and even tolerated so long as they aren’t excessive? How do you know when a connection issue is excessive? This is when you have to decide on whether to do something about the problem or go on tolerating the interruptions.
Strength in numbers
If you are using an application that hundreds or thousands of others in your organization are using, there is strength in numbers. Reporting the issue to the help desk or even your peers is a great starting point. It’s like voting; it’s how individual contributors can make a difference. When enough people complain about the same SaaS, it gets attention. Someone will take notice, pour through the complaints, and do some homework. They will determine if the problem is the SaaS or something along the internet path, and they will need evidence to take action. This means that it’s time to get creative about how we measure performance.
Synthetic monitoring
When companies have many employees working remotely and relying on the same SaaS applications, they like to reinforce complaints with supporting evidence. In the post on “How to monitor packet loss and latency in the cloud,” the topic of using synthetic monitors was outlined. These are small software agents that measure performance (e.g., latency, packet loss, jitter and more) from distributed locations, much like work from home employees.
Hop-by-hop diagnostics
What needs to be emphasized here is that synthetic monitors can also perform diagnostics which allow NetOps to learn where in the internet path (hop-by-hop) potential problems are being introduced. See the example below:
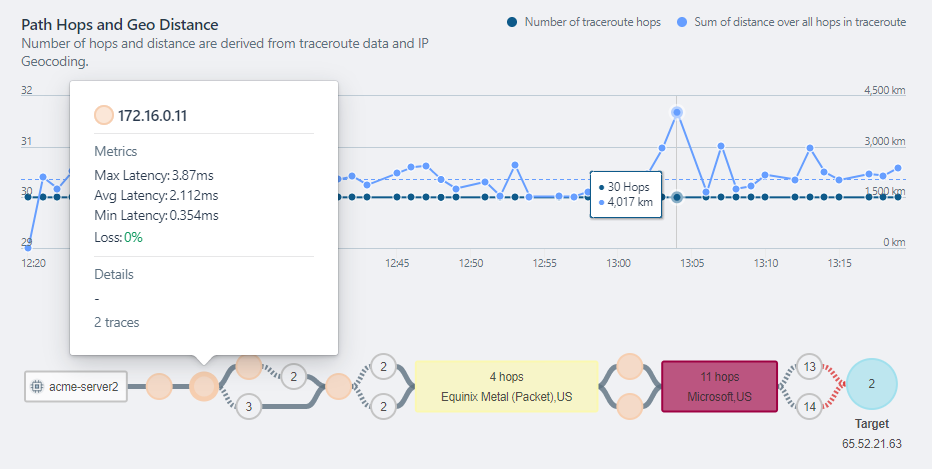
If you have several probes all reporting issues with the same isolated router hop, there is strength in numbers. To take advantage of this, the data can be trended over time. This is where repeat offenders become obvious. Once you have collected the clear indicators of a problem, the data can be shared with the service provider that is responsible for the router in question. Hopefully, they can replace the router or route your traffic around it.
Proactively monitoring SaaS applications
Ideally, the applications we depend on are constantly monitored from our perspective. Synthetic monitors can help here as well. These tiny applications can run on small computers such as a raspberry pi or even a container on your computer. If you are working with a vendor like Kentik, you’ll have hundreds of these agents, already deployed around the world, which can be used to monitor the applications you care about. Take for example, the list of monitored applications below.
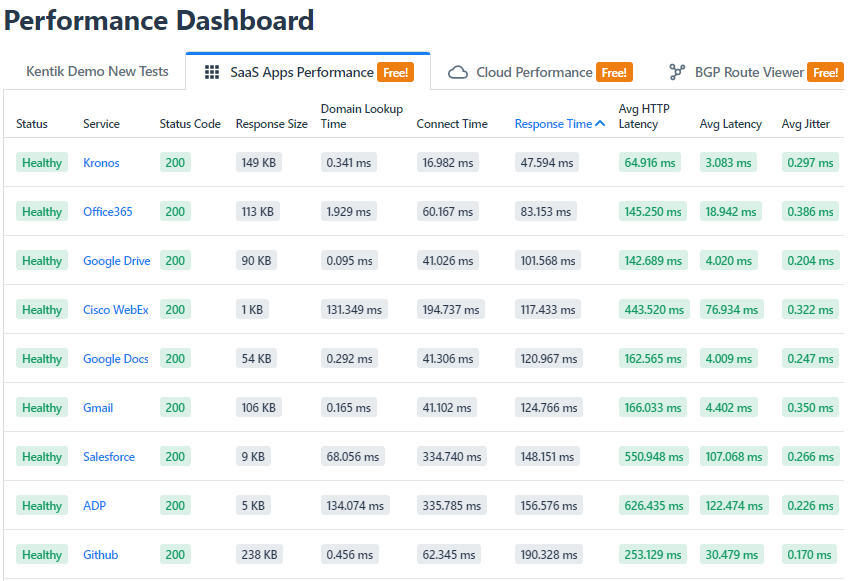
Above, all of the critical SaaS applications that the business depends on are monitored. Each of the applications can be monitored by one or more synthetic agents. For example, if Office 365 were to incur latency, it would change color, and clicking on it would bring up a map indicating the area of the world that is experiencing trouble with the application.
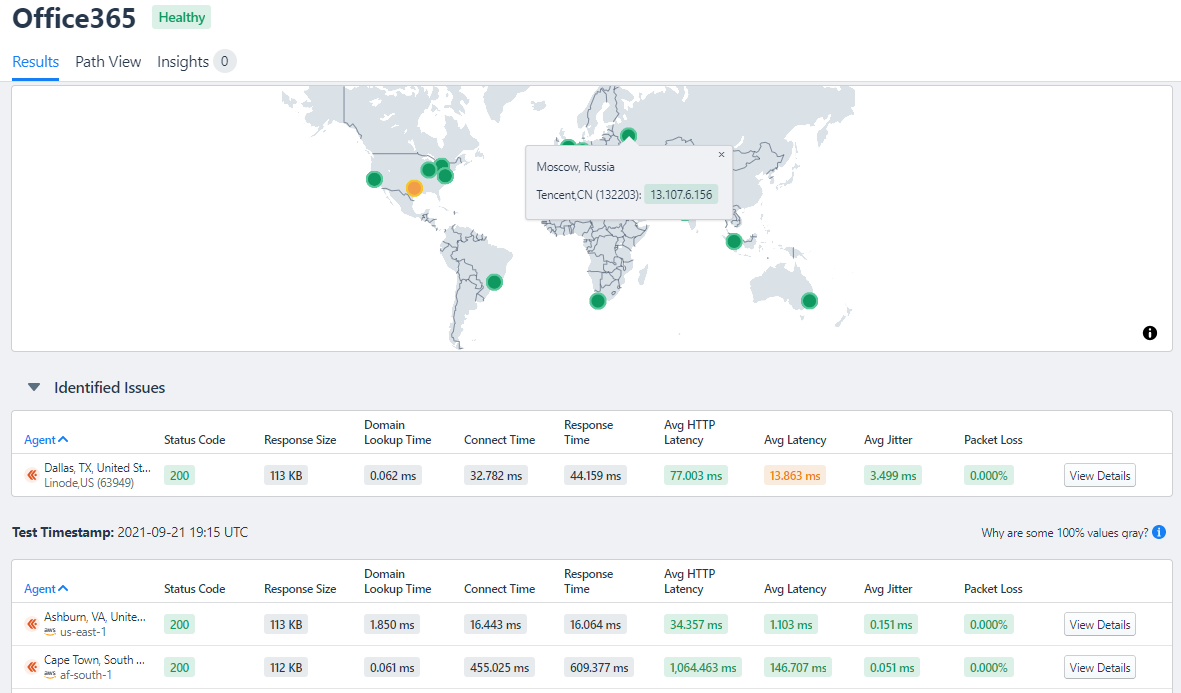
By clicking on “Path View” or the “Timeline” button (not shown), it becomes clear how frequently the problem is occurring, as well as which service provider is introducing it. The workflow makes it simple to narrow in on the source of the problem.
In summary
Working from home is great, but in some ways it makes us our own IT department. That’s not practical at scale. A better approach is to have your company centrally monitor SaaS applications using globally distributed synthetic testing agents, like those provided by Kentik.
If you’d like to learn more about how to monitor your SaaS applications with the Kentik Network Observability Cloud, reach out to our team for a demo or to start your evaluation.

