Kentik Delivers a “Networker’s Dream” for Large Enterprise’s Global Network Operations
Overview
One of Kentik’s customers is a large enterprise that provides human capital management solutions to more than 50 million people in over 100 countries. The company uses the Kentik platform to provide comprehensive observability for its globally distributed network infrastructure.
Situation
The Kentik customer in this case study is a leader in human capital and workforce management solutions, with more than $1 billion in revenues. It employs more than 5,000 employees in 50 offices around the globe. With thousands of customers in more than 100 countries, the company’s solutions touch over 50 million people.
With its operations and customers spread across the globe – and virtually all new customers opting for cloud-based solutions – the company’s network infrastructure becomes more complex, and mission-critical, every day. Maintaining the network at peak effectiveness is the responsibility of the chief IT architect and senior director of networks and security.
The chief architect’s core technology group provides computing and communications services for the entire company, operating through a headquarters data center and seven co-location facilities around the world.
“Our customers expect 24/7 availability, so the functionality and optimal performance of our network infrastructure are absolutely essential,” the chief architect says. Recent changes – including the adoption of SD-WAN technology at the edge – have added to network complexity. And the more the network grows in size and complexity, the greater the challenge of network management and observability.
Solution
The chief architect employs a variety of sophisticated tools to monitor, control and secure various aspects of his network infrastructure. But for the most comprehensive view of how it’s performing, the chief architect uses the Kentik platform.
The chief architect mantra for monitoring observability is simplicity. “It should be very easy to see if everything is performing properly or if there’s any issue that needs attention. If you make a dashboard so confusing that you can’t find anything, it’s of no help. You want a simple, at-a-glance means of getting pertinent information right away.”
What makes Kentik particularly valuable to the chief architect, then, is its simplicity and flexibility. “With Kentik, I can immediately determine if my global load balancing is having a problem. If I see something that is out of whack, I can pull up performance data and quickly identify the issue. It takes just seconds.”
The beauty of Kentik, the chief architect explains, is the combination of detailed information about network performance with extreme ease of use. “Kentik visualizes things better than just about anything I’ve ever used. And if I need to slice and dice the data, it’s all there with just a click.”
Results
The challenges of monitoring a complex global network were exacerbated when the COVID-19 pandemic forced virtually all of the company’s workforce to work from home. But that challenge was met handily by Kentik.
“It was fascinating to me to be able to see everybody working from home – what applications they’re using, the bandwidth they’re getting, and how all the traffic is flowing through our systems,” the chief architect says.
As soon as everyone started to work from home, the chief architect notes, “people were putting in trouble tickets complaining about network speed. With Kentik, we were able to pull up the details and see exactly what was happening. For example, in a few cases, it was the kids at home playing video games. So, of course, that was affecting performance. Consequently, with the granular visibility afforded by Kentik, we were in a position to help our global workforce optimize the results of working from home.”
A Broad Range of Use Cases
“The first time we turned Kentik on in production, I caught a couple problems right away in our server configurations. Things like this that you can see immediately are hugely valuable,” the chief architect adds.
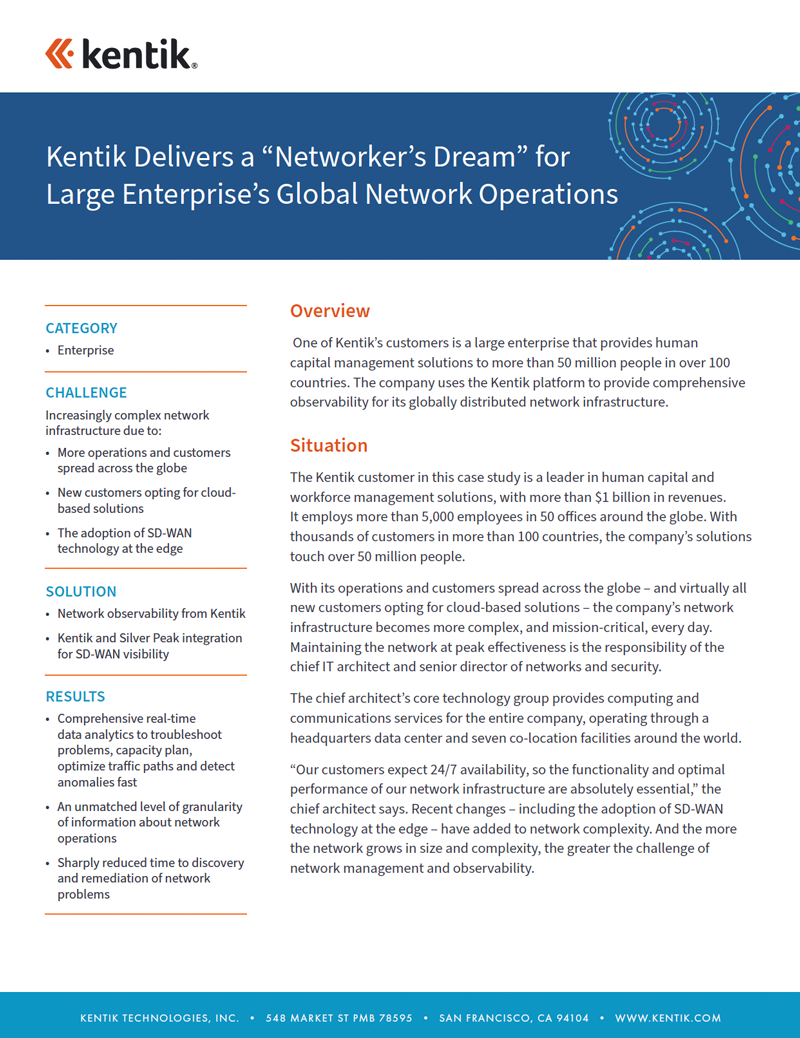
The company uses Kentik for a variety of uses, including measuring network performance, monitoring for anomalies, troubleshooting problems, capacity planning and optimizing traffic paths.
A frequent application for Kentik is resolving complaints about network performance.
“The first thing people do when their application slows is blame the network,” the chief architect says. “With Kentik, we can show them specific, detailed charts that show exactly the bandwidth they’re getting. And in just about every case, they see they’re getting plenty of bandwidth and that the network is not at fault.”
Before Kentik, the company’s core technology team would have to use other tools to examine individual devices in an attempt to resolve complaints about network performance. That took time, and the level of detail wasn’t close to what Kentik provides. “With Kentik, we can see applications, user names, even what a single IP address is doing.”
The flexibility of Kentik also has impressed the chief architect’s team. One of the company’s network engineers has built several special-purpose tools based on the Kentik platform. One is a color-coded heat map that quickly shows the level of network traffic by country, state or other operational designation. And a tunnel meter clearly displays metrics such as average throughout and peak throughput for each co-lo facility.
“With Kentik, we can see every part of our network at a very granular level,” the network engineer says. “We never had that visibility before.”
Using the Kentik and Silver Peak Integration for SD-WAN
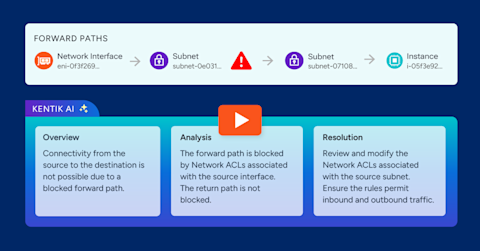
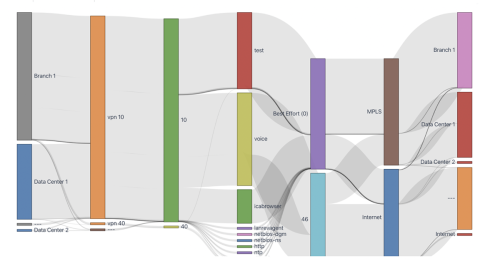
The company was an early user of SD-WAN technology, and the chief architect highly values the tight integration between Kentik and the company’s SD-WAN supplier, Silver Peak. With the overlays provided by Kentik, network administrators gain a full understanding of link utilization and traffic flows and apply those insights to troubleshooting, capacity planning and network optimization for more cost-effective underlay and transport services.
“When we went to SD-WAN, we lost a lot of visibility into our network and couldn’t see a lot of what was happening,” the chief architect recalls. “So, when Kentik and Silver Peak announced their collaboration, that was a big plus.”
“Looking at the Kentik overlay on Silver Peak, I can see in an instant if there’s a problem in my traffic flow,” the chief architect says. “It’s a networker’s dream.”
The company employs the Global Protect end-point security client from Palo Alto Networks and uses the Kentik platform to monitor that activity as well. “On one screen, I can see Global Protect activity for everyone connected in the U.S. and in a single glance can immediately get a feel for how well everything is running. You can see trends and tendencies that you wouldn’t notice if they weren’t represented so graphically.”
Insights from Kentik also contribute to the company’s security strategy. For example, the company uses Vectra for threat vector analysis as a means of troubleshooting engineering issues. By deploying Kentik as an overlay to Vectra, data resolution is greatly improved by providing granular visibility down to the application and user-name level, “From a security perspective you can look for anomalies on the dashboards and you’ll see very quickly if something is wrong.”
Key Takeaways
The chief architect and the network engineer cite several differentiating features and benefits of Kentik:
- An advanced user interface that makes insights about network performance instantly understandable;
- An unmatched level of granularity of information about network operations;
- The flexibility to tailor metrics and dashboards to specific needs;
- Sharply reduced time to discovery and remediation of network problems; and
- Comprehensive real-time data analytics instead of SNMP sampling.
The chief architect summarizes: “Kentik is an observable – and absorbable – representation of what’s happening on the network presented in terms I can easily understand.”
CATEGORY
- Enterprise
CHALLENGE
Increasingly complex network infrastructure due to:
- More operations and customers spread across the globe
- New customers opting for cloud-based solutions
- The adoption of SD-WAN technology at the edge
SOLUTION
- Network observability from Kentik
- Kentik and Silver Peak integration for SD-WAN visibility
RESULTS
- Comprehensive real-time data analytics to troubleshoot problems, capacity plan, optimize traffic paths and detect anomalies fast
- An unmatched level of granularity of information about network operations
- Sharply reduced time to discovery and remediation of network problems
Platform
Solutions
- Reduce Cloud Spend
- Migrate To and From Any Cloud
- Improve Cloud Performance
- Optimize Enterprise WAN
- Network Performance Monitoring
- Deliver Exceptional Digital Experiences
- Detect and Mitigate DDoS
- Harden Network Policy Management
- Investigate Security Incidents
- Visualize All Cloud and Network Traffic
- Troubleshoot Any Network
- Understand Internet Performance
- Optimize Data Center Networks
- Consolidate Legacy Tools
- Optimize Peering and Transit
- Plan Network Capacity
- Reduce Network Spend
- Grow Subscriber Revenue


