SD-WAN Analytics: What It Is, Key Metrics, and Monitoring Use Cases
SD-WAN promised simpler WAN operations, better application performance, and the flexibility to use multiple transports (MPLS, DIA, broadband, LTE/5G). But once policies, overlays, and cloud paths are in motion, it becomes easy to lose visibility into what users are actually experiencing and why.
That’s where SD-WAN analytics comes in. It helps NetOps teams prove that the SD-WAN is delivering the performance, reliability, and security outcomes it was designed to achieve, across branches, clouds, and remote users.
What is SD-WAN Analytics?
SD-WAN analytics is the collection, correlation, and analysis of SD-WAN data (flow, tunnel/overlay telemetry, underlay circuit metrics, and control-plane signals) to measure application experience, validate routing and policy decisions, and troubleshoot performance or availability issues across the WAN.
In practice, SD-WAN analytics answers questions like:
- Which applications are affected, and at which sites?
- Is the problem in the underlay (ISP/circuit loss, latency, jitter) or the overlay (tunnel health, path selection, policy)?
- Did a policy change shift traffic onto an unexpected transport or region?
- Are performance issues localized to a branch, a provider, a cloud region, or a specific path?
The most useful SD-WAN analytics platforms provide underlay and overlay visibility together, so teams can connect user-impacting symptoms (slow apps, voice jitter, SaaS timeouts) to the actual path, transport, and policy behavior driving them.
Kentik in brief: Kentik is a network intellgience platform that provides SD-WAN analytics across overlay and underlay by correlating traffic, circuit health metrics, and performance tests. Monitor MPLS, DIA, and broadband side-by-side, validate steering policies to SaaS and cloud apps, and quickly pinpoint whether an issue is policy, transport, provider, or upstream path behavior.
Learn how AI-powered insights help you predict issues, optimize performance, reduce costs, and enhance security.

The shift from WANs to SD-WANs
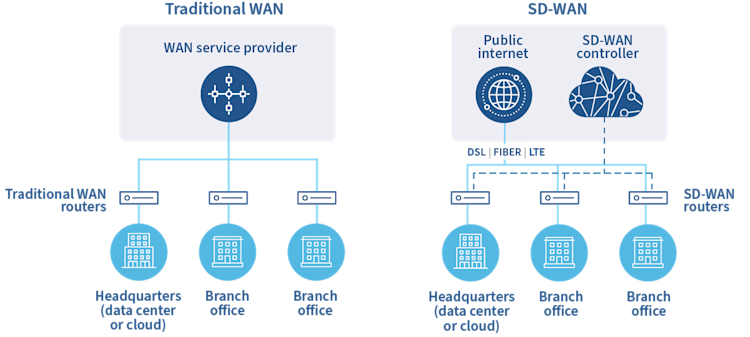
To understand the role played by SD-WAN analytics in modern network operations, it’s first necessary to understand the goals that businesses seek to achieve when shifting from WANs to SD-WANs.

One of the main reasons why organizations migrate from WANs (which use physical hardware to manage network connections and traffic) to SD-WANs is that modern network operations often involve complex, distributed applications that are hosted in the cloud. Compared to traditional monolithic applications that run inside a local data center, modern applications generate more connections and much higher volumes of traffic. Some of the most common reasons why include:
- Microservices: In applications that use a microservices architecture, each microservice relies on one or more network connections to communicate with other microservices.
- External services and integrations: Modern applications frequently need to connect to a variety of third-party services — such as an object storage service that they use to store data and an IAM service that they use to manage access.
- Distributed hosting architectures: Cloud-based applications may have different components running in multiple cloud regions — or even multiple clouds — at the same time. Each component relies on the network to communicate with other components.
- VPNs and VPCs: Today’s applications often use software-defined networking configurations, like VPNs and VPCs, to restrict access to resources via the network.
Although it’s technically possible to manage complex networking requirements like these using a WAN, SD-WANs are more efficient and easier to work with because they allow teams to define complex networking rules using software, rather than having to configure physical devices to handle each facet of network operations. In addition, because a single SD-WAN can typically manage all of an organization’s networking requirements through a single interface, SD-WANs simplify administration and help to centralize network monitoring.
The need for SD-WAN analytics
Because WANs are usually used in cases where network operations are simple, there is typically relatively little data that you can collect and analyze from a WAN. You can monitor basic metrics like packet loss and latency for your applications as a whole, and you may be able to analyze WAN performance data on a per-user or per-location basis. Beyond this, however, there is little granularity or nuance associated with traditional WAN monitoring.
When you manage your network using an SD-WAN, however, end-to-end network monitoring is a paramount priority for ensuring that SD-WANs can adequately handle the complex networking configurations that they are intended to support. Without carefully monitoring your SD-WAN, you may fail to detect performance issues such as high latency within traffic between two cloud services or improper network load balancing across redundant cloud regions.
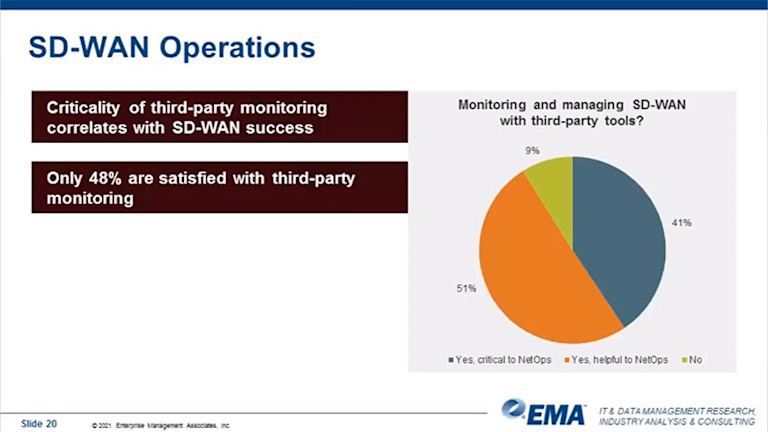
In other words, SD-WAN analytics is the only way to know that your SD-WAN is actually achieving what you intend it to achieve. Without deep visibility into the health of your SD-WAN via analytics, you run the risk of investing in an SD-WAN that fails to deliver the agility and reliability that distinguish SD-WANs from conventional WANs.
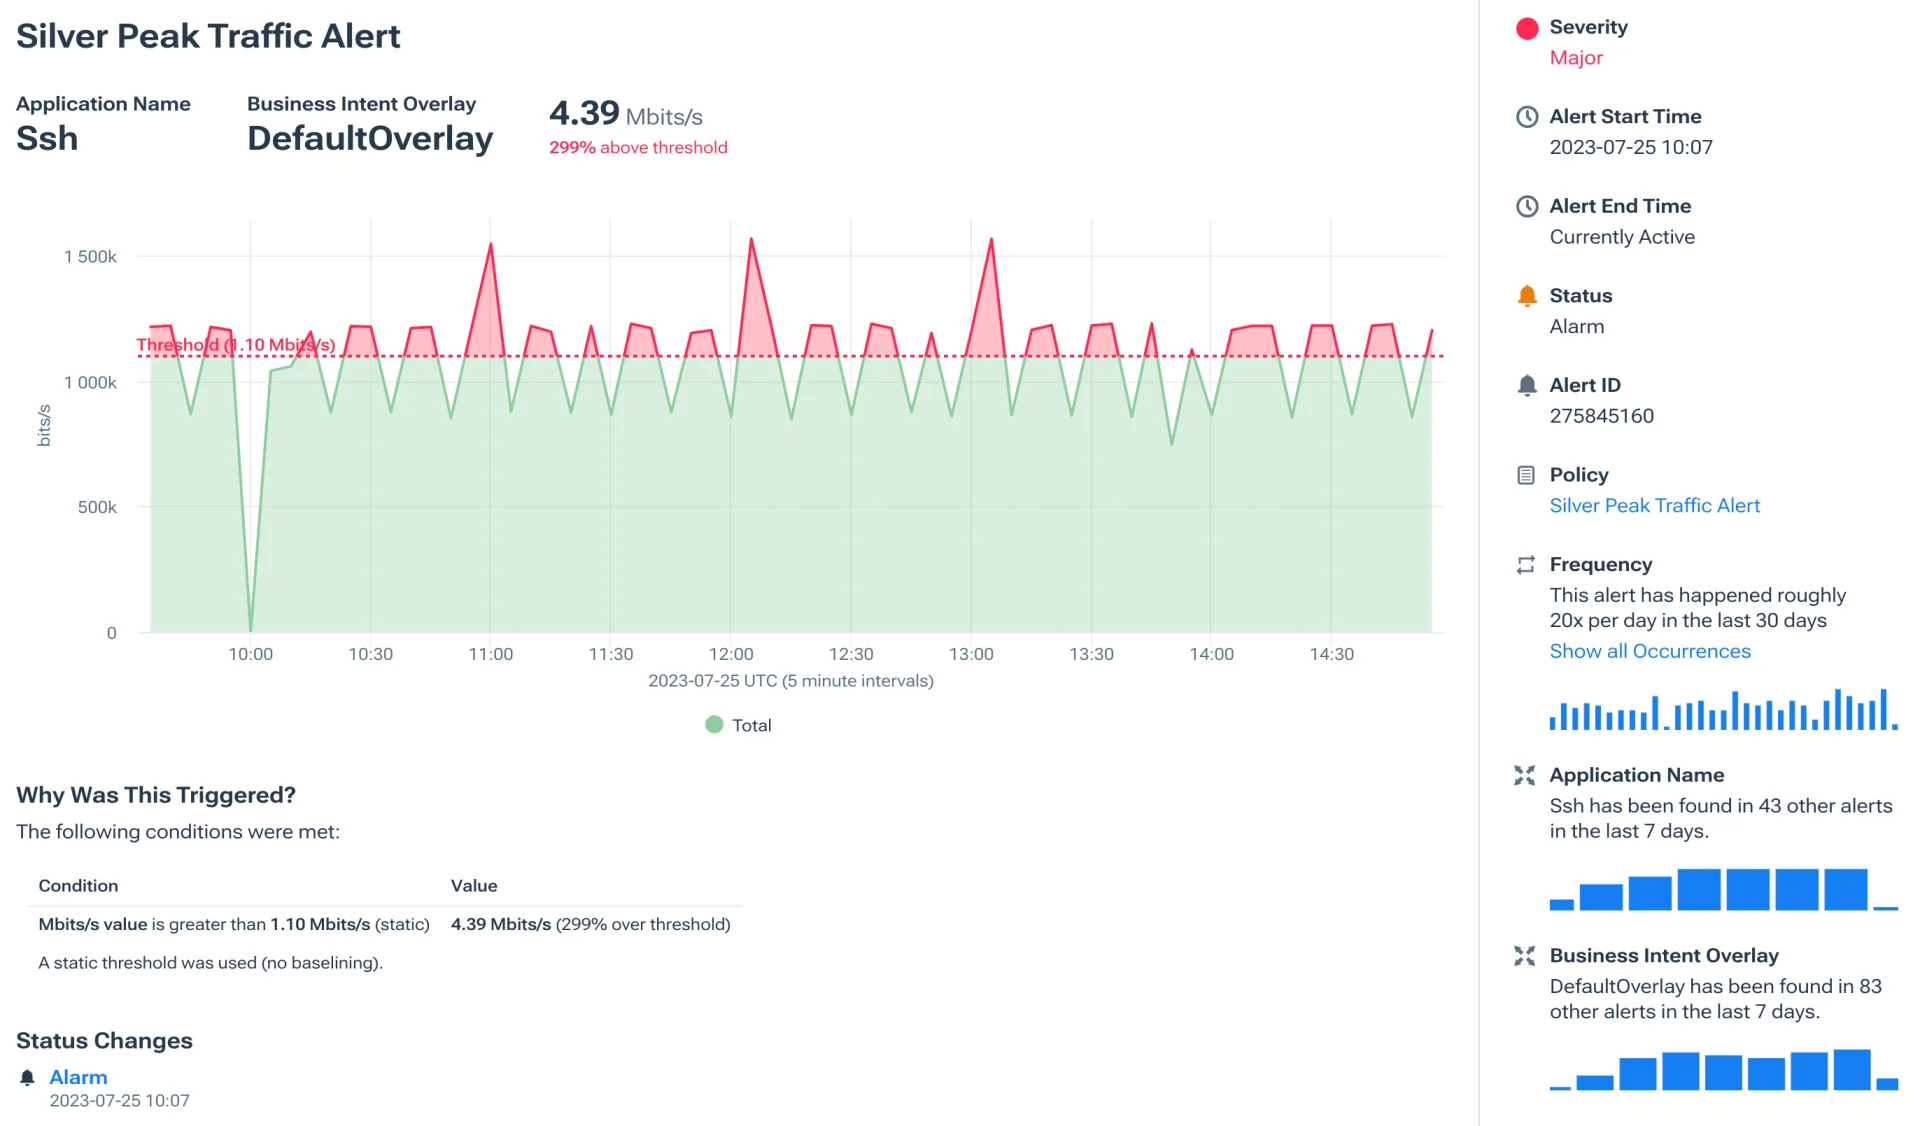
SD-WAN analytics can also play a role in security by exposing unusual traffic patterns or other anomalies that may be signs of a breach. Although complete network security requires much more than just SD-WAN analytics, the latter offers one means of detecting security issues that you may otherwise miss.
Features of SD-WAN analytics
No two networks are identical, and SD-WAN monitoring and analytics solutions should always be tailored to the architecture of your organization’s SD-WAN, as well as the monitoring goals that you prioritize. However, in general, you should expect any SD-WAN solution to deliver a core set of features, including:
- Automated collection of SD-WAN data from across all transport circuits, network services and endpoints, including network flow data.
- Automated analysis of SD-WAN data using artificial intelligence or machine learning, which can alert network admins to complex networking trends or anomalies that would be hard to detect manually.
- The ability to “slice and dice” SD-WAN analytics results so that admins can analyze the performance and security of individual network components (such as VPNs, VPCs, specific types of services or a collection of endpoints) in addition to monitoring the SD-WAN as a whole.
- Integrations that allow SD-WAN analytics tools to share data with other types of monitoring and security tools, such as network intelligence platforms.
- Support for deploying SD-WAN analytics monitoring tools in any location — from on-premises servers, to private data centers, to public and hybrid clouds.
- Automated alerts so that your team knows immediately when a problem occurs within the SD-WAN.
SD-WAN analytics is about translating SD-WAN data into operational outcomes. Solutions like Kentik SD-WAN monitoring allow you to:
- Monitor SD-WAN health and application performance across branches: Kentik provides underlay and overlay visibility for SD-WAN environments, letting you see transport status, tunnel behavior and per-application traffic across branch sites so you can track both SD-WAN health and application performance from the same platform.
- Validate SD-WAN policy changes before rollout: By analyzing current traffic flows and overlay-to-underlay mappings in Kentik before a rollout, you can predict how SD-WAN policies will shift traffic and ensure capacity and paths align with your intent, reducing the risk of surprises after changes go live.
- Validate SD-WAN underlay vs overlay performance: Kentik shows both underlay circuit metrics and overlay traffic behavior, so you can compare how policies are using transports, whether overlays are sending traffic over the best-performing underlays and whether observed performance issues map to underlay limitations or overlay misconfigurations.
SD-WAN Analytics and Planning
While the core use case for SD-WAN analytics involves monitoring an SD-WAN once it is up and running, an additional role that SD-WAN analytics can play is helping teams to validate network configuration plans before they are implemented.
SD-WAN has displaced traditional WAN in many enterprises, but visibility across transports and user environments remains critical. Kentik SD-WAN monitoring and its core flow/telemetry analytics let you monitor MPLS, DIA, broadband and other transports in a single interface so you can see health and usage for all circuits side-by-side regardless of provider or technology. If remote/home users connect through SD-WAN or managed client VPNs routed through your monitored infrastructure, Kentik can include their traffic in the same analytics pipeline — giving you visibility into remote-work performance, branch link health, and aggregate WAN behavior.
Admins can define the requirements that an SD-WAN needs to meet, such as the bandwidth and latency baselines it needs to ensure for different transport circuits. Then, they can deploy SD-WAN analytics tools to help assess the ability of their proposed SD-WAN configuration to meet those requirements.
Using SD-WAN analytics to test configurations before you roll out an SD-WAN (or before you make changes to an existing SD-WAN configuration) helps avoid unforeseen performance or security issues and reduces the number of networking problems that impact live production environments. By analyzing current traffic flows and overlay-to-underlay mappings in Kentik before a rollout, you can predict how SD-WAN policies will shift traffic and ensure capacity and paths align with your intent, reducing the risk of surprises after changes go live.
SD-WAN Analytics with Kentik
Today’s cloud-centric enterprise WAN landscape demands more than just deployment. It requires deep awareness, comprehensive visibility, and proactive network monitoring. Kentik helps with SD-WAN monitoring and enterprise WAN optimization—improving routing, security, and network operations.

To explore the future of networking and see how Kentik can redefine your enterprise WAN and SD-WAN experience, start a free trial or request a personalized demo today.
FAQs about SD-WAN Analytics
How do I monitor SD-WAN health and application performance across branches?
Kentik gives full-fidelity visibility into SD-WAN health: from underlay transport (link status, bandwidth, utilization) to overlay traffic—letting you track application performance, inspect site-to-site connectivity, and see transport behavior across all branches in one place.
How do I validate SD-WAN policy changes before rollout?
Before you flip the switch, you can use Kentik’s synthetic testing agents to simulate/anticipate traffic flows and overlay behavior — analyzing current transport usage, overlay-to-underlay mapping, and likely traffic shifts — to validate whether your SD-WAN policy changes meet performance or capacity goals. This makes roll-outs of policy changes less risky.
What techniques help validate underlay vs overlay performance in SD-WAN?
Kentik uniquely shows underlay and overlay side-by-side: you can view each transport circuit (MPLS, broadband, DIA, etc.), monitor overlay tunnels, and map real traffic flows on both — letting you verify that overlay policies are using the right underlay circuits, and that performance aligns with expectations.
How do I monitor MPLS, DIA, and broadband circuits in one platform?
Kentik SD-WAN Monitoring consolidates transport-type visibility. Whether you’re running MPLS, DIA, broadband or a hybrid mix, Kentik ingests traffic and telemetry data across all circuits — giving you a unified platform to monitor all WAN/underlay links side-by-side.
How do I monitor performance for remote workforces and home networks?
While Kentik can’t instrument every home Wi-Fi router, it can monitor the VPN gateways, SD-WAN edges and cloud entry points that remote workers use and, with synthetics from those edges to SaaS and ISP regions, helps you determine whether problems are in your network, the user’s ISP or the SaaS path.
What’s the best way to monitor satellite and wireless WAN links?
If your satellite or wireless WAN devices export flow or telemetry data (or are part of your SD-WAN underlay/overlay), Kentik can treat them just like any other link — providing a single dashboard for MPLS, broadband, wireless, or satellite transport monitoring.
How do I get visibility into overlay tunnels and underlay health simultaneously?
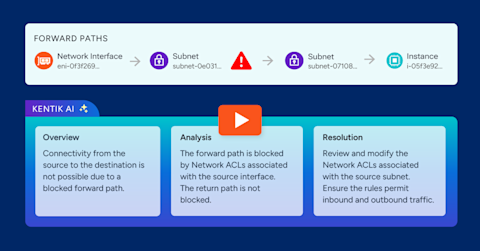
Get simultaneous visibility by correlating overlay tunnel telemetry and control-plane signals with underlay circuit metrics and real traffic flows so you can see whether problems originate in the physical transport or the logical SD-WAN overlay. Kentik supports this by showing underlay circuits and overlay tunnels side-by-side and correlating both layers with real traffic so teams can troubleshoot performance issues and validate steering intent.
What techniques help validate underlay vs overlay problems in SD-WAN?
Validate underlay vs overlay by measuring each layer independently, then correlating results: check underlay health (loss, latency, jitter, errors per circuit) and compare it to overlay tunnel behavior and policy steering outcomes to determine where degradation begins. Kentik supports this by mapping overlay and underlay performance together so teams can pinpoint whether issues are transport-related, overlay-related, or policy-related and then confirm fixes after reroutes or provider changes.
How do I validate QoS and class-of-service policies end-to-end?
Validate QoS end-to-end by measuring outcomes, not just configuration intent: confirm that the traffic classes you care about maintain acceptable latency, jitter, loss, and throughput across each segment and correlate regressions with path, congestion, or policy changes. Kentik supports this by correlating SD-WAN analytics, traffic telemetry, and experience tests so teams can verify whether policy decisions are delivering the intended application experience in practice.


