Network Monitoring Architecture: Three Pillars of Modern Network Monitoring
This article discusses the central components of modern network monitoring architectures, focusing on the three key pillars: Traffic Analysis, Synthetic Testing, and Network Infrastructure Metrics. Each plays a crucial role in maintaining network integrity and agility.
What is Network Monitoring Architecture?
Network monitoring architecture is the structured framework of tools, telemetry, and workflows that NetOps teams use to monitor and manage a network’s performance, health, and security. At its core, this architecture defines how data is collected, correlated, and presented so teams can continuously track traffic flows, monitor device health, detect anomalies, and ensure efficient, reliable data delivery across the network.
A robust network monitoring architecture typically consists of several key components:
-
Data Collection Tools: Gather information about traffic, device status, and system performance using protocols like SNMP and NetFlow.
-
Analysis Software and Services: Interpret collected data to identify patterns, anomalies, and risks, essential for understanding network behavior.
-
Alerting Systems: Provide immediate notifications about irregularities or potential failures for quick intervention.
-
Reporting Mechanisms: Synthesize monitored data into actionable insights for strategic network decisions.
Network monitoring architecture is the backbone of network management, ensuring that all interconnected devices and services operate harmoniously and efficiently. It’s about both preventing problems and optimizing performance to support organizational needs.
These core components set the stage for more nuanced aspects, encapsulated in the “Three Pillars of Network Monitoring Architecture.”
What are the Three Pillars of Network Monitoring Architecture?
Network monitoring is a complex and evolving field encompassing three broad technology pillars: Traffic Analysis, Synthetic Testing, and Network Infrastructure Metrics. Each offers specific capabilities to ensure performance, security, and reliability. Modern solutions like Kentik incorporate all of these components, offering an alternative to siloed, legacy tools.
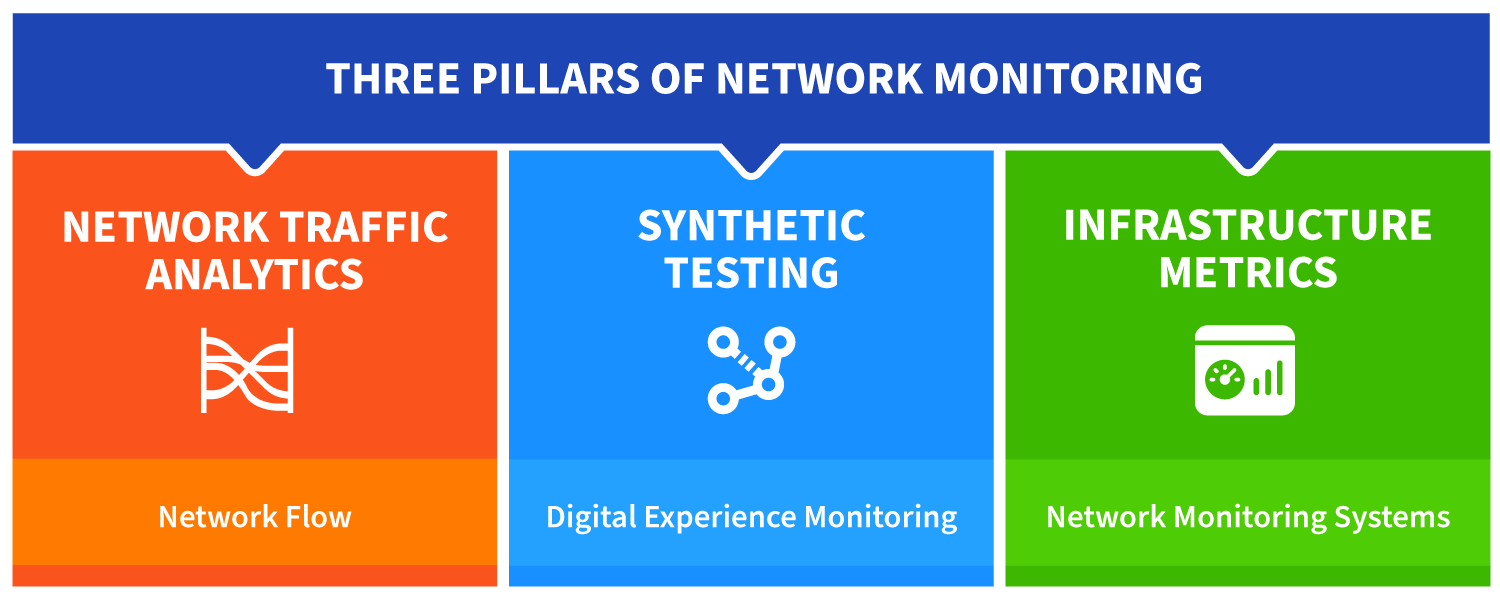
Kentik in brief: Kentik is a network intelligence platform built for modern network monitoring architecture, unifying the three pillars in one workflow: traffic analysis (flow), synthetic testing (DEM), and network infrastructure metrics (NMS). Kentik correlates flow data and cloud flow logs with synthetic tests and device telemetry (SNMP plus streaming telemetry) so teams can move from “something is slow” to the exact path, dependency, or change responsible. With Kentik AI Advisor, engineers can run multi-step investigations across this unified telemetry and get auditable, actionable recommendations.
Learn how AI-powered insights help you predict issues, optimize performance, reduce costs, and enhance security.

Network Traffic Analysis (Flow Analysis)
The first pillar, Traffic Analysis, or Flow Analysis, involves passively monitoring network traffic. This approach offers granular insights into real-world network usage and is critical to understanding network dynamics.
-
Data Sources: Uses flow records, such as those from NetFlow protocols, VPC flow logs from cloud services, and packet traces through Deep Packet Inspection (DPI).
-
Event Analysis: Involves capturing and analyzing network events and changes through log records.
-
Pros of Network Traffic Analysis:
- Provides a detailed view of actual network usage.
- Offers insights into network performance and user behavior.
- Essential for detecting anomalies and potential security threats.
-
Cons of Network Traffic Analysis:
- Primarily limited to existing traffic flow.
- Traditional flow analysis deployments may lag behind real time, especially when data is stored and analyzed on-premises without scalable backends.
- Can be data-intensive, requiring effective data management strategies if deployed on-premises.
Synthetic Testing (Digital Experience Monitoring - DEM)
The second pillar, Synthetic Testing, a critical aspect of Digital Experience Monitoring (DEM), is a proactive approach that tests network functions to emulate actual user experiences. A primary goal of synthetic testing is to anticipate and mitigate performance issues before they impact real users.
- Testing and Data: Synthetic testing involves creating scenarios that mimic user actions to collect data on network responses and performance.
- User-Centric Focus: This technology aims to predict how the network will perform under various user conditions.
- Pros of Synthetic Testing:
- Identifies potential issues from an end-user perspective before they impact actual users.
- Allows for frequent, regular, and automated testing, enhancing preparedness.
- Assists in capacity planning and optimizing user experience.
- Cons of Synthetic Testing:
- Limited to the specific targets and scenarios set up for testing.
- May not capture all real-world conditions or spontaneous network events.
- Requires careful scenario design to ensure relevance and accuracy.
Network Infrastructure Metrics (Network Monitoring Systems - NMS)
The final pillar, Network Infrastructure Metrics, often managed through Network Monitoring Systems (NMS), is about maintaining and optimizing the physical and virtual components of the network infrastructure.
- Monitoring Tools: NMS tools use protocols such as SNMP, Streaming Telemetry, and other advanced monitoring technologies to collect network device metrics such as up/down status, bandwidth usage, memory consumption, and CPU utilization.
- Event Handling: Includes mechanisms like SNMP Traps for real-time alerts on network conditions.
- Pros of Network Infrastructure Metrics:
- Provides direct insights into the health and status of network infrastructure.
- Essential for preventative maintenance and rapid issue resolution.
- Facilitates strategic planning for network upgrades and expansions.
- Cons of Network Infrastructure Metrics:
- May offer limited context regarding end-user experience or specific application performance.
- Requires integration of diverse monitoring tools for a comprehensive view in many cases.
In this short video, Kentik technology evangelist Leon Adato explains the basics of network monitoring and the three technology pillars of modern network monitoring.
Robust Network Monitoring Architectures Integrate All Three Pillars
Integrating Traffic Analysis, Synthetic Testing, and Network Infrastructure Metrics transforms network monitoring from a reactive task into a proactive strategy. This comprehensive approach is vital for:
- Holistic Network Insight: Combining these pillars provides a complete picture of network health, from user experience to infrastructure performance.
- Proactive Problem Solving: The integrated approach allows for preemptive identification and resolution of network issues, enhancing overall network resilience.
- Enhanced User Experience: By ensuring the network is not only functioning—but also optimized—this approach directly contributes to a better end-user experience.
The sophistication and complexity of modern network monitoring, represented by these three pillars, ensure that networks are robust, reliable, agile, and adaptable.
Best Practices for Network Monitoring Architecture Design
Designing a modern network monitoring architecture is about more than selecting tools or deploying point solutions. It’s about building a framework that can support both today’s operations and tomorrow’s network intelligence. The following best practices help NetOps teams design an architecture that scales, adapts, and stays ready for AI-assisted operations.
Unify data for monitoring and management
Avoid siloed tools that each see only part of the network. Instead, use a network monitoring and management architecture that can ingest:
- Flow and routing data from on-prem, WAN/SD-WAN, and internet edges.
- Cloud flow logs, API telemetry, and managed service metrics from public clouds.
- Device metrics via SNMP and streaming telemetry.
- Synthetic tests and digital experience monitoring data.
- Logs and event streams where they add context.
Bringing these data sources together in a single platform is essential for consistent troubleshooting, reporting, capacity planning, and AI-driven analysis.
Balance passive and active monitoring
A resilient architecture balances passive and active techniques:
- Traffic analysis gives you ground truth for how the network is actually used, what applications are talking, and how paths are chosen.
- Synthetic testing provides a controlled, repeatable view of user experience and end-to-end availability, even when live traffic is quiet.
- Infrastructure metrics show the health and performance of devices, interfaces, and services that carry the traffic.
Design with the assumption that each pillar will answer different questions. Together, they form a complete picture of network performance and reliability.
Design for hybrid and multicloud
Modern networks span data centers, campuses, branches, clouds, and the internet. A monitoring architecture should:
- Treat cloud and internet paths as first-class citizens, rather than special cases.
- Support consistent monitoring of VPNs, SD-WAN overlays, cloud gateways, and SaaS applications.
- Visualize hybrid topologies (on-prem, cloud, and interconnects) so teams can see how traffic and dependencies span domains.
This is especially important for AI workloads and other distributed applications, where issues in one domain can cascade into others.
Adopt streaming telemetry where it matters
SNMP remains widely used, but streaming telemetry and modern APIs are critical for high-scale and high-frequency monitoring. Where possible:
- Use streaming telemetry for high-cardinality or fast-changing metrics (such as interface counters, queue depth, and fabric health).
- Reserve SNMP polling for systems that do not yet support more modern approaches, or for metrics that don’t require high-frequency collection.
- Centralize telemetry into a platform that can store, query, and visualize both historical and real-time views.
This architecture provides the data density needed for accurate baselines, anomaly detection, and automation.
Enrich telemetry with business and service context
Raw IP addresses and device names do not tell NetOps which customers, services, or applications are impacted. A robust architecture includes:
- Mappings between network objects and business entities (tenants, customers, services, environments, regions).
- Tags and metadata that describe applications, ownership, and criticality.
- Integration with CMDB, inventory, and cloud tagging systems.
This context is what allows both people and AI systems to focus on what matters most to the business, not just what is noisy.
Build for AI and automation from day one
Even if you are not using AI extensively today, an architecture that plans for network intelligence will pay off over time. That means:
- A clean, unified data model that AI systems can query without custom glue code for every workflow.
- APIs and natural-language interfaces so AI agents and engineers can explore, correlate, and automate using the same platform.
- Clear guardrails and workflows for how automated actions are proposed, approved, and executed.
With these design choices, your network monitoring architecture is ready to evolve from observability to guided, and eventually automated, network operations.
From Network Monitoring Architecture to Network Intelligence
The three pillars of network monitoring architecture—traffic analysis, synthetic testing, and network infrastructure metrics—form the observability fabric of a modern network. But on their own, they primarily answer what is happening in the network. As environments grow more complex and distributed, NetOps teams also need to understand why something is happening, who or what is impacted, and what to do next. That’s where network intelligence comes in.
In a network intelligence model, the three pillars act as the data plane for a higher-level network intelligence layer. Flow and routing data, SNMP and streaming telemetry, logs, cloud and container metadata, and synthetic test results are all ingested into a unified data platform. There, they are normalized, enriched with business and service context, and made available for advanced analytics and AI.
This architecture allows AI and machine learning systems to:
- Learn baselines and automatically detect anomalies across traffic, devices, applications, and user experience.
- Correlate symptoms across multiple data types to explain the likely root cause and blast radius of an issue.
- Predict risk to SLAs and capacity (for example, when links will run hot or when an AI fabric might become congested).
- Guide NetOps engineers, or even execute agentic workflows, to troubleshoot and remediate problems.
A well-designed network monitoring architecture becomes the foundation for network intelligence. Observability tells you what is happening in the network. But network intelligence, built on top of that architecture, turns telemetry into answers, recommendations, and eventually, closed-loop action.
Network Monitoring and Management: From Architecture to Operations
Even the most sophisticated network monitoring architecture is only valuable if it improves day-to-day network monitoring and management. The three pillars, combined with a network intelligence layer, translate directly into better operations for NetOps and SRE teams.
On the monitoring side, unified telemetry and topology views reduce mean-time-to-detect (MTTD) and make it easier to see emerging issues before they become outages. Engineers can move from “which interface is red?” to “which service, customer segment, or workload is at risk?” in a few clicks or a single query.
On the management side, the same architecture powers:
- Proactive capacity planning, using traffic trends and device metrics to anticipate when links, nodes, or cloud constructs will need upgrades.
- Change validation and post-change analysis, combining synthetic tests, flow data, and metrics to confirm that a new route, policy, or cloud deployment behaves as intended.
- Policy and cost optimization, where traffic paths, peering relationships, and cloud egress choices can be tuned based on both performance and economics.
When the monitoring architecture is integrated with network intelligence, it also becomes an engine for AI-assisted NetOps. AI systems can suggest investigative pivots, explain likely root causes, highlight hidden dependencies, and recommend remediation steps. Over time, organizations can move toward closed-loop operations, where validated playbooks are triggered automatically, based on high-confidence signals.
In this way, network monitoring architecture is more than just a collection of tools. It’s the operational foundation for nnetwork monitoring and management solutions in modern, hybrid, and multicloud environments. And it can be the launching pad for network intelligence.
Kentik’s Integration of Network Monitoring Pillars
Kentik’s solutions provide a comprehensive example of how modern network monitoring solutions can integrate the three crucial pillars of Traffic Analysis, Synthetic Testing, and Network Infrastructure Metrics. These integrations are essential in creating a robust network monitoring architecture.
Traffic Analysis with Kentik
Kentik has revolutionized network traffic analysis by leveraging advanced big data technologies and AI-driven insights. Kentik’s approach to network traffic analysis goes beyond traditional methods, offering a comprehensive and scalable solution that’s essential for effective network management, security, and optimization.

Kentik offers near real-time analysis of flow traffic data, providing live network intelligence crucial for capacity planning and resource optimization. By analyzing flow protocols like NetFlow, Kentik delivers sophisticated insights for strategic network planning, such as peering decisions, backbone upgrades, and routing policy planning. Additionally, Kentik’s AI and machine learning techniques automatically detect traffic, performance, and security anomalies across the entire network infrastructure.
Kentik enables a deep dive into traffic flow details, allowing network professionals to examine over 20 metrics and various categories like ASN, geo, port, IP, interface, VLAN, and MAC address. This level of detail is vital for accurately identifying and addressing network performance issues or security threats, such as DDoS attacks.
Kentik’s network traffic visualization tools offer a clear view of the entire network infrastructure, including both owned and external segments. Live network topology maps and detailed visualizations enable quick identification of network issues and their impact on applications. These features ensure that network operators always have a current and comprehensive picture of their network’s performance and security.
Learn how AI-powered insights help you predict issues, optimize performance, reduce costs, and enhance security.

Enhanced Synthetic Testing with Kentik Synthetics
Kentik has significantly advanced the capabilities of Synthetic Testing with its comprehensive Kentik Synthetics solution. This sophisticated approach extends beyond monitoring actual network traffic to actively simulating user interactions and network traffic, providing a deeper insight into network performance and user experience.
Synthetic Testing and User Experience Monitoring
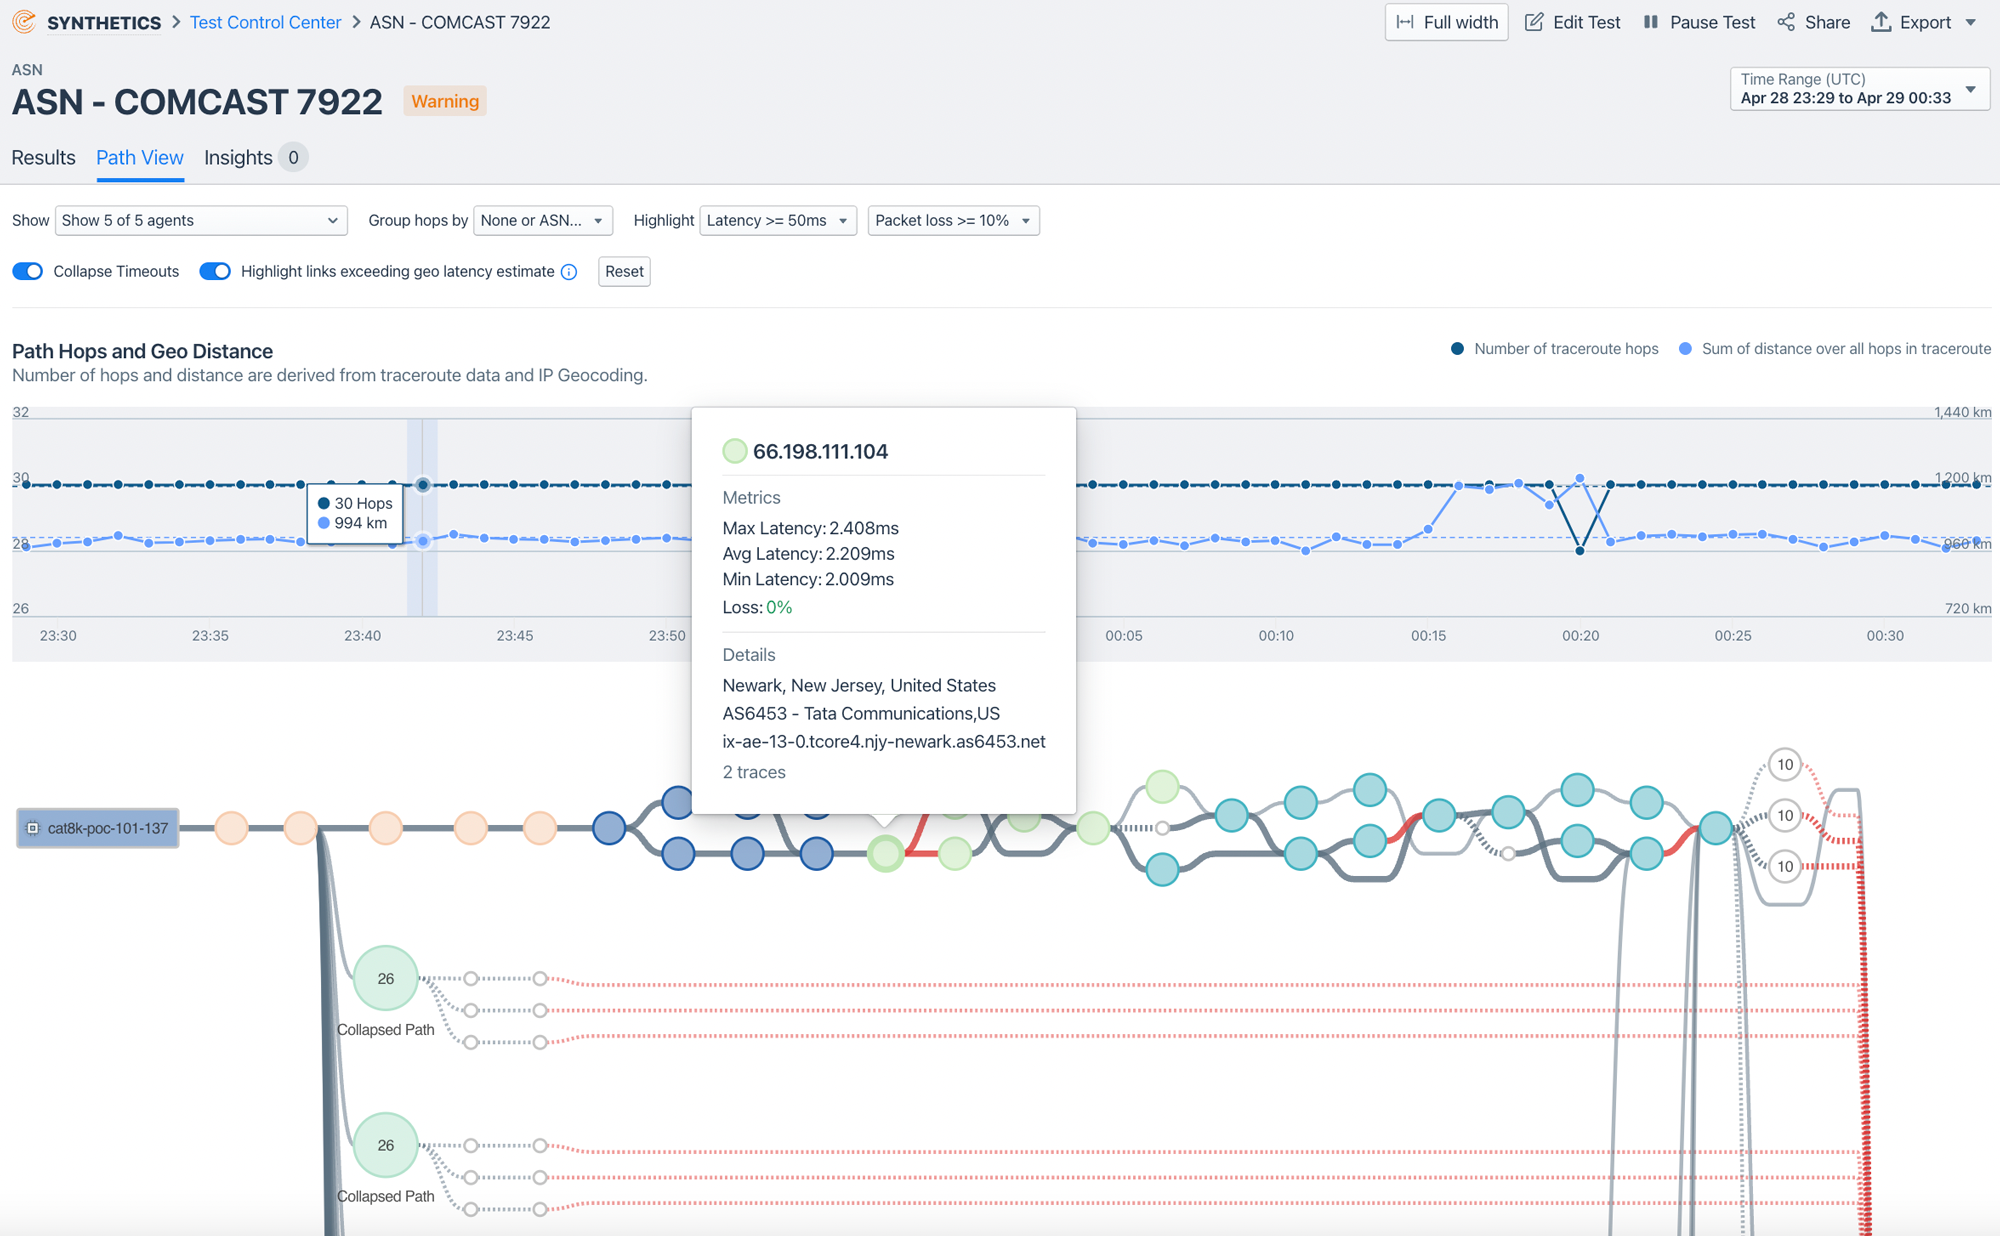
Kentik Synthetics actively simulates visitor or network traffic to a network-accessible resource. This process is crucial for testing availability, response times, and other performance metrics at all network stack layers, including network routing and application layers.
-
Testing Across Layers: Kentik Synthetics allows for tests at various network layers, including WEB/APP, DNS, Routing, and Network, covering aspects like browser page load, HTTP/API, and transaction testing.
-
Comprehensive User Experience Monitoring: With capabilities like ingesting recorded Puppeteer scripts, capturing screenshots, and measuring total transaction times, Kentik offers an extensive set of tools to monitor and improve the performance of user actions on websites and applications.
Advanced Capabilities and Innovations
Kentik Synthetics integrates several important innovations and capabilities that enhance its effectiveness:
-
Contextualized Synthetic Test Results: Results are integrated with the context of actual traffic, offering a complete picture of the network’s performance and health.
-
Configurable Testing and Alerting: STM tests can be set up as both automatic and periodic, with customizable time intervals. Kentik’s platform allows for testing from a wide range of public and private agents, ensuring comprehensive coverage and flexibility.
-
Visualizing Test Results: Kentik’s platform presents STM results on a timeline with colored performance lags and graphs showing total completion times. This visualization aids in quickly identifying performance issues and their impact on user experience.
Enhanced Network Infrastructure Metrics with Kentik NMS
By combining traditional network monitoring capabilities with modern network observability, Kentik NMS (Network Monitoring System) offers a powerful solution tailored for today’s complex network landscapes. Kentik provides extensible metrics collection and visualization, preconfigured for traditional network monitoring tasks. This system is designed to handle the scale of the largest networks in the world, seamlessly integrating SNMP monitoring and streaming telemetry. It represents a unified approach to network monitoring, combining efficiency and flexibility to cater to the needs of both enterprises and service providers.
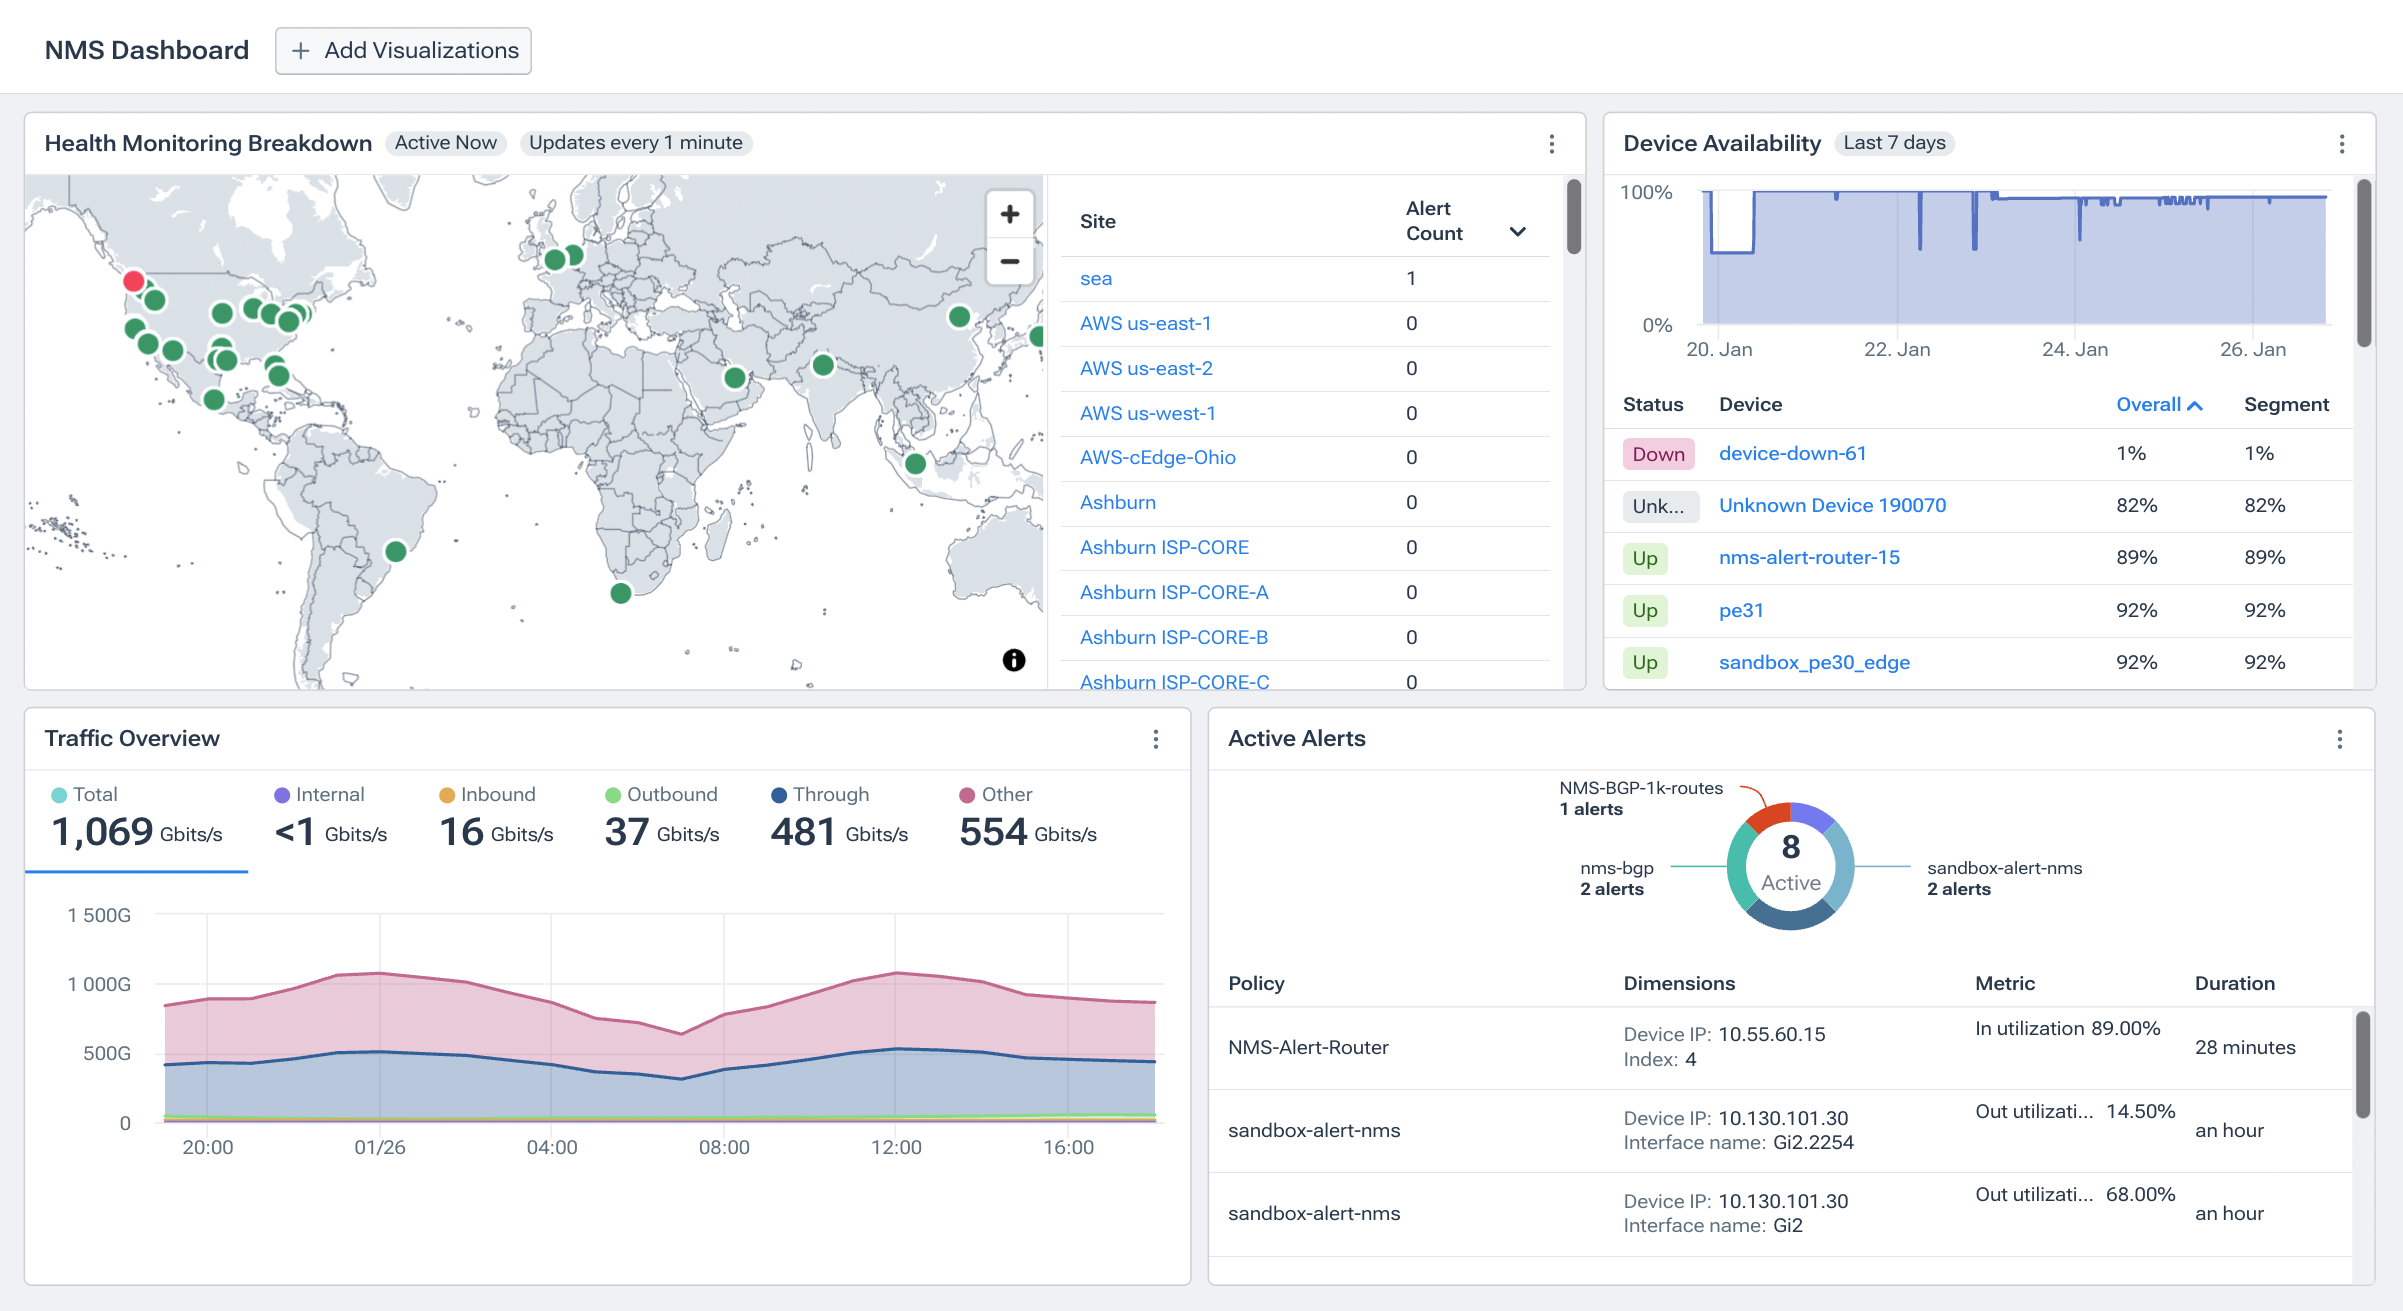
Kentik’s network troubleshooting and capacity planning tools also highlight the importance of network infrastructure metrics. Kentik helps NetOps teams resolve network problems quickly, using powerful visualizations and data to understand network events. Additionally, Kentik’s capacity planning workflow automates the task of ensuring that networks have sufficient resources, thus avoiding congestion surprises that can impact applications or users.
Advanced Features and AI for Comprehensive Monitoring
Kentik’s solutions include advanced features like DDoS defense and network cost analytics. The industry-leading DDoS detection and automated mitigation actions show how Kentik prioritizes network security within its monitoring architecture. Meanwhile, network cost analytics provide insights into bandwidth and resource costs, simplifying cost management and forecasting for network managers.
Kentik also delivers the most advanced artificial intelligence-based features for network monitoring: Kentik AI allows NetOps professionals and non-experts alike to ask questions—and immediately get answers—about the current status or historical performance of their networks using natural language queries. This tool allows administrators to understand on-premises, hybrid, and multicloud networking environments from a single query engine. Because it combines network data from all sorts of protocols—including flow data, SNMP, streaming telemetry, containers, and cloud flow logs—Kentik AI enables unprecedented visibility into modern networks.
Hybrid Cloud Visualization
Kentik’s hybrid cloud visualization also offers a unified view of network topology, state, traffic flows, network performance, and device health status. This feature underscores the importance of a holistic view in modern network monitoring, encompassing multicloud, on-prem, container, and internet infrastructures.

Kentik: Network Monitoring for Modern Network Architectures
Kentik’s comprehensive suite of network monitoring tools illustrates the future of network monitoring architecture. By integrating Traffic Analysis, Synthetic Testing, and Network Infrastructure Metrics, Kentik provides a powerful, unified solution for modern network challenges. This integration ensures that networks are robust, reliable, agile, and adaptable, ready to meet the ever-changing demands of the digital world.
Kentik offers a suite of advanced network monitoring solutions designed for today’s complex, multicloud network environments. The Kentik Network Intelligence Platform empowers network pros to monitor, run and troubleshoot all of their networks, from on-premises to the cloud. Kentik’s network monitoring and network intelligence solution addresses all three pillars of modern network monitoring, delivering visibility into network flow, powerful synthetic monitoring capabilities, and Kentik NMS, the next-generation network monitoring system.
To see how Kentik can bring the benefits of network intelligence to your organization, request a demo or sign up for a free trial today.
FAQs about Network Monitoring Architecture
How is network monitoring architecture different from network monitoring tools?
Individual network monitoring tools collect or visualize specific types of telemetry, like flows, SNMP, or synthetic tests. Network monitoring architecture describes how those tools and data sources fit together into a cohesive monitoring and management platform.
Why are the three pillars of network monitoring architecture important?
Traffic analysis, synthetic testing, and network infrastructure metrics each answer different questions about performance, reliability, and user experience. When all three pillars are integrated, teams gain a complete view of how the network is behaving and how that behavior impacts applications and users.
How does network intelligence relate to network monitoring architecture?
Network intelligence builds on the three pillars of network monitoring by unifying telemetry in a single data platform, enriching it with business context, and applying AI and automation. With the right architecture in place, network intelligence can correlate symptoms, explain root causes, predict risk, and recommend or trigger remediation.
How does network monitoring architecture improve network monitoring and management in hybrid and multicloud environments?
A modern network monitoring architecture treats on-prem, cloud, and internet paths as first-class citizens and unifies telemetry from each domain. That lets teams monitor, troubleshoot, and optimize end-to-end connectivity and user experience across data centers, WAN/SD-WAN, public clouds, and SaaS from a single, consistent view.
Related Reading about Network Monitoring Tools
- Best Network Monitoring Tools for 2026
- What Is Network Monitoring? Tools, Telemetry & Trends (2026)
- How to Evaluate Network Monitoring Tools
- Network Monitoring Architecture: Three Pillars of Modern Network Monitoring
- Network Performance Monitoring (NPM)
- SolarWinds Alternatives: Modern Network Monitoring (NPM and NTA) Tools for Enterprises and Service Providers
- Kentik AI


