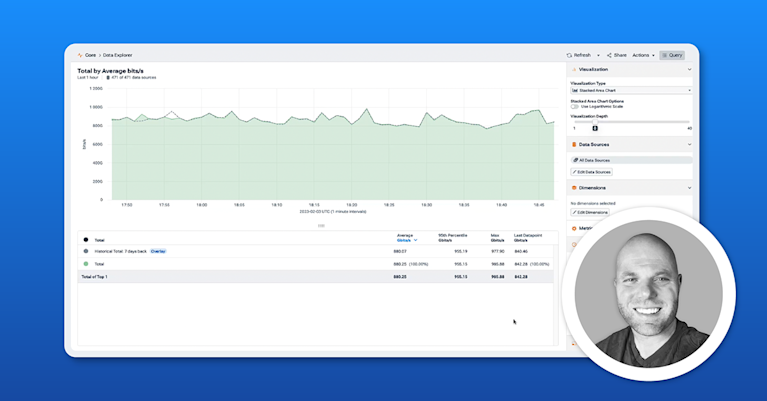
NetFlow Guide: Types of Network Flow Analysis
Network operators often face numerous challenges when it comes to analyzing network traffic and making informed decisions for optimizing performance and security. As networks grow increasingly complex, the need for a comprehensive solution to effectively manage network data has become more critical. NetFlow emerged as a powerful tool to address this need, providing valuable insights into network traffic patterns and usage. By leveraging NetFlow for network traffic analysis, operators can gain a deeper understanding of their infrastructure, enabling them to overcome common obstacles and ensure efficient and secure network operations.
What is NetFlow Analysis?
NetFlow is a protocol developed by Cisco. It is used to record metadata about IP traffic flows traversing a network device such as a router, switch, or host. A NetFlow-enabled device generates metadata at the interface level and sends this information to a flow collector, where the flow records are stored to enable network traffic analytics. A network operator can use NetFlow data to analyze traffic patterns and determine network throughput, packet loss, and traffic congestion at a specific interface level.
Kentik in brief: Kentik is a flow-first network intelligence platform for NetFlow analysis at scale. Kentik ingests NetFlow/sFlow/IPFIX and cloud flow logs, enriches them with routing, geography, and ASN context, and makes it easy to answer “who is talking to whom?”, “what changed?”, and “which apps or destinations are driving performance, cost, or security risk?” using fast queries, baselines, alerts, and AI-assisted change triage.
Learn how AI-powered insights help you predict issues, optimize performance, reduce costs, and enhance security.
NetFlow Variants
While the term “NetFlow” is commonly used to refer to all types of flow records, there are actually three other important variants in regular use:
- IPFIX is an IETF standard flow record format that is very similar in approach and structure to NetFlow. (You can get a deeper dive on the differences in our NetFlow Overview.)
- J-Flow from Juniper Networks, which essentially conforms to NetFlow v5.
- sFlow was introduced and promoted by InMon Corp but unlike NetFlow it relies on statistical sampling methods for documenting flows.
The term xFlow, while not a variant, is the generic term often used to refer collectively to all flow record variants⎯NetFlow, IPFIX, J-Flow, sFlow, etc. You can read more about flow protocols here.
Cisco has developed various versions of NetFlow, with v5 and v9 being the most widely used. NetFlow v9 introduced support for flexible and extensible flow record formats, making it more adaptable to different network scenarios. Understanding the differences between versions and selecting the most appropriate NetFlow version for your network environment is crucial.
In modern environments, organizations rarely rely on a single flow format and often need to analyze multiple telemetry sources together. You can send all your NetFlow, sFlow, IPFIX and cloud flow logs to Kentik, which acts as a unified, SaaS-based collector and analytics platform that normalizes and enriches flow data so you can run ad-hoc queries and build dashboards without managing your own big-data back end.
How Does NetFlow Analysis Work?
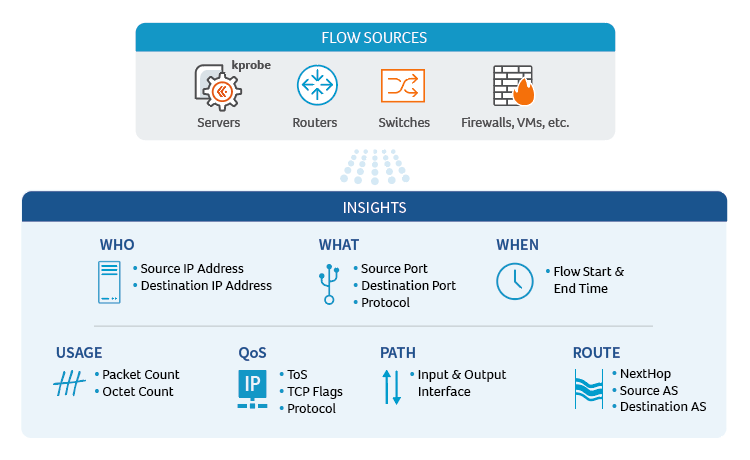
NetFlow analysis is a powerful technique that enables network operators to gain valuable insights into their network traffic patterns and usage. The process begins with the collection of metadata about IP traffic flows traversing a network device, such as a router, switch, or host. These devices, when configured with NetFlow support, generate flow records that contain essential information about the traffic, including source and destination IP addresses, port numbers, packet and byte counts, timestamps, and other relevant attributes.
As new IP traffic flows are detected, the NetFlow-enabled device creates and updates flow records in its cache. Once a flow is terminated or has been inactive for a specific duration, the device exports the flow record to a designated flow collector. This flow collector is responsible for receiving, storing, and pre-processing the flow records from multiple NetFlow-enabled devices.
The next step in the NetFlow analysis process involves an analysis application that processes the collected flow records. This application can generate reports, alerts, dashboards, and other visualizations to help network operators make informed decisions about their network’s performance, security, and resource allocation. By examining these flow records, operators can identify trends, detect anomalies, and pinpoint potential issues that may impact the network’s overall health.
The resulting insights provide network operators with the necessary information to optimize their networks’ performance, enhance security, and make data-driven decisions to overcome the common challenges associated with managing complex network environments.’
NetFlow Components
NetFlow monitoring solutions are typically comprised of three main components:
- Exporter: A NetFlow-enabled device generates flow records and periodically exports them to a flow collector. The Exporter identifies a flow as a unidirectional stream of packets having in common (at least) the following attributes: IP source address, IP destination address, Source port number, Destination port number, Layer 3 protocol field, and Type of Service.
- Collector: A program running on a server or cloud infrastructure that receives, stores, and pre-processes flow records from NetFlow-enabled devices.
- Application: An analysis application that processes flow records collected by the flow collector into reports, alerts, dashboards, and other results.

Flow Enrichment: Adding Context to NetFlow/IPFIX
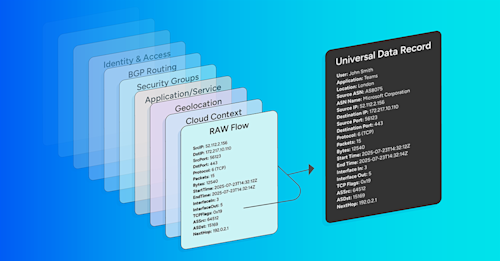
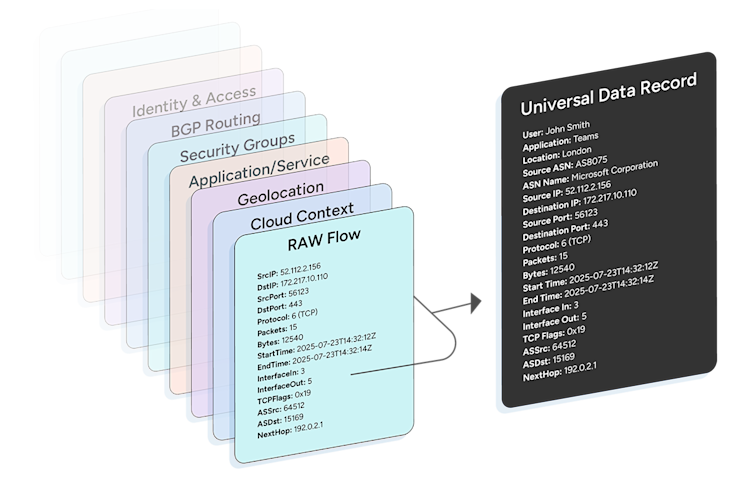
Raw flow records (NetFlow, IPFIX, sFlow, and cloud‑native flow logs) typically contain the “five‑tuple” (source/destination IP, ports, and protocol) plus counters and timestamps. This data is useful, but is limited for answering questions about “who, what, where, and why”. Flow enrichment is the process of correlating each flow with human‑readable metadata from other systems so that network operators can ask business‑relevant questions and act quickly.
What types of information are used for flow enrichment?
Common enrichment sources include:
- DNS and GeoIP: hostnames and geographic location for easier analysis.
- SNMP / device inventory: device and interface names, speeds, roles.
- Routing / BGP context: origin ASN, next hop, ultimate exit/entry, prefix.
- Cloud metadata: account/project, VPC/VNet, region/AZ, instance IDs, gateway/interface type.
- Kubernetes / application context: cluster, namespace, service, workload.
- Threat intelligence and policy lists: known bad ASNs/indicators, allow/deny tags.
- Custom business tags: business unit, customer, cost center, environment.
Attaching these attributes at or near ingest time means every query and report carries context—without manual lookups or ad‑hoc joins.
Example: A raw record might show
10.1.1.10 → 172.217.10.110:443. With enrichment, the same flow is immediately understood asApp=Checkout API, Cloud=GCP, Project=billing-prod, Region=us‑central1, AZ=b, ASN=15169 (Google), IfOut=agg‑edge‑2/1 (100G), Geo=US‑IA.
Benefits of NetFlow enrichment
Enriched flow enables operators to:
- Troubleshoot faster: Tie a spike or error to the specific app, interface, or path; pivot from an IP to “which service/namespace/account is it?” in one step.
- Optimize performance and cost: Spot noisy apps, mis‑prioritized QoS classes, hair‑pinning, or costly cloud egress by grouping on enriched dimensions (e.g., interface role, AZ, ASN).
- Strengthen security and segmentation: Detect unexpected east‑west movement, data to untrusted geos, or flows that violate policy labels.
- Collaborate across teams: Replace opaque IPs with terms that application and cloud owners understand.
Implementation notes
Enrichment can be applied in two places:
- At ingest (recommended at scale): flow records are enriched before storage, preserving time‑correct context (e.g., interface names that later change) and enabling fast queries over large, unsampled datasets.
- At query time: workable for small datasets, but repeated joins and point‑in‑time lookups can be slow and may lose historical accuracy.
For a deeper overview of flow protocols and records, see flow protocols and our NetFlow overview. Enrichment applies equally to NetFlow, IPFIX, and cloud flow logs.
NetFlow Analysis for Performance Monitoring
A given set of packets is defined as a flow, which makes up the core metadata (i.e., information about the flow rather than the information that’s actually in the packets) that is included in a NetFlow “flow record.” When a new unidirectional IP traffic flow starts traversing a device, a new NetFlow flow record is created and tracked via the device’s on-board cache. Time analysis of the flow records enables performance monitoring across the network between various network elements, as NetFlow devices in total continuously export their information for processing by an analysis application.
NetFlow Analysis Use Cases
Using NetFlow offers insight to overcome many common challenges encountered by network operators including:
- Monitoring major contributors of network traffic: One of the most common and valuable uses of flow data is identifying which hosts and destinations are responsible for the most traffic at any given moment. Kentik ingests flow data in real time and makes it immediately queryable so you can see top talkers and top destinations by bytes, packets, or flows and drill down by site, interface, region, or AS whenever you suspect a spike or anomaly.
- Understanding application traffic and its network impact
- Optimizing internet peering relationships
- Troubleshooting and understanding network congestion points: When performance degrades, flow data can help narrow the problem down to a specific part of the network. If retransmission-related indicators show up in your flow or telemetry, Kentik lets you filter by source/destination, interface, site or AS to correlate those spikes with specific network segments and pinpoint where retransmission-heavy traffic is flowing.
- Baselines and anomaly detection: Beyond point-in-time troubleshooting, flow data is also useful for understanding what “normal” traffic looks like over time. Kentik continuously stores flow and telemetry data, letting you build a baseline of normal traffic patterns; deviations from that baseline such as unusual destinations, volumes or protocols can then be flagged via queries or alerts as anomalies that need investigation.
- Detecting unauthorized WAN traffic
- DDoS and threat detection
- Validating QoS parameters
- NetFlow in Data Centers: Flow data is particularly valuable for understanding internal, east-west traffic that is otherwise invisible to perimeter-focused monitoring tools. By configuring devices or agents inside your data centers and clouds to export flow or cloud-native logs to Kentik, you gain visibility into east-west traffic between subnets, VPCs or pods and can monitor internal communications, heavy internal flows and potential lateral-movement paths.
Various internal organizations including network operations, engineering, planning, architecture, and security can use NetFlow analysis as a primary source of network intelligence. Consolidated NetFlow traffic analysis can reduce the number of hardware and software technologies needed to manage networks, reduce network administration costs, and enhance cross-organizational collaboration and communications.
NetFlow analysis is just one part of a comprehensive network monitoring strategy. Integrating NetFlow data with other network monitoring tools, such as SNMP, syslog, and performance monitoring solutions, can provide a more holistic view of network performance and health.
Advanced NetFlow Use Cases
In environments that rely on traffic mirroring or packet brokers, flow summaries can provide scalable visibility without capturing full packets. As long as mirrored traffic or packet-broker output is summarized into flow formats like sFlow or IPFIX and exported to Kentik, you can analyze that mirrored traffic at scale and see which conversations are being mirrored, where they go and whether the mirroring infrastructure is overloaded or misconfigured.
As organizations adopt IPv6 alongside IPv4, flow analysis becomes an important way to compare traffic patterns across address families. Kentik treats IPv4 and IPv6 flows equally so you can filter and compare traffic volumes, destinations and performance metrics for IPv6 versus IPv4, helping you track adoption, identify gaps and verify that IPv6 paths are performing on par with or better than IPv4.
How Kentik Helps with NetFlow Analysis
The Kentik Network Intelligence Platform provides a comprehensive view of network traffic flows, including hybrid and multicloud environments. By visualizing and analyzing network flow data, Kentik enables network professionals to understand traffic patterns, identify performance issues, and enhance security. Key features include:
- Real-Time Network Flow Monitoring: Visualize and analyze flow data in real-time across all network environments.
- Advanced Network Traffic Analytics: Identify anomalies and optimize network performance with detailed flow insights.
- Unified Dashboard: Monitor network paths, performance, and security from a single interface.
Kentik offers a suite of advanced network monitoring solutions designed for today’s complex, multicloud network environments. The Kentik Network Intelligence Platform empowers network pros to monitor, run and troubleshoot all of their networks, from on-premises to the cloud. Kentik’s network intelligence solution addresses all three pillars of modern network monitoring, delivering visibility into network flow, powerful synthetic testing capabilities, and Kentik NMS, the next-generation network monitoring system.
To see how Kentik can bring the benefits of network intelligence to your organization, request a demo or sign up for a free trial today.
FAQs about NetFlow Analysis
How can I analyze top talkers and top destinations in real time?
Kentik ingests flow data (NetFlow, IPFIX, sFlow, and cloud logs) in real time and lets you immediately query top talkers (by bytes, packets, sessions) and top destinations — so you can see who’s sending the most traffic and where it’s going at any moment, across on-prem, cloud, WAN or Internet
How can I centralize flow logs, NetFlow, sFlow, and IPFIX for analytics?
Kentik works as a unified flow-data collector and analytics platform. You send all your NetFlow, IPFIX, sFlow, and cloud flow logs to Kentik, where they’re normalized, enriched, stored, and made queryable — giving you a single centralized pane of glass for all traffic-flow analysis.
How do I monitor east-west traffic within data centers and clouds?
Kentik treats data-center east-west traffic just like any other flow. By ingesting flow logs from your switches/routers (or cloud-native flow logs), you get full visibility into internal traffic patterns. You can filter by source/destination subnets, segments, devices, and interfaces to isolate intra-DC or inter-VPC flows and monitor bandwidth, communications, or unusual traffic in your internal networks.
How do I baseline normal network behavior and detect anomalies?
Kentik continuously stores flow and telemetry data over time, letting you build a baseline of ‘normal’ traffic — including typical volumes, top talkers, and byte/packet patterns. Then you can run anomaly detection: spikes, unexpected flows, unusual destinations or traffic surges trigger alerts so you catch deviations from baseline behavior quickly.
How do I correlate spikes in retransmits with specific network segments?
If your network exports detailed flow records (or sampled flow via sFlow/IPFIX), Kentik lets you filter by any segment (interface, subnet, site, AS) — so you can cross-reference traffic spikes or retransmit-heavy flows and isolate exactly which network segment, link or interface is seeing abnormal traffic.
How can I monitor traffic mirroring and packet brokers effectively?
By exporting mirrored or packet-broker-copied traffic as flow or sFlow/IPFIX data, Kentik can ingest and store that metadata at scale — letting you analyze mirrored traffic patterns, monitor for anomalies or unexpected flows, and include packet-broker traffic in the same dashboards as your normal production flows.
How can I monitor IPv6 adoption and performance vs IPv4?
Monitor IPv6 adoption by tracking the share of traffic and top destinations that are IPv6 vs IPv4 over time, then compare performance signals (for example, retransmits, loss indicators, and user-facing latency from synthetic tests) to confirm IPv6 paths perform at least as well as IPv4. Kentik supports this by treating IPv4 and IPv6 flows equally in analysis so you can filter and compare volumes, destinations, and routing context across address families, and by providing IPv6-aware dimensions (like IPv6 flow label) for deeper investigation when path changes or ECMP behavior affects performance.
