Summary
Hybrid cloud environments, combining on-premises resources and public cloud, are essential for competitive, agile, and scalable modern networks. However, they bring the challenge of observability, requiring a comprehensive monitoring solution to understand network traffic across different platforms. Kentik provides a unified platform that offers end-to-end visibility, crucial for maintaining high-performing and reliable hybrid cloud infrastructures.
Hybrid cloud environments are a common architecture for modern networks, and for good reason. A hybrid cloud architecture spanning on-premises resources and public cloud is pretty much required to stay competitive, agile, and scalable. It allows businesses to leverage both the stability of on-premises infrastructure and the scalability of public cloud platforms.
While this combination provides a powerful infrastructure foundation, it also brings a significant challenge – observability. Understanding network traffic between on-premises data centers, public cloud platforms, and the public internet requires a comprehensive monitoring solution.
The goal of hybrid cloud visibility
The problem is that the network we’re concerned with today spans both the infrastructure we own and manage and the infrastructure we don’t. Modern application delivery relies on both the devices and services in our own campus data center as well as public cloud and internet service providers. If we’re going to deliver the seamless user experience people expect today, we need to understand network health end-to-end, and that’s hard to do when you don’t own much of the path.
Traditional on-premises network visibility captured metrics like packet loss, interface errors, jitter, device information, and traffic information like flow, latency, round-trip time, etc. Once we started using providers like AWS and Azure, we spun up new visibility solutions to see many of these metrics in the cloud.
This is all great, but we don’t operate in disparate silos anymore. Application performance relies on both on-prem and public cloud, so this information can’t be siloed. Therefore, hybrid cloud visibility needs to understand how application performance is affected by both on-premises and cloud network activity. To be truly effective, it also needs to understand how the public internet in between also affects an application’s performance.
The goal of hybrid cloud visibility is to understand these three areas in a single context so that an engineer can see them in one place.
How Kentik enables visibility across hybrid cloud
Kentik provides a comprehensive solution for monitoring, analyzing, and optimizing complex networks on-premises, in the cloud, and public internet pathways.
Kentik collects data from a wide range of sources, including on-premises data centers, campus networks, public clouds like AWS, Azure, Google, and Oracle, and the public internet. By consolidating this information into a single platform, Kentik delivers a unified view of network performance across a hybrid architecture.
Let’s look at each area individually.
First, on-prem network devices like switches, traditional routers and SD-WAN routers, firewalls, load balancers, and others still play a critical role in delivering applications. Kentik uses protocols and mechanisms like SNMP, streaming telemetry, flow data, and metadata from network-adjacent sources like IPAM to understand how the on-prem network you own and manage affects application performance.
Second, Kentik collects flow logs and metrics from the public cloud providers to see how traffic moves to and through your cloud environment. For example, in AWS, traffic traverses transit gateways and directly connects from VPC to VPC and back to your on-prem network. For Azure, you can see traffic through your ExpressRoutes, to your Vnets, and, again, back to your on-prem network.
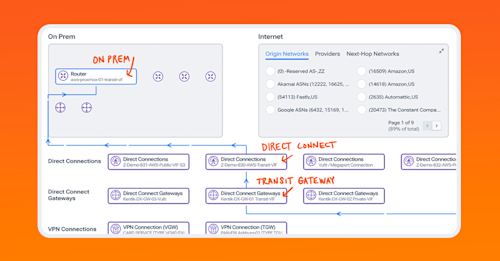
Notice in the first graphic below that we can map traffic from our on-prem router through a Direct Connect and gateway to a specific transit gateway. On the right side of the image, we can see the details of the on-prem router when sending traffic to the cloud.

“Kentik saved us time and gave us full confidence that we’d be aware of and be able to respond to any cloud or on-prem network issues on a timely basis.”
– Louis Bolanos, Staff Cloud Network EngineerIn the next graphic, we can see traffic going into a region and then between individual VPCs. This can be filtered by application, security tag, protocol, or whatever is relevant to you. Almost everything is clickable, meaning you can select a link, a VPC, etc., and drill down even further to see specific traffic flows, cloud network health metrics, and other information, such as link status and the metadata about each resource.

Next, as anyone who uses the internet knows, ISPs also play a critical role in application performance. Kentik monitors service providers by collecting information from routing tables and path traces from source to destination over the public internet. This way, you can see where latency or packet drops are occurring hop-by-hop between your branch office or data center and between cloud regions.
You can also use the Data Explorer to drill down into specific traffic, filtering our underlying database in any relevant way. In this image, we can see traffic from our various on-prem resources destined for AWS. For this visualization, we chose to see the application name and VPC name, though the filtering options on the right side of the image allow almost any query.

We also need to see traffic between regions since we rely on the public internet. The next image below shows the path between the AWS us-east 2 and eu-west-2 regions. Each node and link in the image can be expanded to show each hop’s specific loss, latency, and jitter over the public internet.

Lastly, it’s also essential to remember that a host of network-adjacent services affect application performance. For example, DNS resolution time, timeouts, caching, load-balancing, and even the location of particular DNS servers significantly impact application performance. Therefore, Kentik monitors the major public DNS services and an organization’s own DNS to provide that information alongside metrics, flow data, etc.
In the image below of Kentik’s State of the Internet, we see health metrics and alerts for some of the world’s most popular DNS providers. We can also monitor private DNS services on-prem or hosted in the cloud.

Suppose we see an issue, such as OpenDNS’s DNS service and network resource health data. In that case, we can drill down into the metrics to see that in the last hour, there were several spikes with resolution time that were outside our dynamically-created rolling standard deviation baseline.

In conclusion
Kentik combines all of this information into a single platform so an engineer can understand application traffic end to end, from on-prem to the cloud, in context. Hybrid cloud visibility is crucial for maintaining a high-performing and reliable network infrastructure that spans on-prem, public cloud, and the public internet, and Kentik’s unified approach to network visibility provides the comprehensive strategy we need to monitor an application’s journey from source to destination, even when you don’t own or manage every part of the network in between.


