State of the Internet: Monitoring SaaS Application Performance

Summary
With the increasing reliance on SaaS applications in organizations and homes, monitoring connectivity and connection quality is crucial. In this post, learn how with Kentik’s State of the Internet, you can dive deep into the performance metrics of the most popular SaaS applications.
Most of us, at work and at home, are using SaaS applications every day for productivity tools, mission critical applications, and entertainment. Therefore it’s important to monitor connectivity to these services, as well as the quality of those connections. However, that’s easier said than done.
We don’t have much insight into what’s going on in SaaS provider networks, so when a SaaS app is performing poorly, we can feel left in the dark. We don’t own Google’s DNS service, we don’t own Microsoft 365, we don’t own Salesforce, Zoom, and so on, so this is where Kentik’s State of the Internet comes in.
The State of the Internet is a part of Kentik’s comprehensive network observability platform and is included for all our customers to use. We’ve deployed hundreds of network and application testing agents around the world to monitor some of the most popular SaaS providers continually and report on the results in the Kentik portal.
We gather information on packet loss, network and application latency, jitter, DNS resolution, and path tracing from each agent to specific SaaS points of presence. That way, we can get an understanding of both the SaaS applications’ performance locally, on their end, and in the path in between.
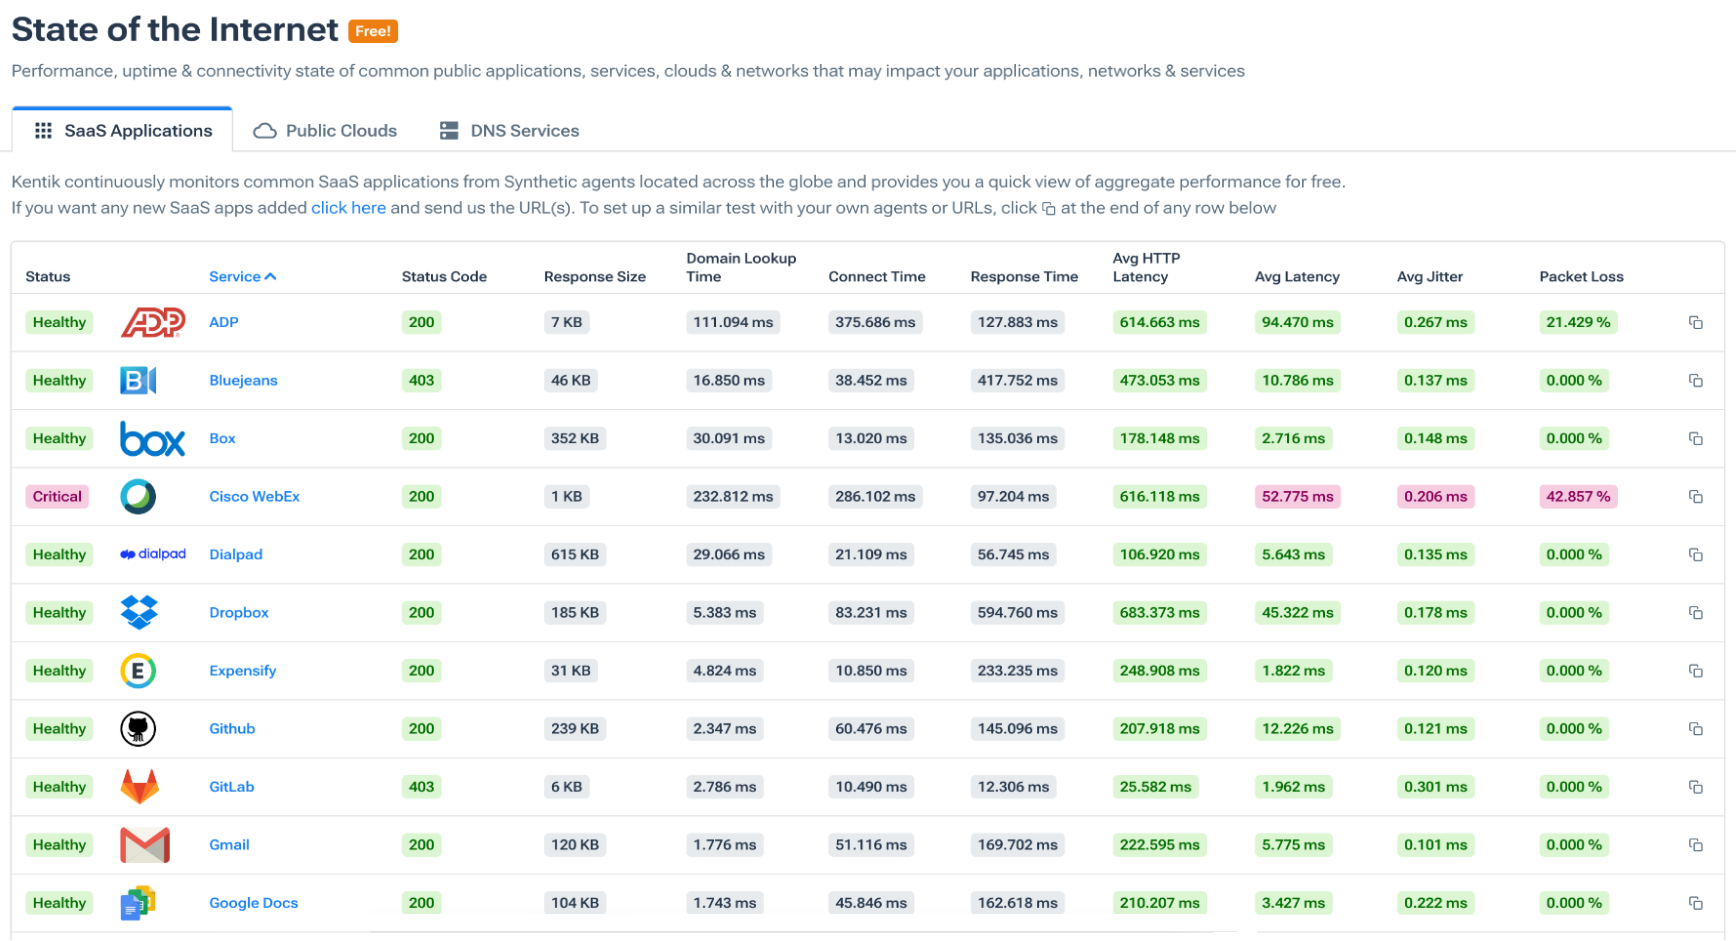
The State of the Internet grid
Notice in the image below the connection quality metrics for many of the most popular SaaS providers in a grid. We’re capturing the HTTP status code, response size, domain lookup time, connection time, response time, average HTTP latency, average latency, average jitter, and packet loss. We’re capturing a variety of metrics to gauge the quality of the connection from multiple perspectives – network, application layer, even DNS.
Drilling down for more info
As an example, if you have a problem with a particular SaaS provider, you can get a quick view of the metrics related to only them on the main page. However, though this quick glance is very helpful and extremely popular with our customers, you can also drill down further by clicking on the provider name.
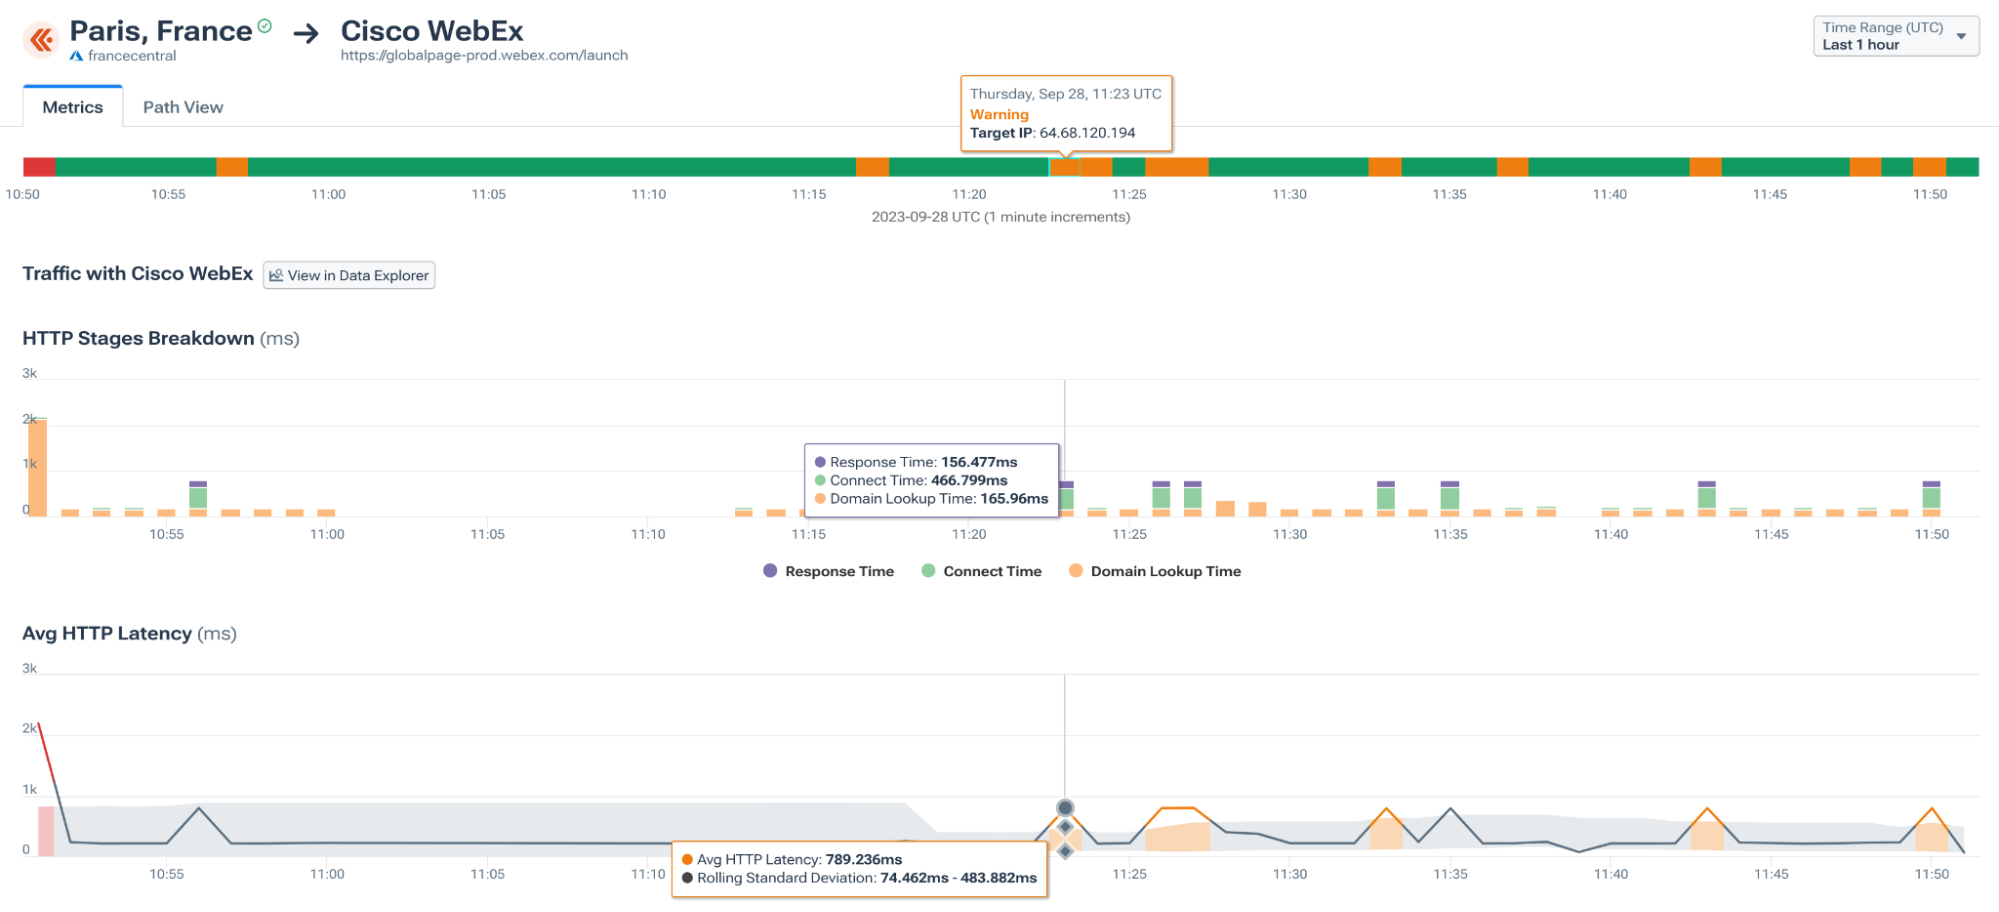
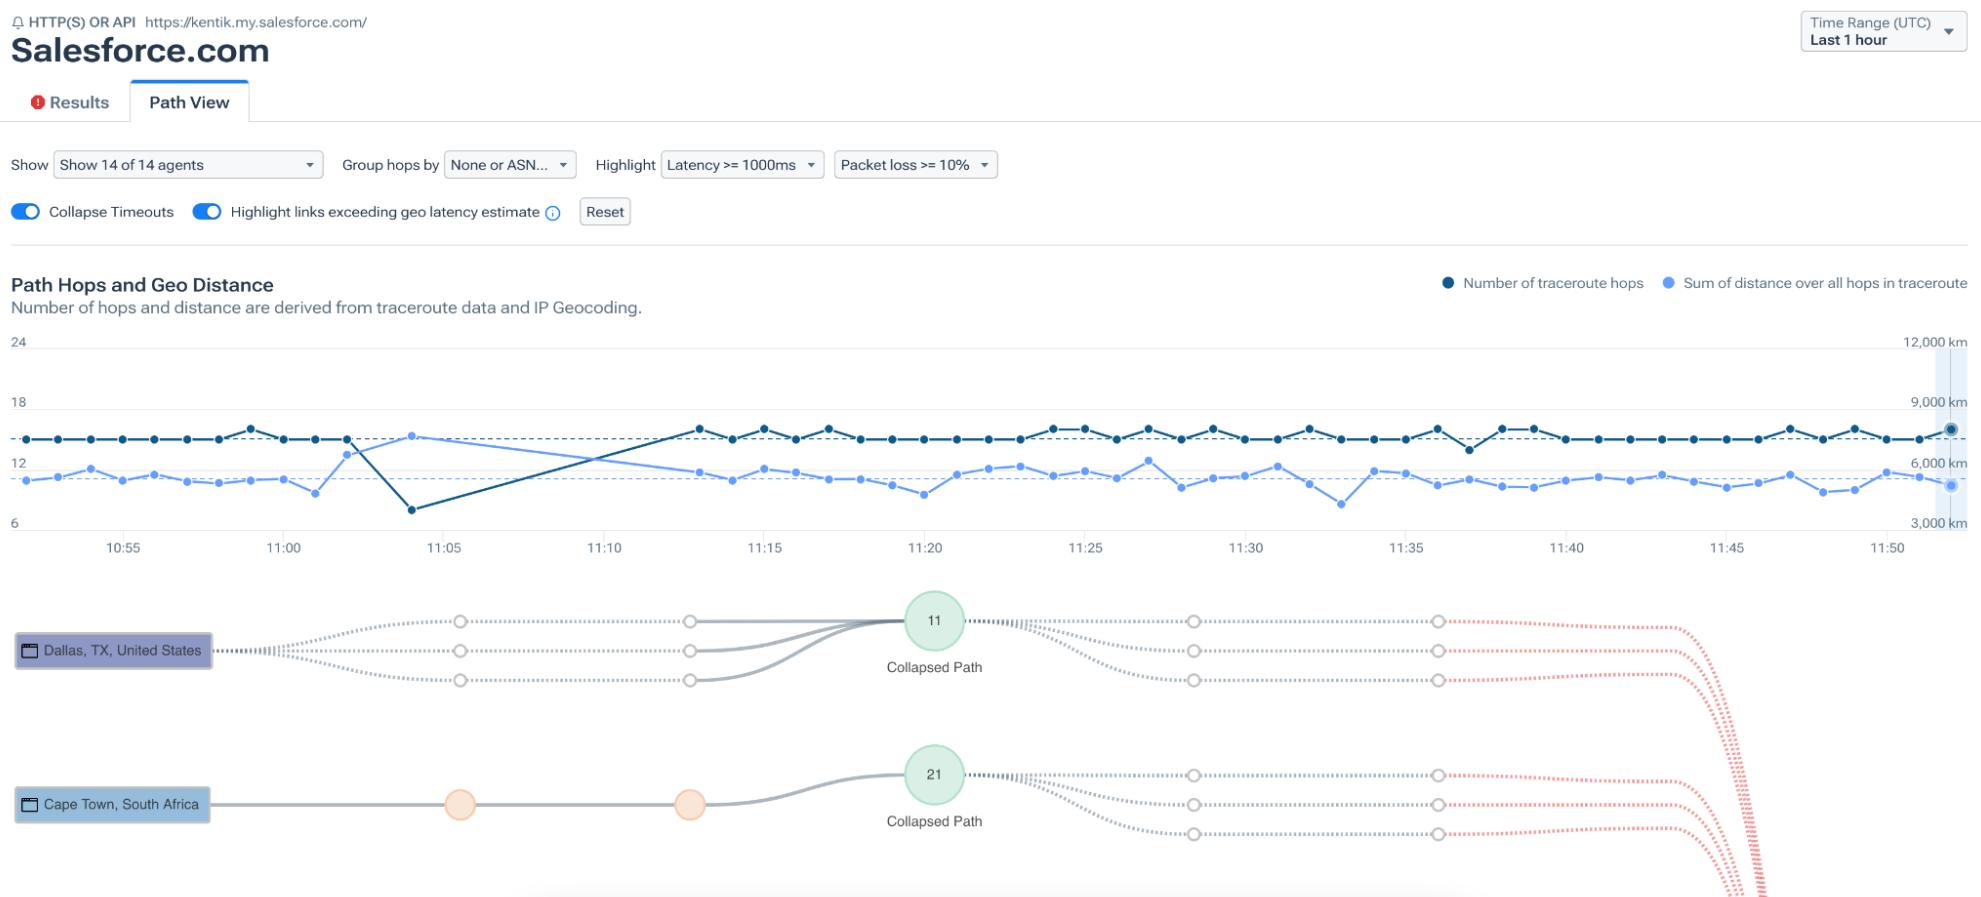
When you select a specific provider, you can see those same metrics in a map or time series, you can adjust your time range, and you can drill down further to see the detailed metrics and path view for that specific provider.
Public cloud monitoring
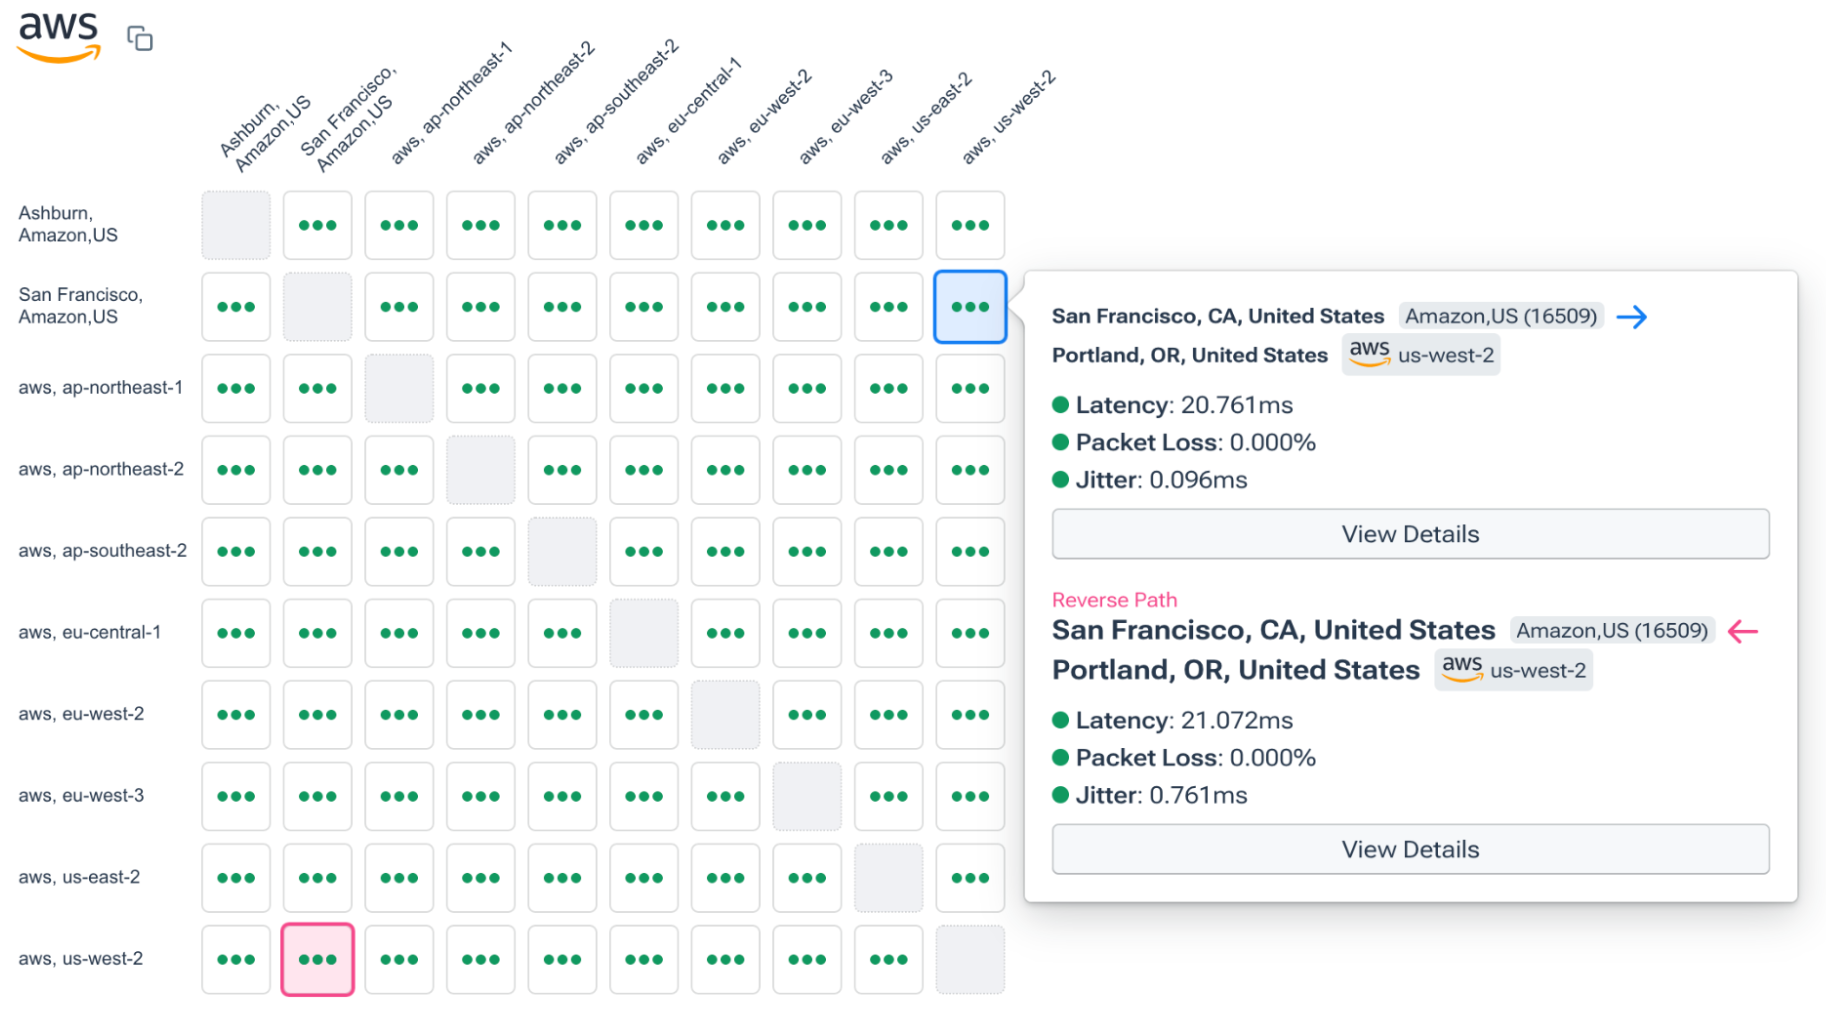
We’re also monitoring the quality of the connection to the major public clouds, which you can see in the grid below, and just like the main State of the Internet grid, you can also drill down into any of these details from here.
Keep in mind that these are the connections from the Kentik test agents deployed all over the world and not our individual customer agents. That way, just by taking a quick look at the State of the Internet in the Kentik portal, you can get a general overview of the major public clouds’ performance characteristics in regions all over the world instead of testing only one instance.
We still care about DNS
Lastly, we understand that DNS is a critical component of application delivery and performance, so we’re monitoring the connection to and resolution time of the major public DNS services like Cloudflare, Google, and Quad9. This is presented in the form of a health status bar and a time series graph so that you can see changes over time. We also create a rolling standard deviation so we understand what “normal” looks like for a particular DNS service. And of course you can also adjust your time range to see what the metrics were a few hours ago, yesterday, last week, or last month.
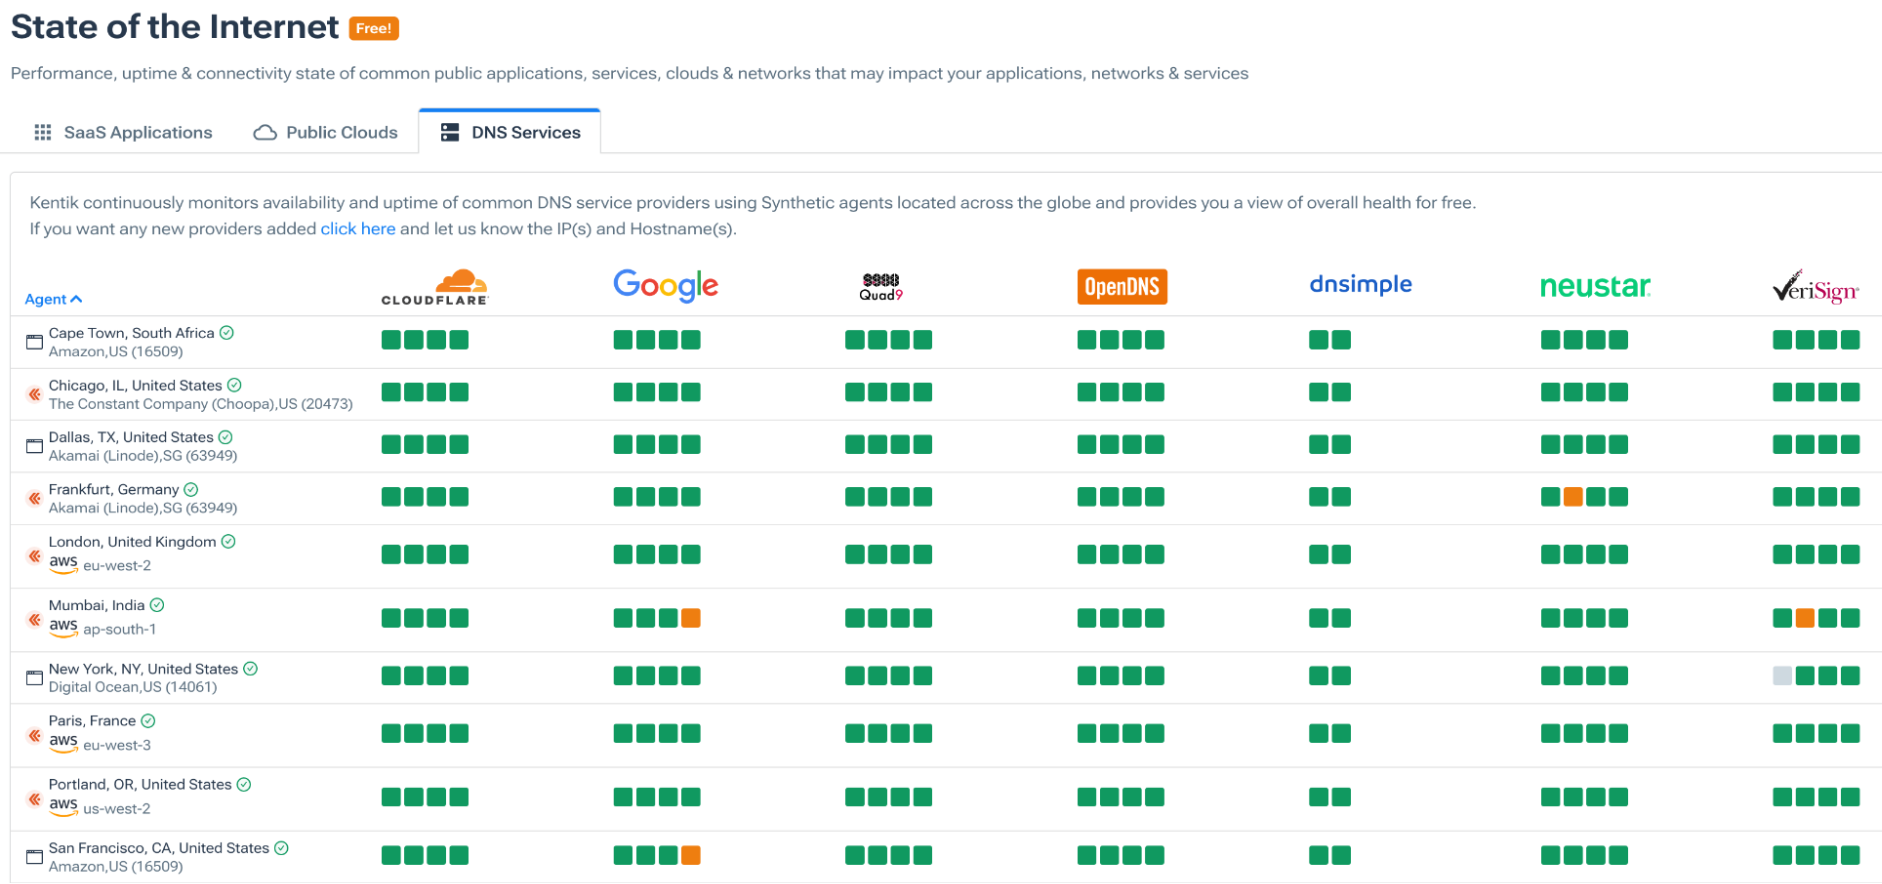
The State of the Internet is built with Kentik Synthetics, so as a Kentik customer you can create your own custom tests with very specific parameters to whatever application or service you want to monitor, internally, in your own cloud instances, or on the public internet.
For more information about the State of the Internet and how Kentik can help you monitor your SaaS application performance, check out this short overview video.
