Summary
Kentik transforms real-time network telemetry into actionable alerts for AI-optimized data centers. By converting database queries into custom alerts, engineers can detect issues like elephant flows, idle links, and packet loss before performance suffers and triggers alerts in systems like ServiceNow or PagerDuty.
A modern AI-ready data center fabric is a living, breathing organism. At any moment, a single elephant flow can hammer a 400 Gbps uplink, a spine link can sit idle and waste budget, or a queue buffer overflow on a switch causes packets to drop. When milliseconds matter, the old “stare-and-compare” with dashboards isn’t enough. You need the network to tell you there’s a problem before users feel the pain, and that’s especially critical when some dropped packets can hose the job-completion time of an AI workload.
Kentik makes that possible by converting every exploratory query you build into an automated policy that fires alerts straight into ServiceNow, PagerDuty, or a simple email inbox.
Build your query with Data Explorer
Everything starts in Data Explorer, Kentik’s on-demand query engine. Pick a metric, choose a dimension, add a filter, and the platform searches through billions of flows in a heartbeat. But the secret is to isolate the signal you actually care about.
Suppose you want to catch elephant flows before they block synchronized GPU traffic. You start by choosing “bits per second” as the metric, group by “Source–Destination Pair” or “Flow Hash,” then filter the interface role to fabric leaves, and sort by descending bandwidth.
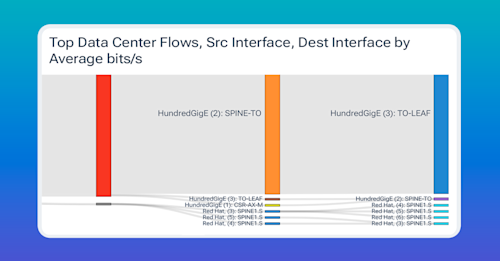
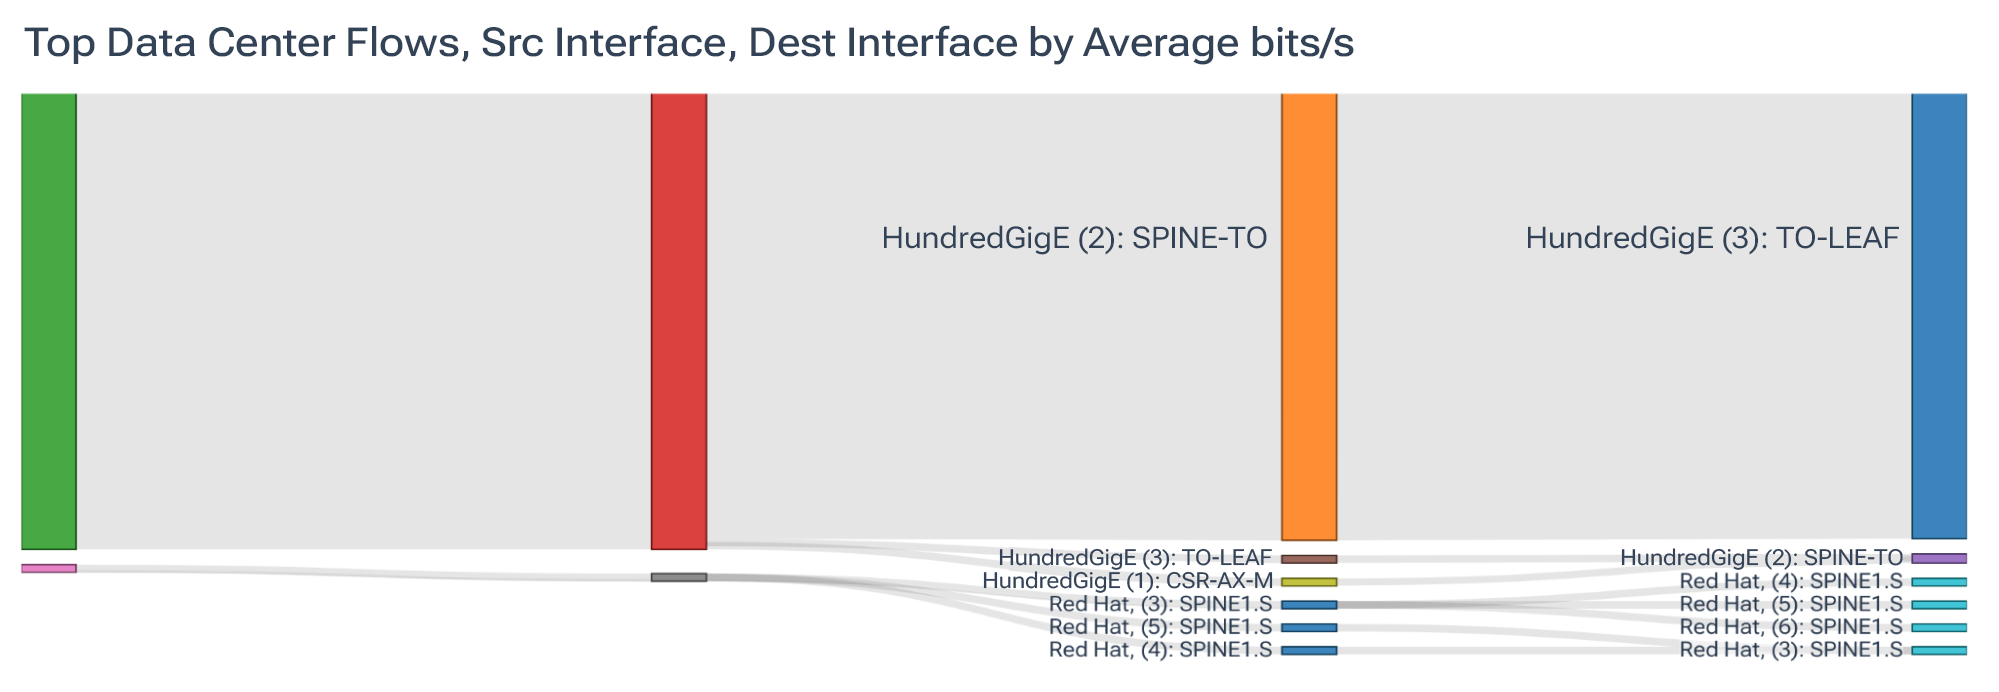
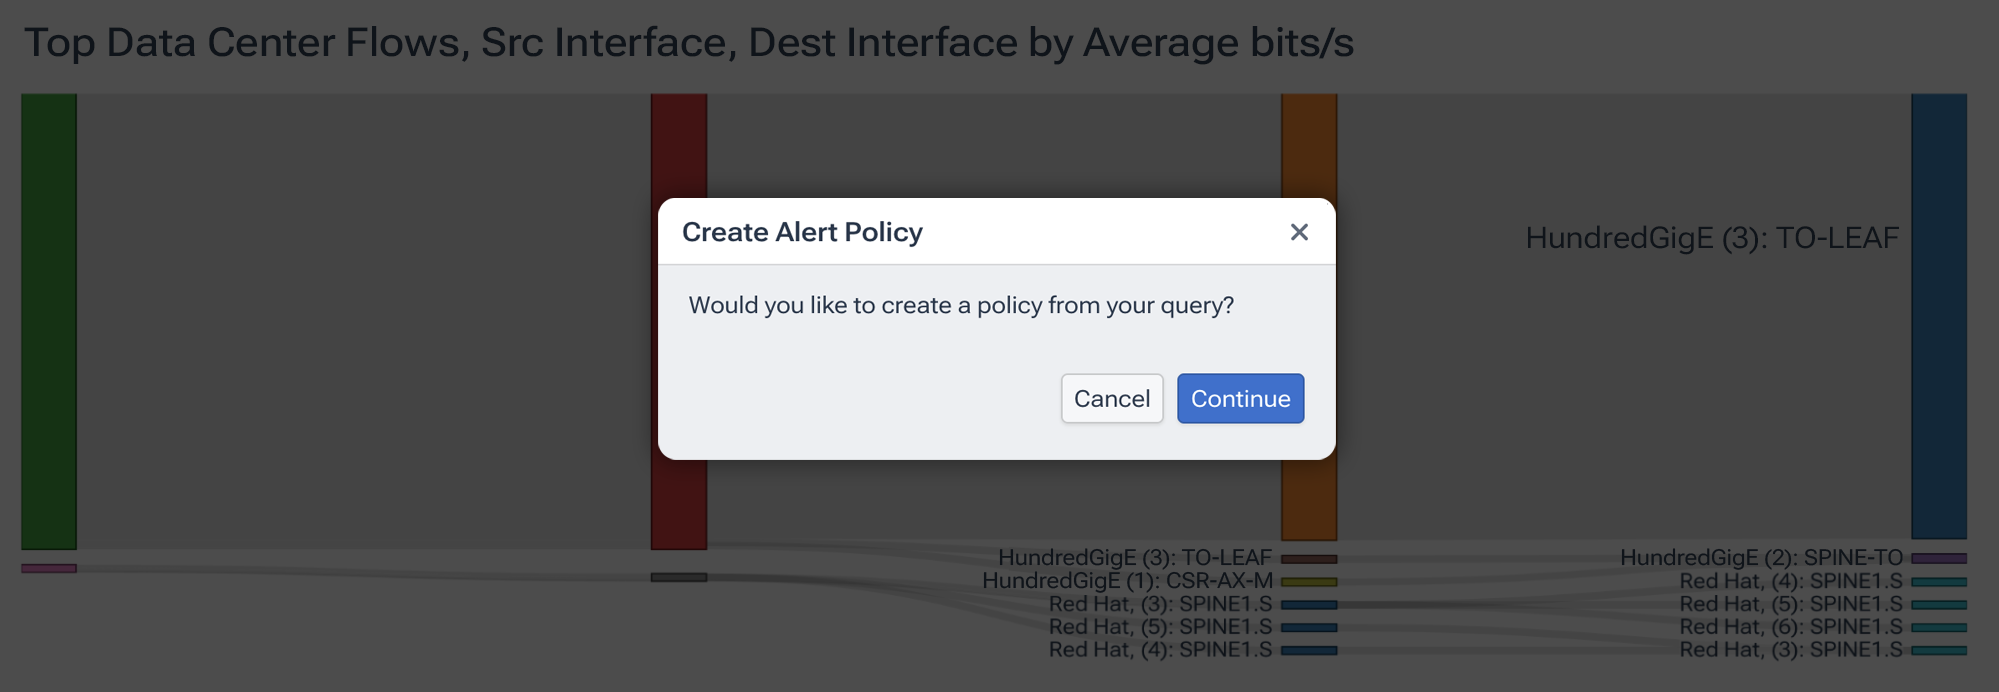
In the image below, notice how our query immediately shows us an indication of a possible elephant flow between a leaf and spine switch.
For idle paths, you might switch the dimension to “Interface ID,” look at a 24-hour average, and hone in on links that never break one percent of line rate, clearly indicating idle paths that are wasting money.
Dropped packets, high CPU utilization, and oversubscribed VXLAN VNIs all follow the same pattern. We first identify what hinders network performance, then we craft a query and verify that the graph clearly distinguishes between normal and abnormal behavior.
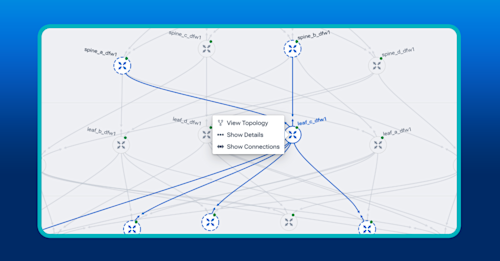
Kentik’s approach to VXLAN allows users to see both the underlay and the overlay using deep sFlow analysis capabilities. This mitigates the need for expensive packet capture/packet broker infrastructure in order to understand what workloads are actually driving traffic. It also provides a topology-aware view of how traffic is flowing through the fabric over VXLAN.
Learn how AI-powered insights help you predict issues, optimize performance, reduce costs, and enhance security.
Turning queries into automated alerts
Once Data Explorer gives you the condition you want to identify, we can save it and create an alert policy right from there. Kentik automatically pulls every filter and aggregate into a new alert definition, which you can use as-is or tweak even further.
For example, you can set the policy scope (all fabrics tagged “dc-east-gpu”), choose the key that Kentik evaluates independently (per interface, per flow, per VNI), and then specify thresholds. For an elephant flow policy on a 400 Gbps link, you might warn at 100 Gbps and trigger a critical alert at 50% of interface capacity.
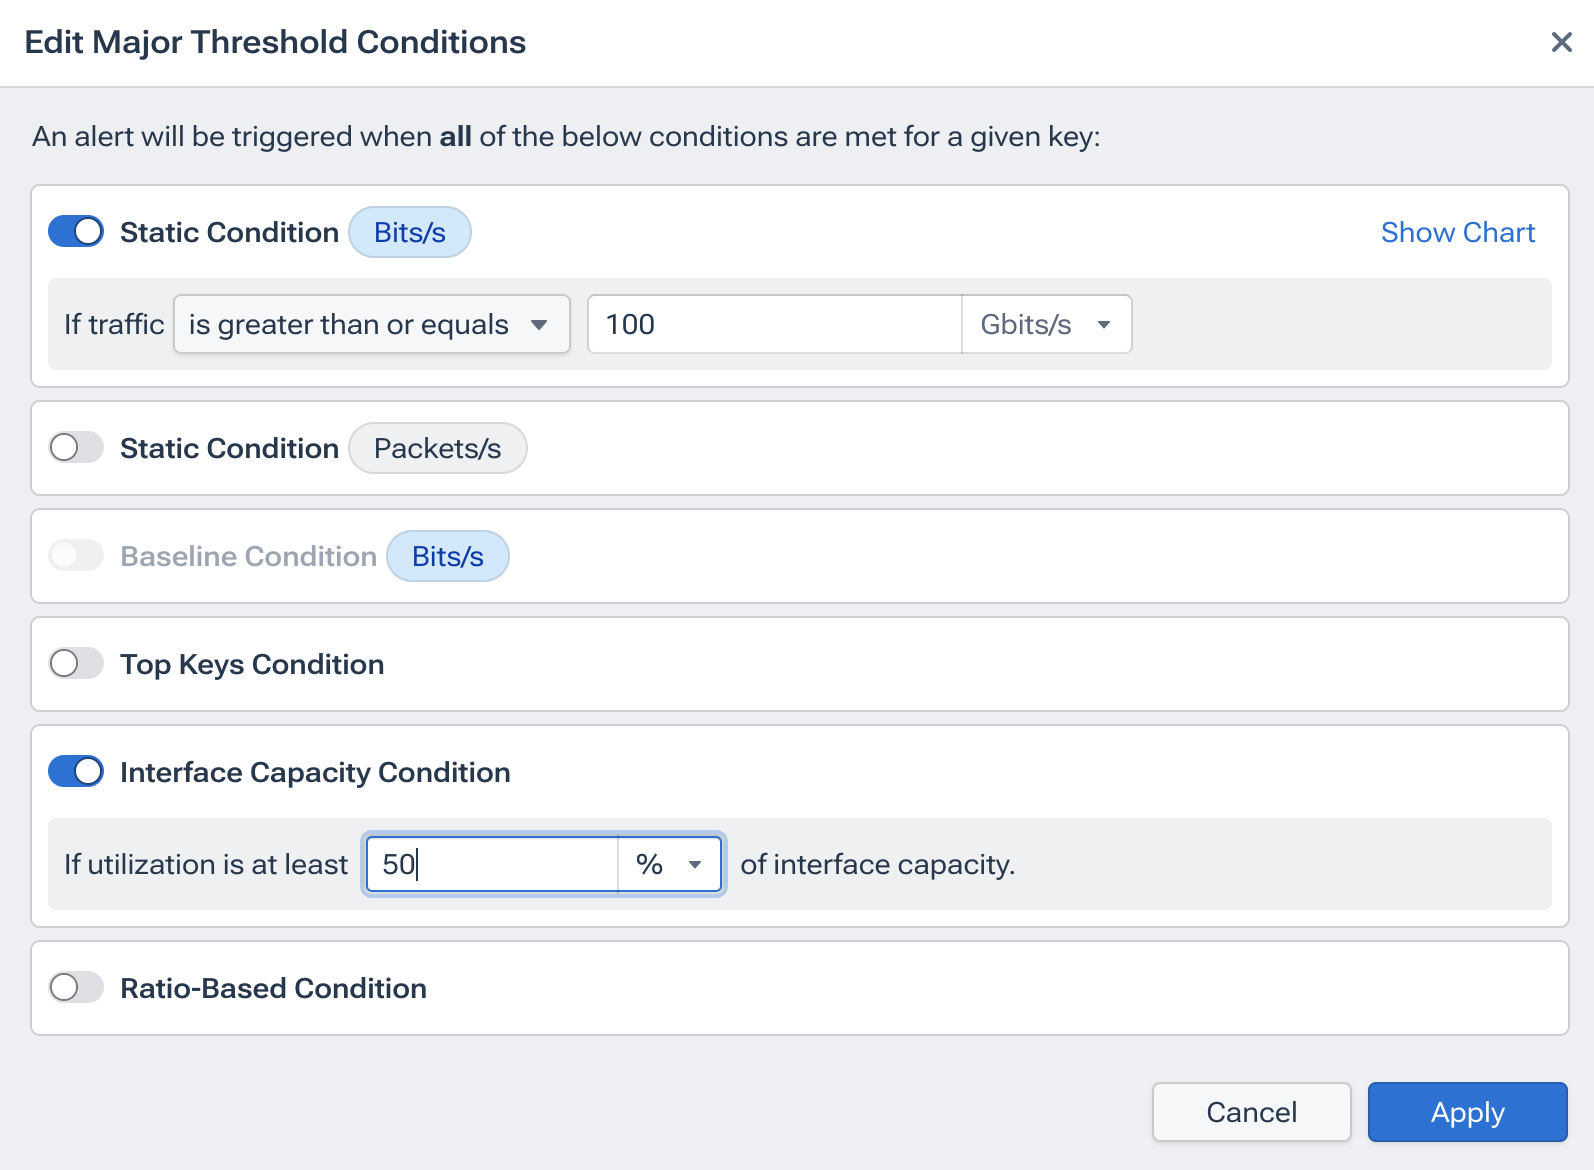
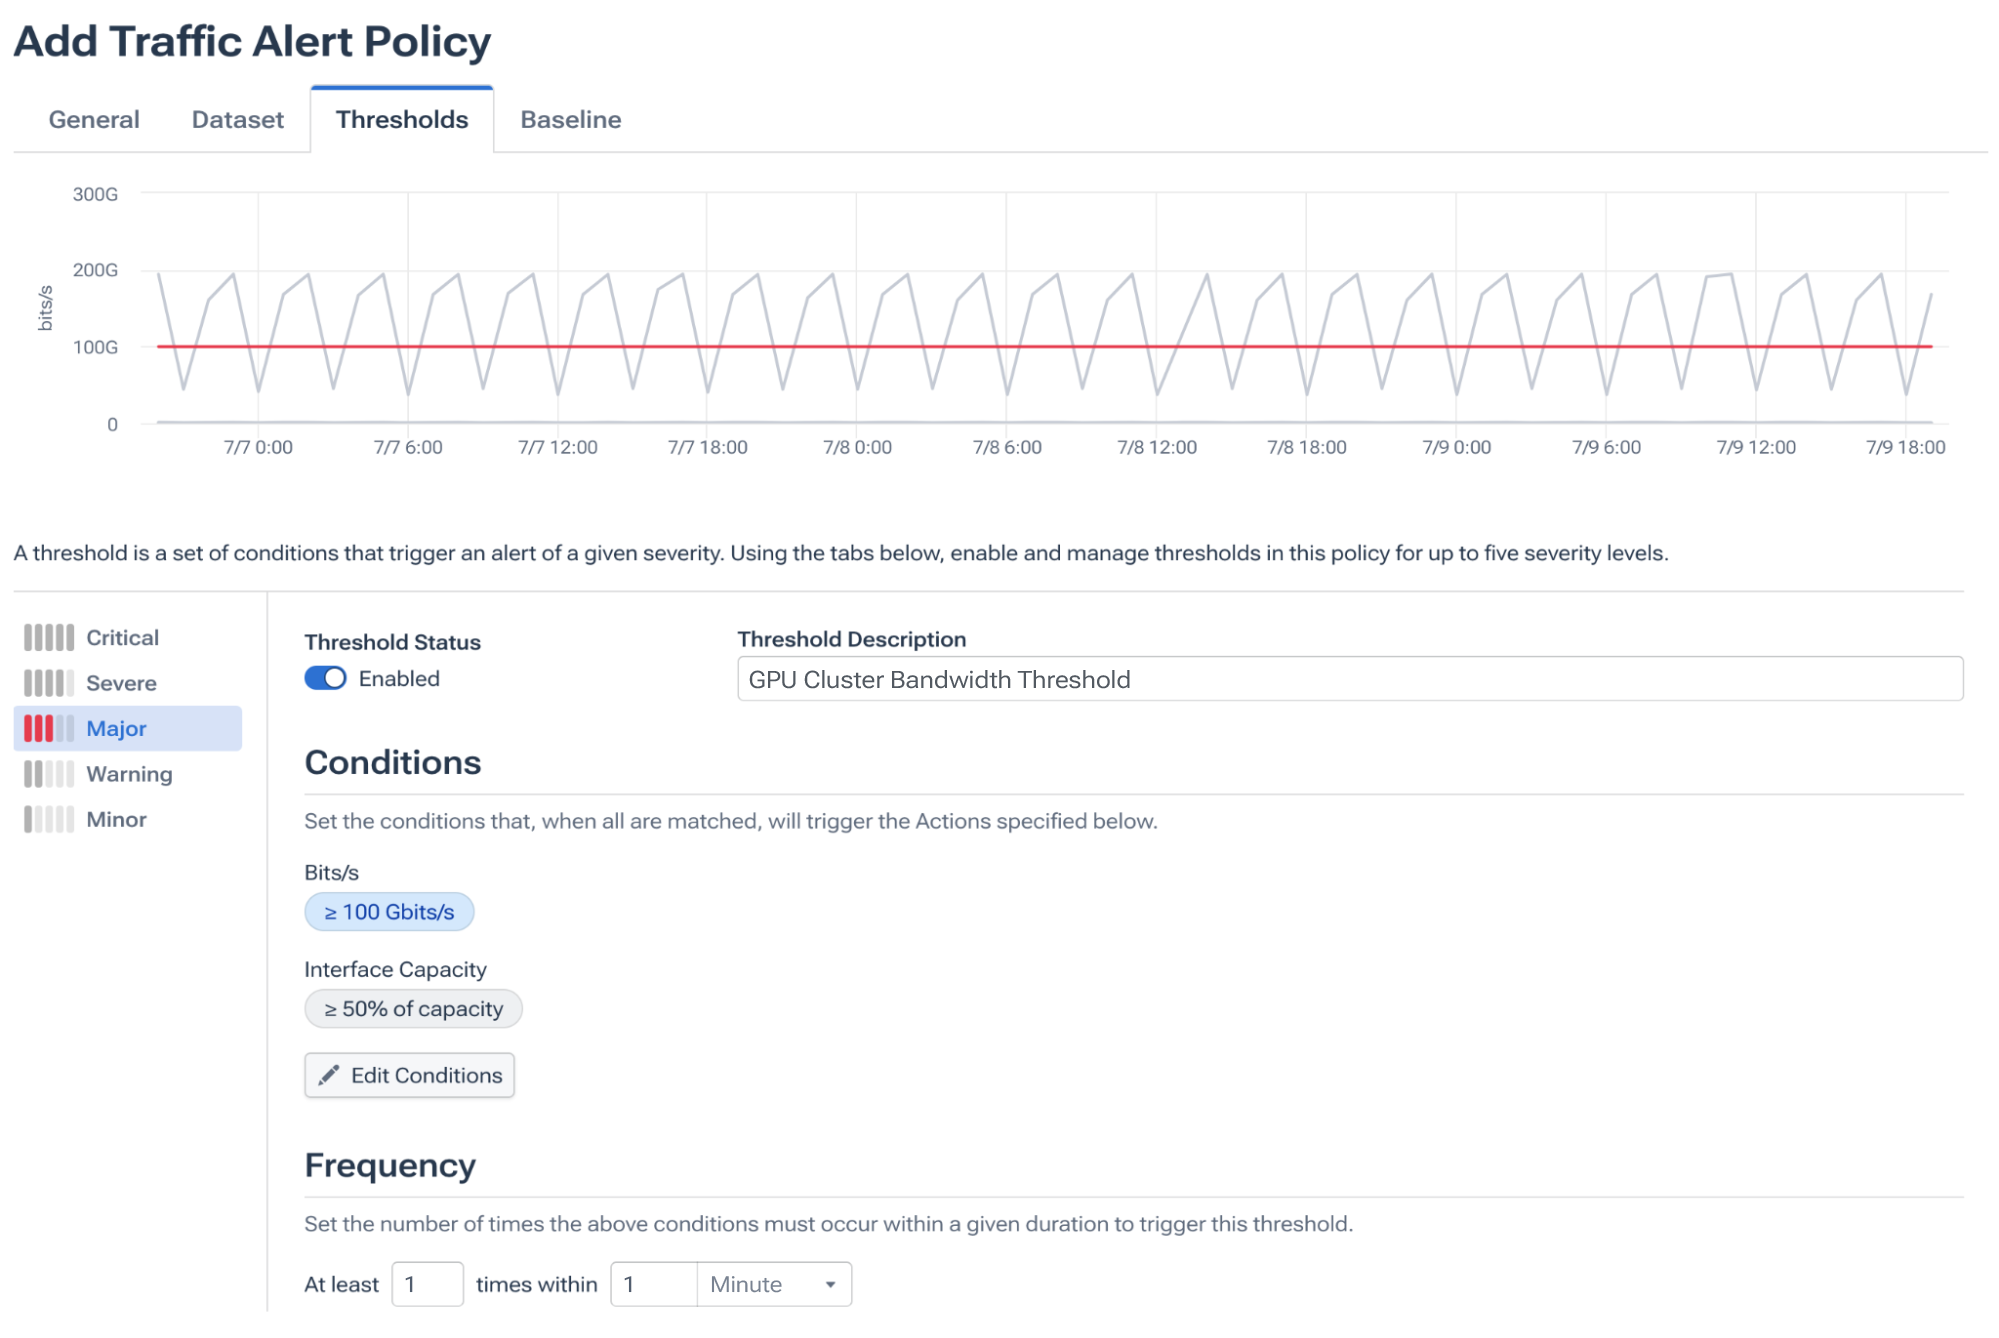
Whether you select absolute numbers or allow Kentik to learn normal behavior for every hour of the week, the goal remains the same: codify operational knowledge so the system can act without human intervention.
Fine-tuning alert sensitivity
Kentik offers a safe “monitor-only” mode that replays a draft policy against past data and shows how often it would have fired. This is where you adjust thresholds up or down, change aggregates from maximum to P95, or extend the look-back window until false positives are eliminated.
A week of replay usually shows you whether oversubscription spikes are real or if your backup job simply runs at 1 am every night. Then we can label the finished policy with a relevant name, such as “AI Fabric CPU Saturation,” instead of a raw metric so others on the team know why it matters months later.
Integrate alerts into your workflow
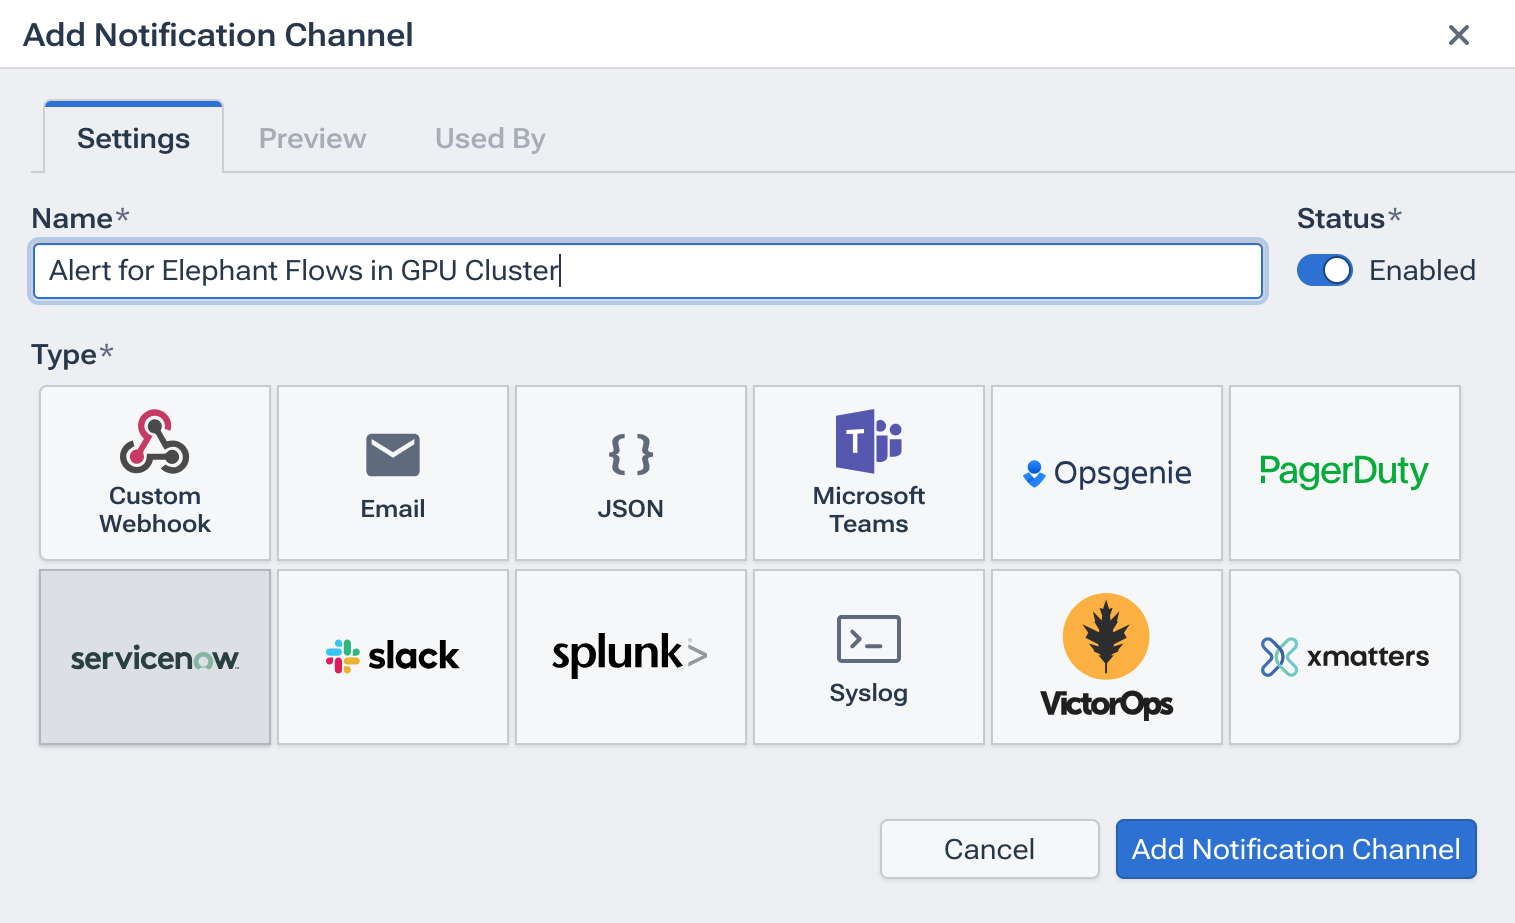
An alert nobody sees is pointless, so Kentik lets you push notifications to nearly anything. That could be a webhook destination to ServiceNow, PagerDuty, or an email destination that copies the on-call alias or capacity-planning team list.
And many engineers double up. For example, critical events would trigger the opening of a ServiceNow ticket and page the SRE rotation, while lower-severity idle link alerts could be delivered as a weekly email summary.
Real-world use cases
Elephant flows slowing GPU synchronization
As a real-world example, Data Explorer can show the top twenty flows in VPC ai-train-east-1. You would then build an alert that fires when any single flow exceeds 10 Gbps per second for longer than 10 seconds, clears when it drops below 5, and then sends a ticket to ServiceNow.
Another example could be a rogue RDMA transfer pinning a leaf-spine link during an AI training run rather than spraying packets more evenly. Kentik would then open an incident with relevant information, giving the on-call engineer time to shift traffic before job completion time spikes.
Idle spine links wasting CapEx
To better manage idle links, we could run a query that examines the average bits per second over twenty-four-hour periods for every spine uplink. Any port that stays under 2% utilization for seven straight days would trigger a warning email. In the event that there were idle links in the datacenter network, the team could feasibly reclaim dormant optics, re-allocate resources, or re-engineer traffic, thereby delaying a hardware refresh and saving money.
Kentik: Your early-warning network radar
Kentik is much more than a visualization dashboard. Under the hood, it crunches huge amounts of flow records, streaming interface counters, and other real-time network data, then turns those insights into actions. The moment a spine port goes dark, a GPU cluster link oversubscribes, or packets drop unexpectedly, Kentik can raise an alert well before users complain, AI jobs hang, or budgets explode.
Learn more about how Kentik can help optimize your data center networks.
Key advantages of Kentik’s approach:
- Converts real-time network telemetry into actionable, automated alerts for AI-driven data centers.
- Allows for the detection of issues such as elephant flows, idle links, and packet loss before performance is impacted.
- Integrates alerts seamlessly into existing workflows through platforms like ServiceNow, PagerDuty, or email notifications.


