Kentik takes network observability to KubeCon 2022

Summary
We’re fresh off KubeCon NA, where we showcased our new Kubernetes observability product, Kentik Kube, to the hordes of cloud native architecture enthusiasts. Learn about how deep visibility into container networking across clusters and clouds is the future of k8s networking.
If you’re an engineer trying to fix real problems with your apps, looking at just one small part of the picture isn’t going to cut it. This is why Kentik is so focused on helping you understand what’s going on beyond single k8s instances, and it’s a big part of what network observability is all about.
This was Kentik’s message at Kubecon 2022, which was a memorable event for us. The conference was larger than in the past, the location was perfect, and our team was excited to show off Kentik Kube, a recent addition to our observability portfolio.
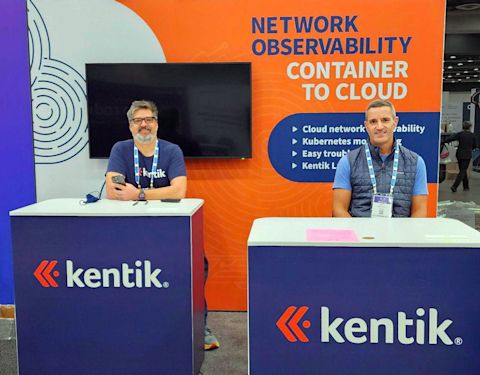
We’re excited because Kentik Kube is our groundbreaking new way to get deep interactive visibility into container network connections and performance. We’re already super nerds when it comes to network telemetry in general, so collecting metrics from k8s clusters and visualizing them in our portal was the natural evolution of what we’re already good at.
The reality is most organizations are at least somewhat hybrid in that they have on-prem data centers, a public cloud footprint, and k8s clusters communicating between them. The micro-services apps running in these clusters have to communicate with each other as well as with the outside world, so we want to understand if any of these communications is failing or is slow, not to mention if there is communication going on that’s unexpected and could be a security issue.
We also want to understand the bigger picture of what connects with what else and how, and whether the policies are set up in a way to allow that (NACLs, Routes, etc.). Tying our latest container visibility advancements into our larger platform of telemetry and analytics provides a much broader understanding of what’s going on than by isolating k8s instances alone.
At these types of tech conferences, we like to do demos that show how you can use Kentik to solve real problems, so Mike and Paul walked through a scenario in which an application built on k8s was performing slowly and how to use Kentik Kube to figure out what’s going on.
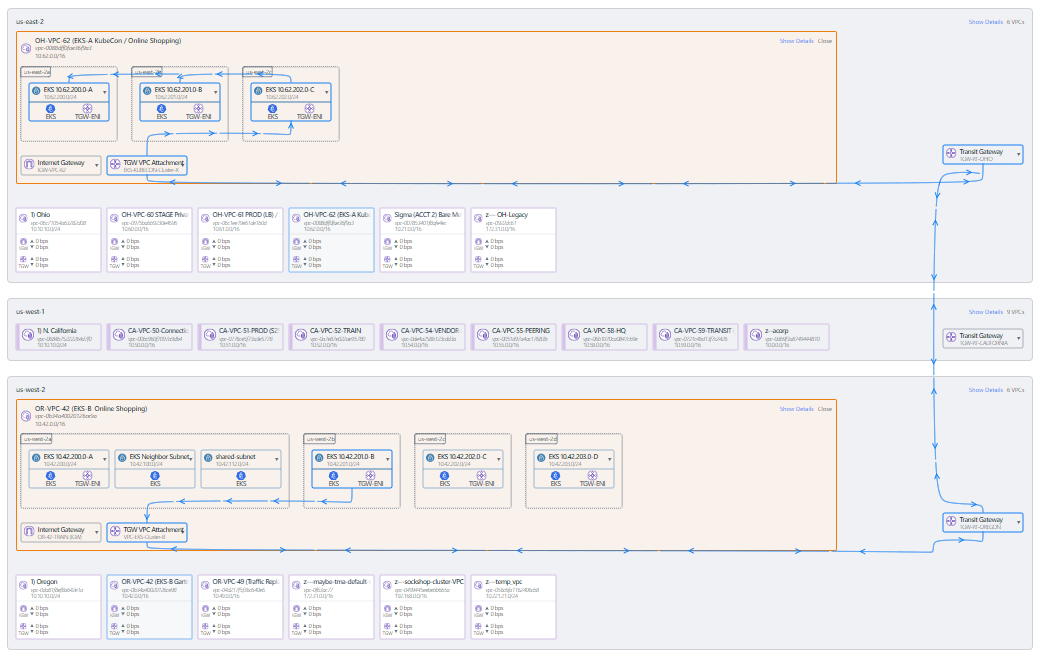
Remember when I said visibility from the container to the cloud? Well, check out the graphic below, a screenshot from our Kubecon demo. You’ll see that this cluster communicates with the internet (which makes sense as it runs a customer-facing store), but using “show path,” you can see it also communicates with another EKS cluster in US-East-1.
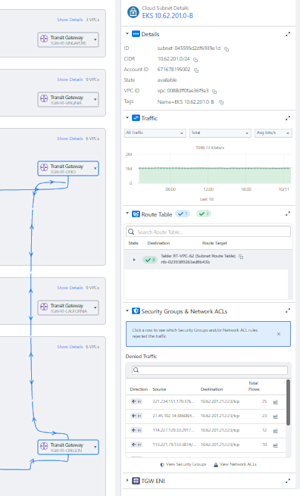
We can go deeper to see that NACLs, etc., are all configured correctly; there’s no denied traffic, and the route tables look okay. So far, the issue is not between these two clusters.
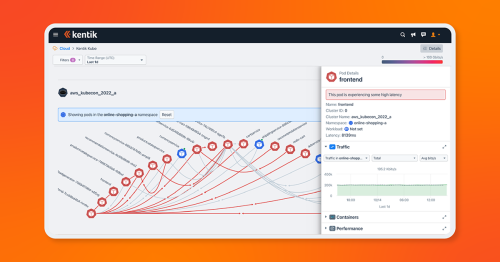
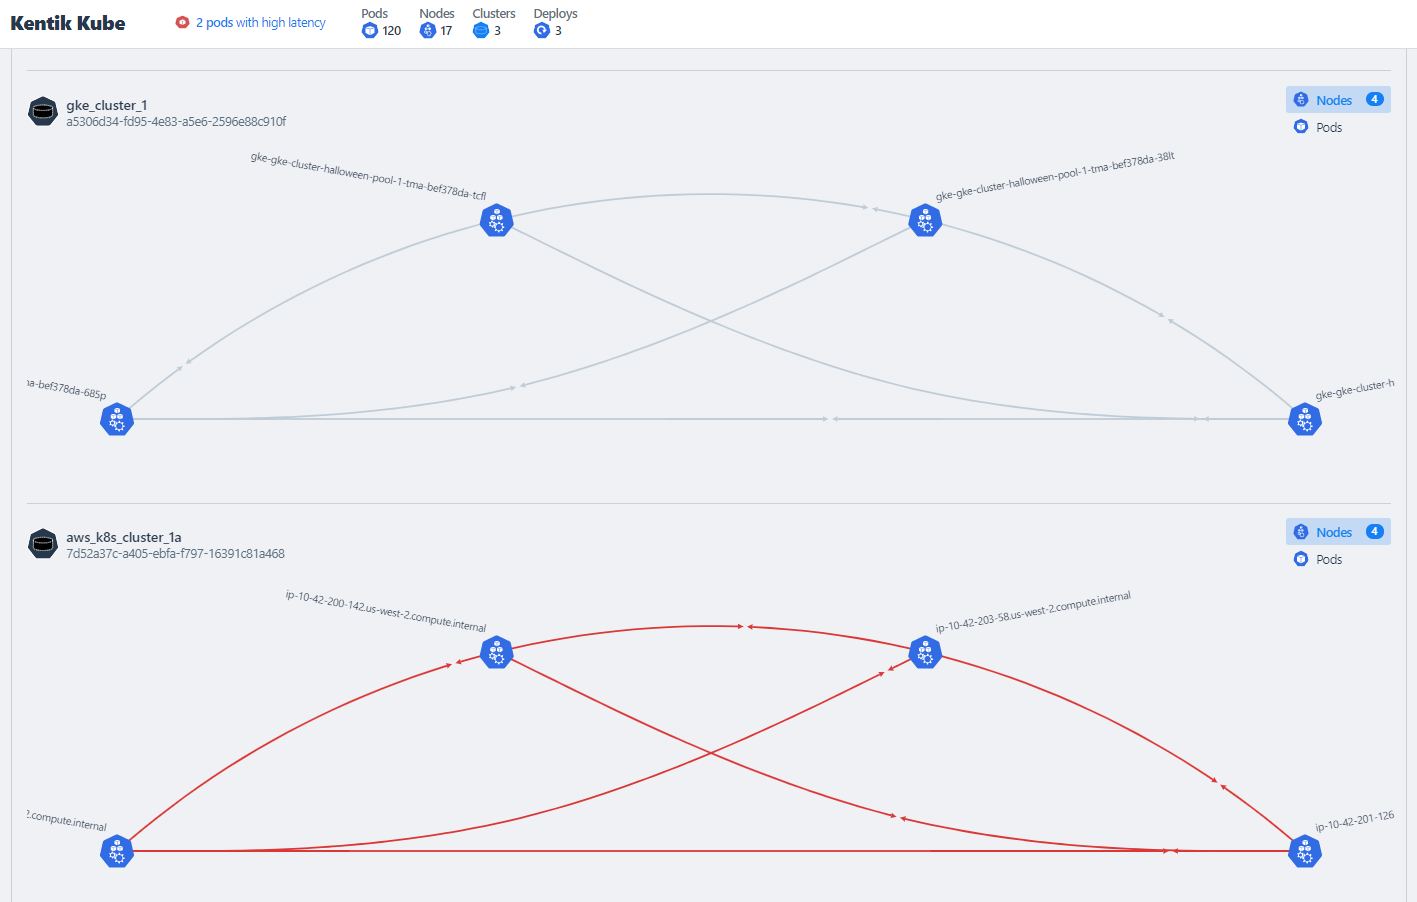
It’s time to really dig into the k8s communication, which we do by deploying an eBPF telemetry agent into these clusters. Notice in the graphic below that you can see the four nodes in our cluster. You can see the traffic between the nodes and that there’s some considerable latency going on.
This next part is even cooler. Look at how we can drill down into specific nodes to see several interesting details. You can see the list of pods that are running on this node, their traffic profile, as well as the fact that there’s been a recent problem with latency.

Of course, knowing that there’s latency at the node level is helpful, but we really want to see what causes the app to be slow. Kentik allows us to drill down even further to see the namespace – and voilà! You can see all the pods, how they communicate with each other, the amount of traffic they exchange, and the latency between them.

And there’s the smoking gun: The pod hosting the frontend of our app is experiencing high latency impacting all the communications that go via this pod.
Most of our applications are delivered over the network today, and of those applications, many of them are built on a distributed k8s architecture. This means that a ton of application-relevant telemetry is embedded right into the network. Kentik Kube provides you the very unique ability to see what’s going on with your k8s networking, from the container level itself all the way to the cloud.
To learn more about Kentik Kube, request a live demo.
