Summary
VPC Flow Logs Blog Post: The migration of applications from traditional data centers to cloud infrastructure is well underway. In this post, we discuss Kentik’s new product expansion to support Google’s VPC Flow Logs.
It’s no secret that the migration of applications from traditional data centers to cloud infrastructure is well underway. And it’s tempting to think that “the network” is just one of the many infrastructure management headaches that disappear after migrating to the cloud. However, most organizations find that understanding the network behavior of cloud-deployed applications is still a critical part of ensuring their availability and performance. In many cases, even more important than before, with the increasing scale and distributed nature of modern applications.
Because the underlying network devices are abstracted away from the end user in cloud environments, cloud providers haven’t historically been able to provide detailed telemetry about network activity. So ops teams weren’t able to rely on data like NetFlow, sFlow, and IPFIX that they used to use in traditional data center environments to get a full understanding of how applications talk to each other on the network. This loss of visibility and traditional tooling — “going dark” — was an unfortunate but required tradeoff when moving to the cloud.
Fortunately, that situation is now changing for the better. Google recently announced the availability of VPC Flow Logs for the Google Cloud Platform which provide detailed, real-time telemetry of network activity within and between VPCs inside GCP projects. It’s very much like NetFlow for VPCs, but better. VPC Flow Logs provide 5-second granularity, whereas NetFlow is typically 1-minute granularity. VPC Flow Logs also contain fields with network latency measurements, and tags that identify various attributes (VM, VPC, and region / zone names) associated with the source and destination of the traffic, which provides extremely useful context about each flow, and the underlying network activity it represents.
VPC Flow Logs are now supported in Kentik with Google Cloud Platform-specific tags
Kentik now also supports VPC Flow Logs as a data source and fully exposes the GCP-specific tags as dimensions and filter terms through the Kentik UI. This means Kentik customers can get full visibility into network activity within GCP projects — and also between GCP and traditional data centers in hybrid cloud architectures. The latter situation is one where customers have told us they are especially blind.
Kentik + VPC Flow Logs provide teams across the operations spectrum an extraordinarily useful tool to ensure the availability and performance of services, and maintain a great user / customer experience.
VPC Flow Logs for DevOps or SRE Teams: Improved Situational Awareness and Service Assurance
“What happened?” or “What is happening?” is always the question of the moment. When services go down or some other unexpected condition is impacting user experience, the clock is ticking. Logs are essential, but often don’t tell the whole story. The network “sees all,” and Kentik’s ability to retain a detailed, real-time picture of network activity provides instant answers to key questions like:
- Who / what is talking to the service in question? Top talkers?
- How has traffic volume or distribution changed after the incident started?
- Is this the only service affected, or do other services see similar changes?
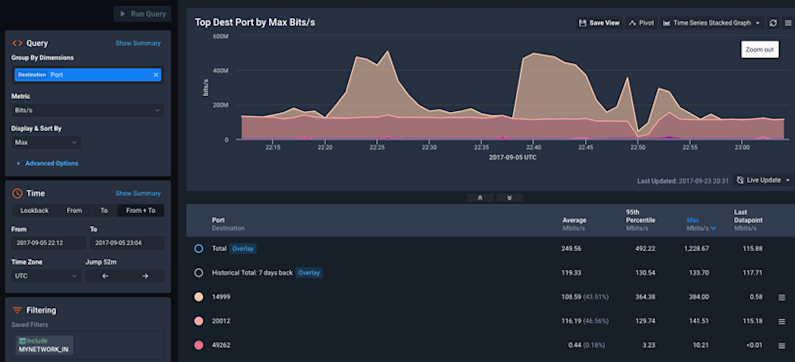
Fast filtering, pivots, and drill-downs let teams quickly get to root cause and gather the details they need to restore services to healthy state. Going a step further, Kentik also baselines normal traffic distribution to / from services or hosts, to provide proactive detection of potential problems when conditions change for an even faster response. As an API-first platform, Kentik is also easy to integrate with cloud deployment and incident response toolchains.

VPC Flow Logs for NetOps and NetEng Teams: Comprehensive Planning and Trending
At scale, GCP projects quickly become complex. Various application tiers may be deployed across multiple zones and regions, and potentially communicating with remote services in a hybrid or multi-cloud architecture. Without a way to visualize traffic flows and service dependencies, it becomes nearly impossible to understand the big picture and take a data-driven approach to cloud infrastructure planning and growth.
Kentik’s flexible visualizations and dashboards can provide NetOps and NetEng teams with easy answers for:
- Traffic growth trending and capacity planning. Do we need to add Google Cloud Interconnects? Where?
- Top traffic producers and consumers. Which services create the highest cost exposure for inter-zone traffic? Can we reduce cost by changing where some services are deployed, or refactoring them to be more network efficient?
- Which global geo-locations are accessing my services? Are users being served by the zone that provides them the best performance / experience? Would some user segments be better served by deployments in new zones?
- Service dependency mapping. Which Google services and legacy data center services does my application depend on? If I migrate or decommission this service, which other services will be affected?

For SecOps Teams: VPC Flow Logs Enable Detailed Security Analytics and Forensics
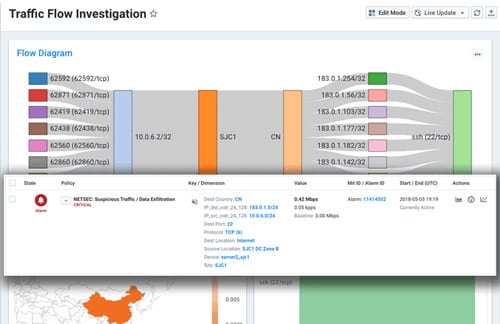
Controls, policy, hardening and patching are all still basic tenets of security engineering and operations. But incident response is also a key capability for modern security teams. Competent incident response requires data — lots of it, and fast. Kentik’s ability to let users quickly navigate through a comprehensive log of network activity provides insight for security teams which is both broad and detailed. Since the network is both the point of entry and internal transport for threats, VPC Flow Logs provide pervasive instrumentation of potential threat activity to, from, and within GCP projects.
Kentik’s fast, detailed archive of all VPC network activity can provide SecOps teams with the details they need for:
- Real-time awareness. Which connections are currently active to / from suspected compromised VMs? Where do they originate? What else has that source talked to in my environment?
- Timeline. When did this activity start?
- Understanding scope / lateral movement. Were there subsequently any suspicious connections from this VM to other VMs in the VPC? To VMs in other VPCs or projects?
- Uncovering potential data exfiltration. Were there any unexpected high-volume traffic flows from this VM or others out to the Internet?
Kentik’s streaming alerting engine also baselines past network activity and provides notifications of potentially malicious activity, like traffic from unexpected geographies, or traffic between host pairs or service pairs that haven’t been seen before.

For Management and Executives: Audit Cloud Networking Costs
Cloud data transfer costs 10 times wholesale Internet bandwidth rates, and even inter-VPC traffic costs more than many organizations pay for Internet connectivity. A key use case we see for Kentik customers is proactively monitoring for new applications consuming Internet, cloud interconnects, and inter-VPC traffic and nipping misrouted traffic in the bud. For example, traffic going over the Internet that should be going across private connections, or former customers pounding APIs and causing traffic charges.
This is an extension of a classic cost optimization use case for running customers’ in-house infrastructure, but it has become even more pressing with higher cloud bandwidth costs.
Getting Started with Kentik + VPC Flow Logs
It’s easy to add VPC Flow Logs from a GCP project into your Kentik account.
To summarize the steps:
- Enable VPC Flow Logs for one or more VPCs in your GCP project
- Enable export of VPC Flow Logs to a GCP Pub/Sub topic, and create a pull subscription with appropriate permissions for Kentik to access that topic.
- Set up the virtual device in Kentik that will act as the container for VPC Flow Logs from this topic / project.
For detailed instructions, see the Kentik for Google VPC article in the Kentik Knowledge Base.
If you need a Kentik account, you can sign up for a free trial here.

