Investigating digital experience with Synthetic Transaction Monitoring


Summary
Investigating a user’s digital experience used to start with a help desk ticket, but with Kentik’s Synthetic Transaction Monitoring, you can proactively simulate and monitor a user’s interaction with any web application.
Kentik Synthetics is all about proactively testing and monitoring specific elements of your network, the services it relies on, and the applications it delivers. That means using artificial traffic instead of end-user traffic to test a variety of aspects of digital experience monitoring like device availability, DNS activity, web application page load times, and BGP activity.
But to test an end-user’s experience interacting with a website, we need to approach things differently.
What does STM solve?
Kentik’s Synthetic Transaction Monitoring takes you up the stack from monitoring the network layer and expands Kentik’s suite of application tests. Along with the HTTP test and Page Load test, with Synthetic Transaction Monitoring, or STM, you can test the availability of an HTTP service, analyze how every component of a web application is loading, and simulate an end-user interacting with the web application itself.
Imagine an ecommerce website hosted in several public cloud regions. Your customers access it from all over the world to log in, make purchases, book flights, reserve cars, or leave comments on a news article. Rather than collect passive information that tells you simply that the website is up or down or how much of one particular protocol is consuming your WAN interfaces, STM actively tests what it’s like to log into your site, click on various elements on the web page, add something to the shopping cart, and so on.
Every step in an end-user’s interaction with a site can be simulated, which means you have the ability to monitor the digital experience of an end user without having to wait for trouble tickets to come in. These could be sites you host in your private data center, in a public cloud or delivered by a SaaS provider.
How does STM work?
STM uses Kentik’s hundreds of global agents dispersed throughout the world to run proactive tests against a specific target, for example, your public website. These agents are programmed to programmatically run a script that simulates an end user logging into the site, clicking on objects, adding items to a shopping cart, and doing whatever it is that’s relevant to you and your business.

The script is embedded within the tool, and though you can create it manually, you can also generate it automatically by performing the actions you want to test in a Chrome browser and recording the transaction using the built-in dev tools recorder. After that, it’s a simple matter of exporting the activity as a Puppeteer script and pasting it into your test.

The test can be as simple or complex as you need it to be, and it can run as frequently as you want. The beauty is that you’re using artificial traffic and not actual end-user traffic. This means you can monitor the digital experience without having to wait for something to go wrong with a real-life person interacting with the site.
The results are a powerful tool for real-time troubleshooting of an application problem, but it’s also the perfect way to monitor an end-user’s digital experience with a specific application over time. This is how STM fits into both the Kentik suite of proactive synthetics tests and also Kentik’s overall network observability solution.
When you correlate active test results with passive information derived from flow data, SNMP, streaming telemetry, and so on, you get a much more complete picture of what’s going on with application delivery over your network.
What you can learn from STM
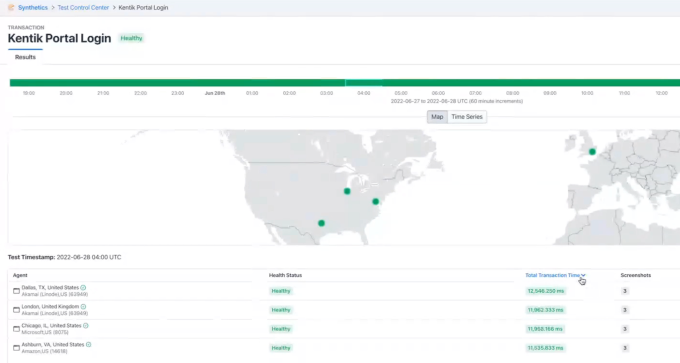
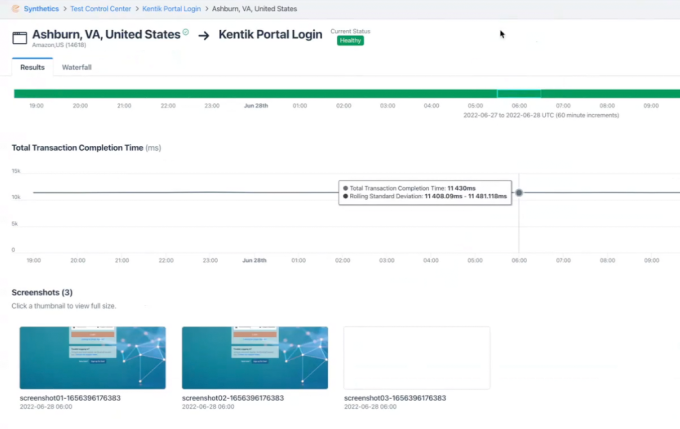
To start, the test results show you the overall health of the test over time. This way you can see at a glance if there are any issues with the simulated transaction over a given time range. For each moment in time, the transaction time will be compared to a rolling standard deviation which is calculated automatically.

That’s very important, but the really awesome benefit of the test is the ability to get much more granular with the individual steps in the transaction.
The system takes snapshots of the website throughout the transaction process, which is a great way for an engineer to see the reality of what’s going on – what a real person would see interacting with the site.

Additionally, performance metrics are collected for every single piece of the transaction script that’s run. The test captures the DOM file so that you can see exactly how long it took for each component to load, and therefore, for each simulated user activity to be processed. Any slowness can be tracked down to a specific end-user activity or specific object on the page.

Lastly, you can perform the test from multiple geographic locations and of course with the variations you need to simulate your own environment.
Watch a short demo
Learn more about Kentik’s STM solution in this short transaction monitoring video where Sunil Kodiyan, one of Kentik’s resident subject matter experts on synthetic testing, walks through how to use the tool to simulate an end-user’s activity and peer into their digital experience with your web application.


