Introducing Kentik Traffic Costs: Real-Time Network Cost Intelligence

Summary
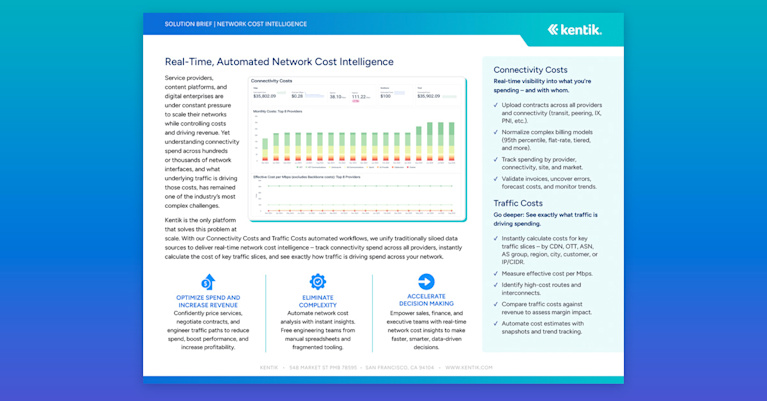
Introducing Kentik Traffic Costs, an industry-first automated workflow delivering instant cost estimates for network traffic slices. Learn how this exciting new feature gives network, financial, and sales teams actionable insights to optimize spend, improve margins, and drive revenue.
“How much is this slice of traffic costing our network?”
For infrastructure engineers and network planners, answering this seemingly simple question has remained a persistent industry challenge for decades. In our recent CIO Dive article, we explored why this problem is so difficult to solve, how engineers are managing today (hint: manually, painfully, or not at all), and why traffic-based cost intelligence is foundational to the financial health of modern connectivity and digital infrastructure providers. The short version: when your business is delivering network services, understanding the cost of traffic delivery is critical to protecting margins and driving revenue growth.
Today, we’re excited to introduce Traffic Costs, Kentik’s newest network cost intelligence solution, purpose-built to solve this long-standing problem at scale. With just a few clicks, this automated workflow gives operators instant visibility into which slices of traffic are driving global connectivity spend – by customer, market, ASN, CDN, OTT application, or even a specific set of IP addresses.
With these insights, infrastructure teams can make smarter decisions about routing, capacity, interconnection strategy, and customer renewal negotiations to reduce costs and increase profitability across the business.
Building traffic-based cost intelligence – a multi-step journey
If you know Kentik, you know we’re obsessed with accelerating work by building the future of network intelligence through automation and AI (just look at our recently launched Cause Analysis capabilities). We start by deeply understanding the manual, time-consuming workflows our customers are still tackling – whether it’s troubleshooting, operations, or planning – and then build those into the platform in a scalable, automated way. The goal: reduce toil, get to answers fast, and free up expert engineering resources for the strategic, high-impact work that drives business outcomes.
Peering, interconnection, and edge teams have long used Kentik to evaluate new peering partners and optimize routing. But over time, we heard a consistent message: We need more visibility into our network’s connectivity costs at the edge, and ultimately, understand what traffic is driving that spend.
So, we got to work.
Step 1: Connectivity Costs
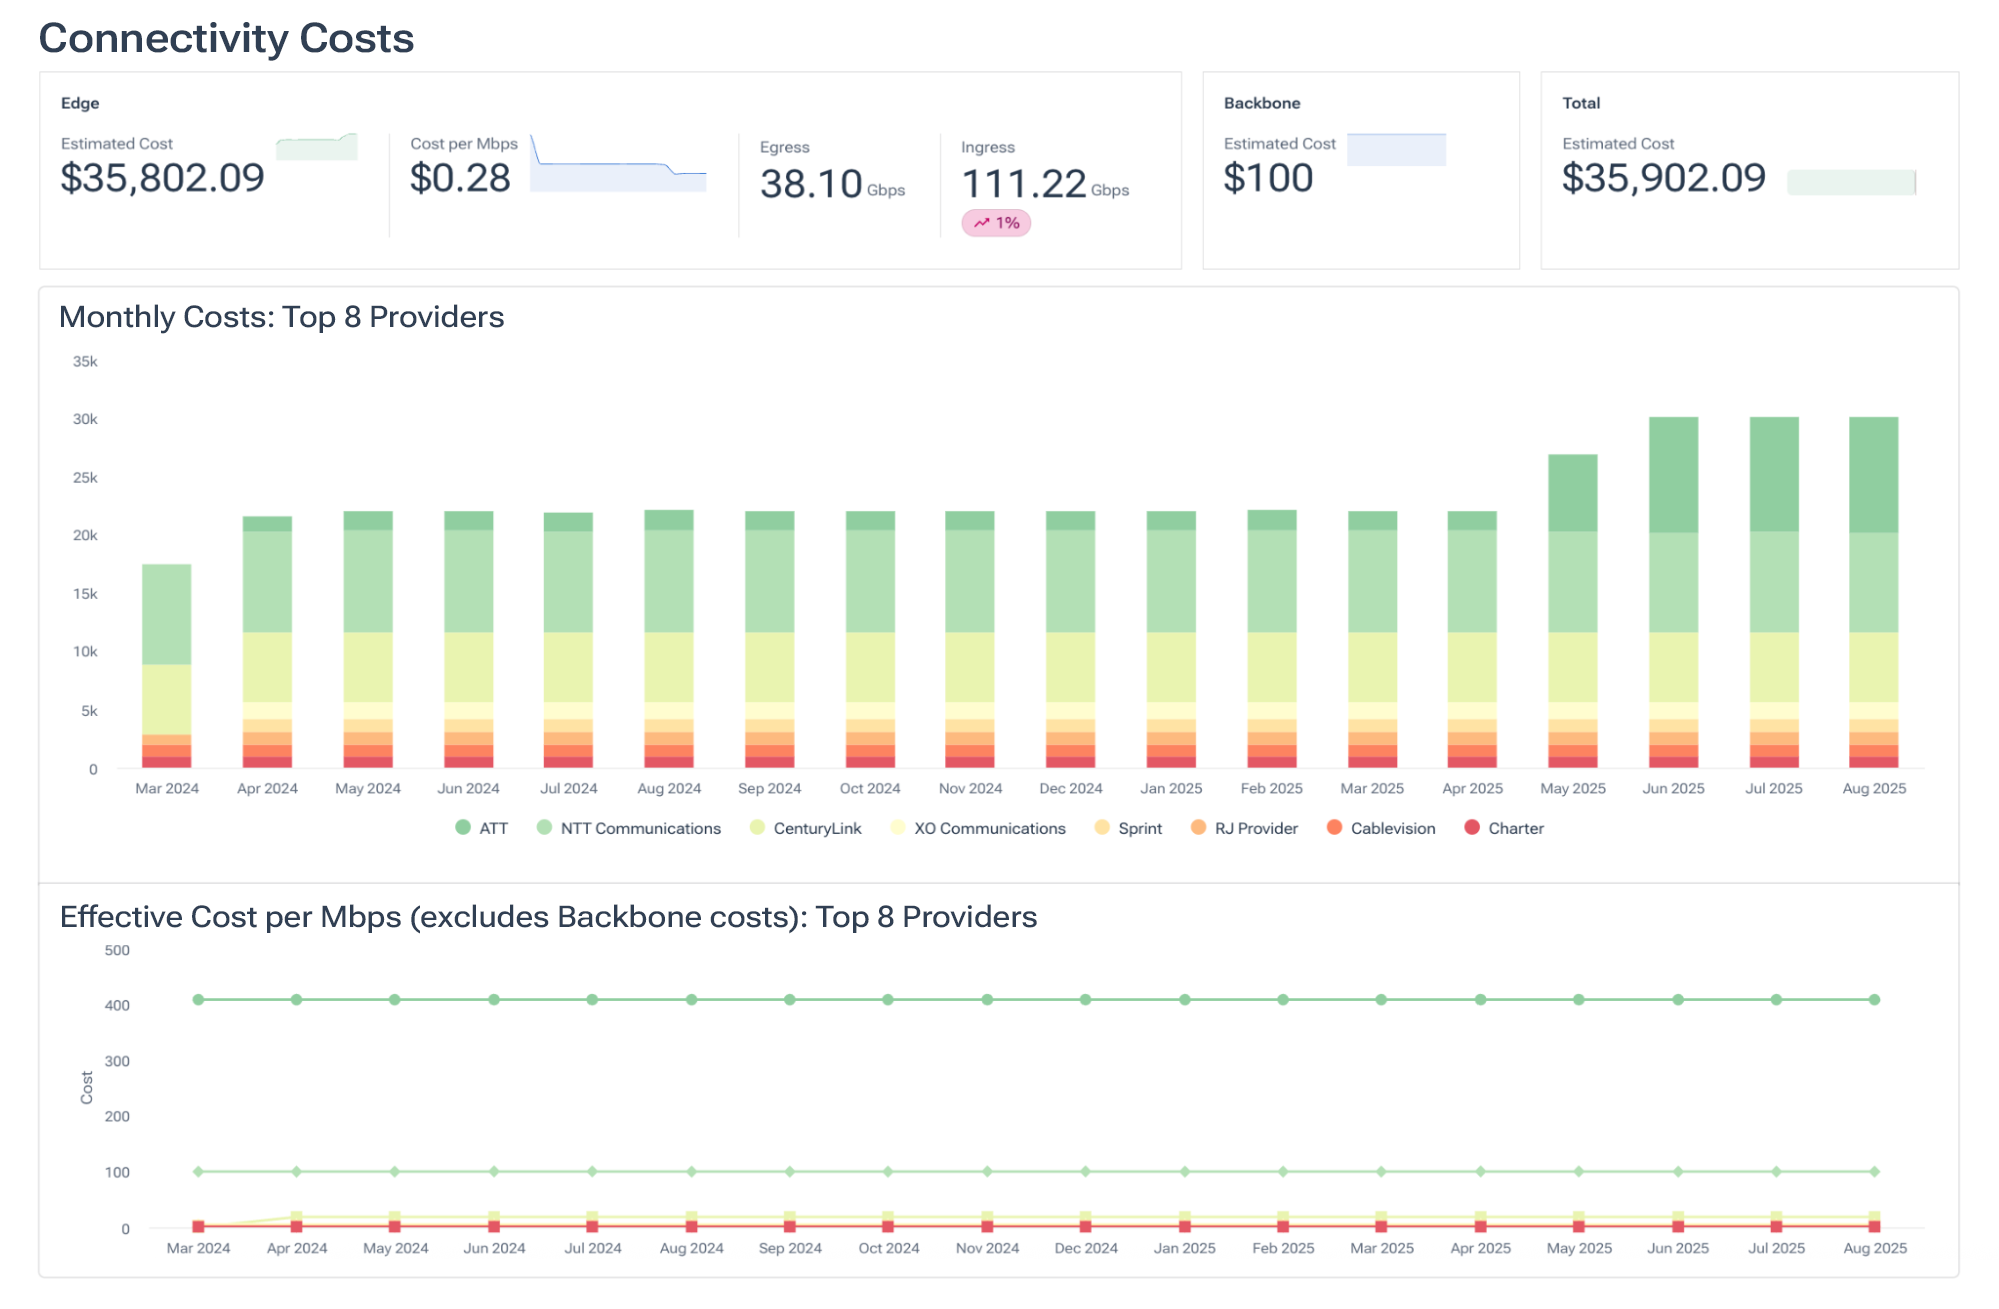
We started with a fundamental building block: visibility into monthly connectivity spending by provider and interconnection type. That led to the launch of Connectivity Costs, Kentik’s first workflow for real-time cost intelligence.
Using SNMP volumetric data (typically calculated with 95th percentile billing formulas on five-minute samples) combined with the contract model and pricing for each interface, Kentik automatically computes monthly connectivity spend across transit, peering, IXs, PNIs, and more.
The result: network operators can finally see how much they’re spending per provider, track trends over time, validate invoices, and forecast future costs with confidence in a single source of truth. With this foundation in place, customers could now answer key questions like:
- How are our transit and peering costs evolving month over month?
- Which upstream providers are the most (or least) cost-effective?
- Is it time to renegotiate, upgrade, or downgrade a commit?
- Is it worth it to pay for a special local provider versus the current transit upstream?
Step 2: Traffic Costs
Connectivity Costs told you how much you were spending, and with whom. But to understand what dimensions of network traffic are behind those costs, we needed to add another layer: flow data.
SNMP tells how much traffic moves through an interface. Flow data tells you what that traffic was, and where it was headed or originated from. It lets you distinguish between ASNs, OTTs, applications, IP groups, and more.
And this is where things get really complex. Each network interface might carry traffic for dozens of different entities – ASNs, OTTs, CDNs, customers, geo, markets, etc., all simultaneously. And each traffic slice might traverse multiple interfaces, each with different cost structures. Understanding the full cost of just one specific traffic slice is a massive challenge without automation.
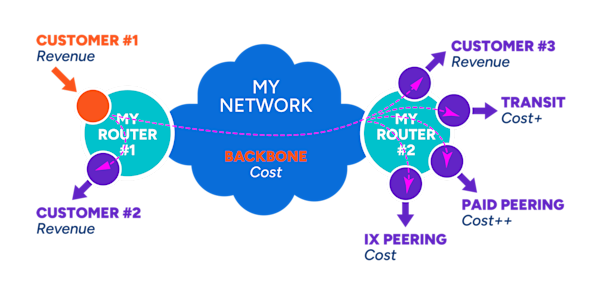
To illustrate this complexity, the diagram above shows how a customer’s traffic (CUSTOMER#1) enters from the orange customer port and exits through all the purple ports to other upstreams. The ROI for each one of these sections of traffic from just one port makes for a complex cost equation that directly impacts the cost per megabits per second (Mbps) that can be sold to this customer. Now multiply this complexity by:
- The number of ports a customer has
- Your total number of customers
- And times two for inbound and outbound, because a certain slice of traffic can cost you both inbound and outbound, depending on the in/out billing direction of each involved port.
All together now
With Kentik Traffic Costs, we bring all three of these components together – the cost structure and traffic volumes of each interface with your contextually enriched flow data. This allows Kentik to draw a complete picture of how traffic moves in and out of your entire network, isolating traffic slices you want to calculate with precision, and then computing aggregate costs for those slices.
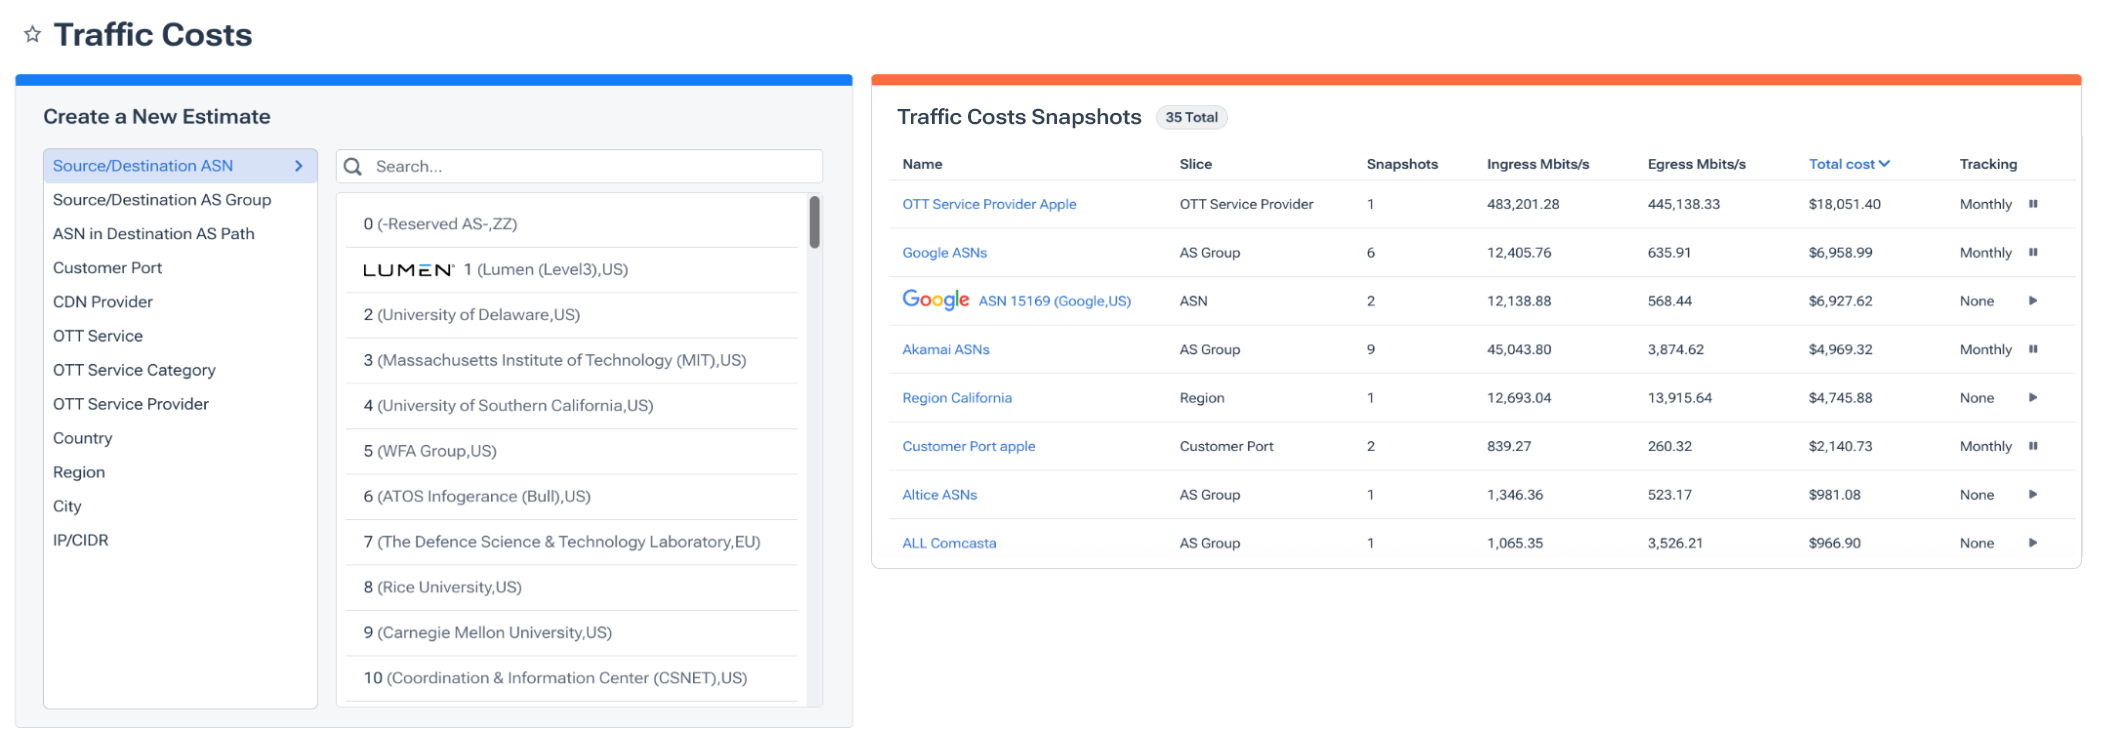
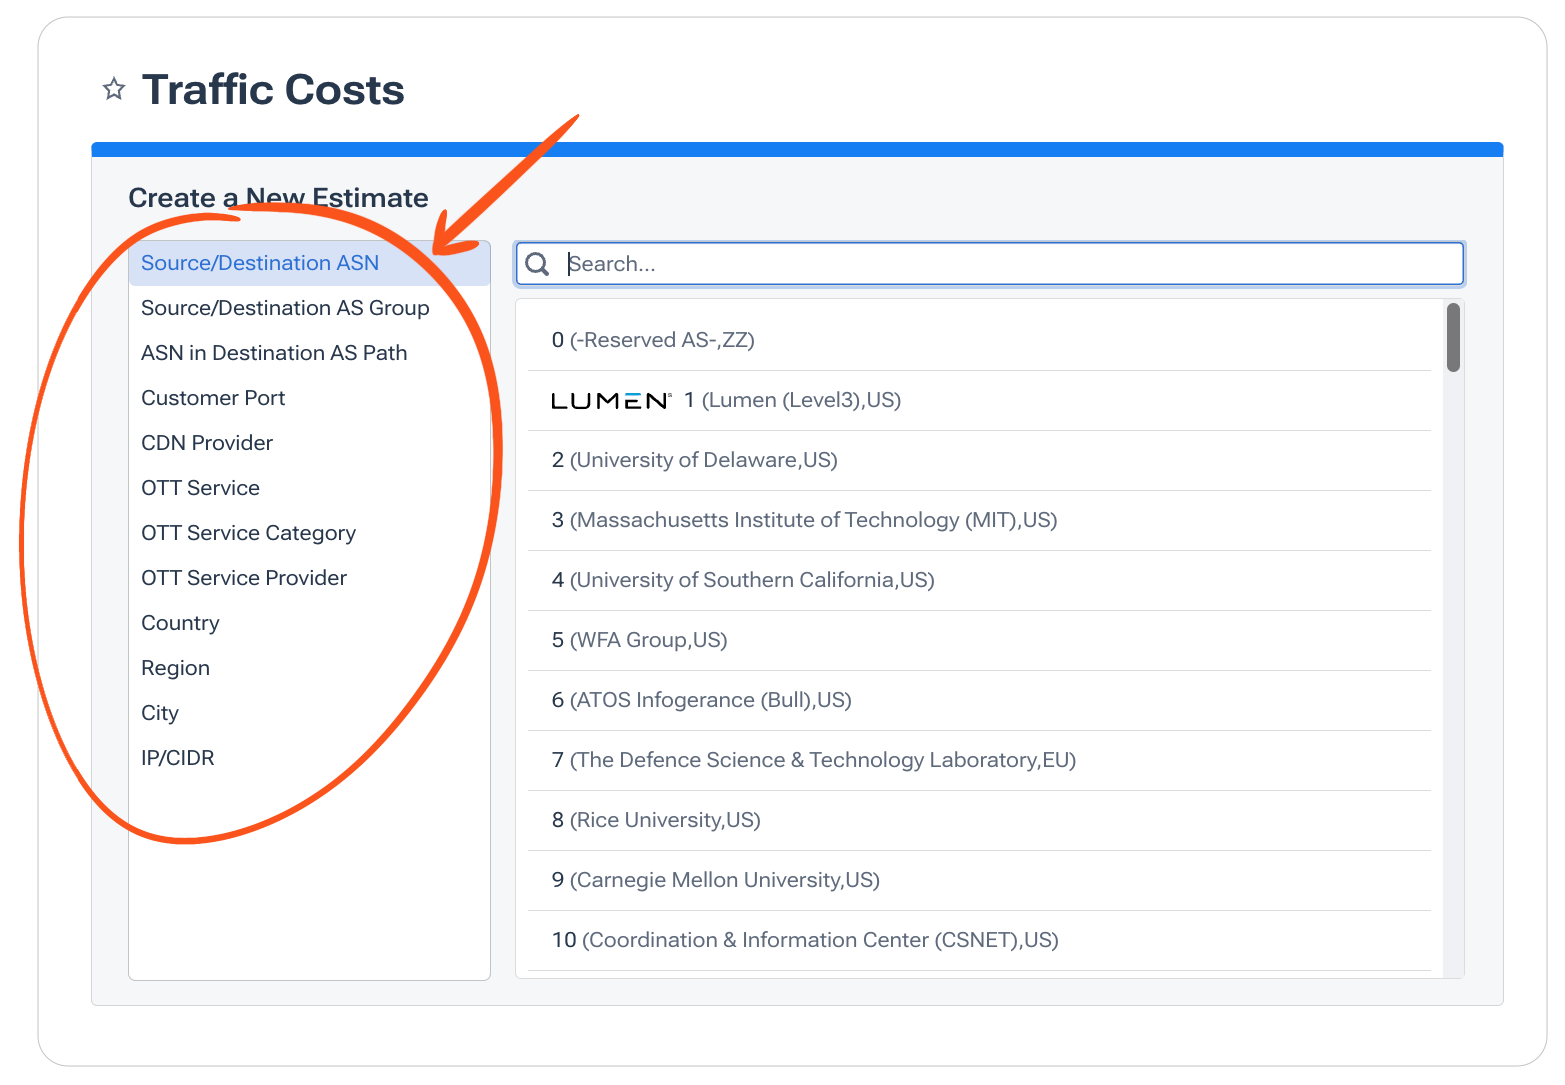
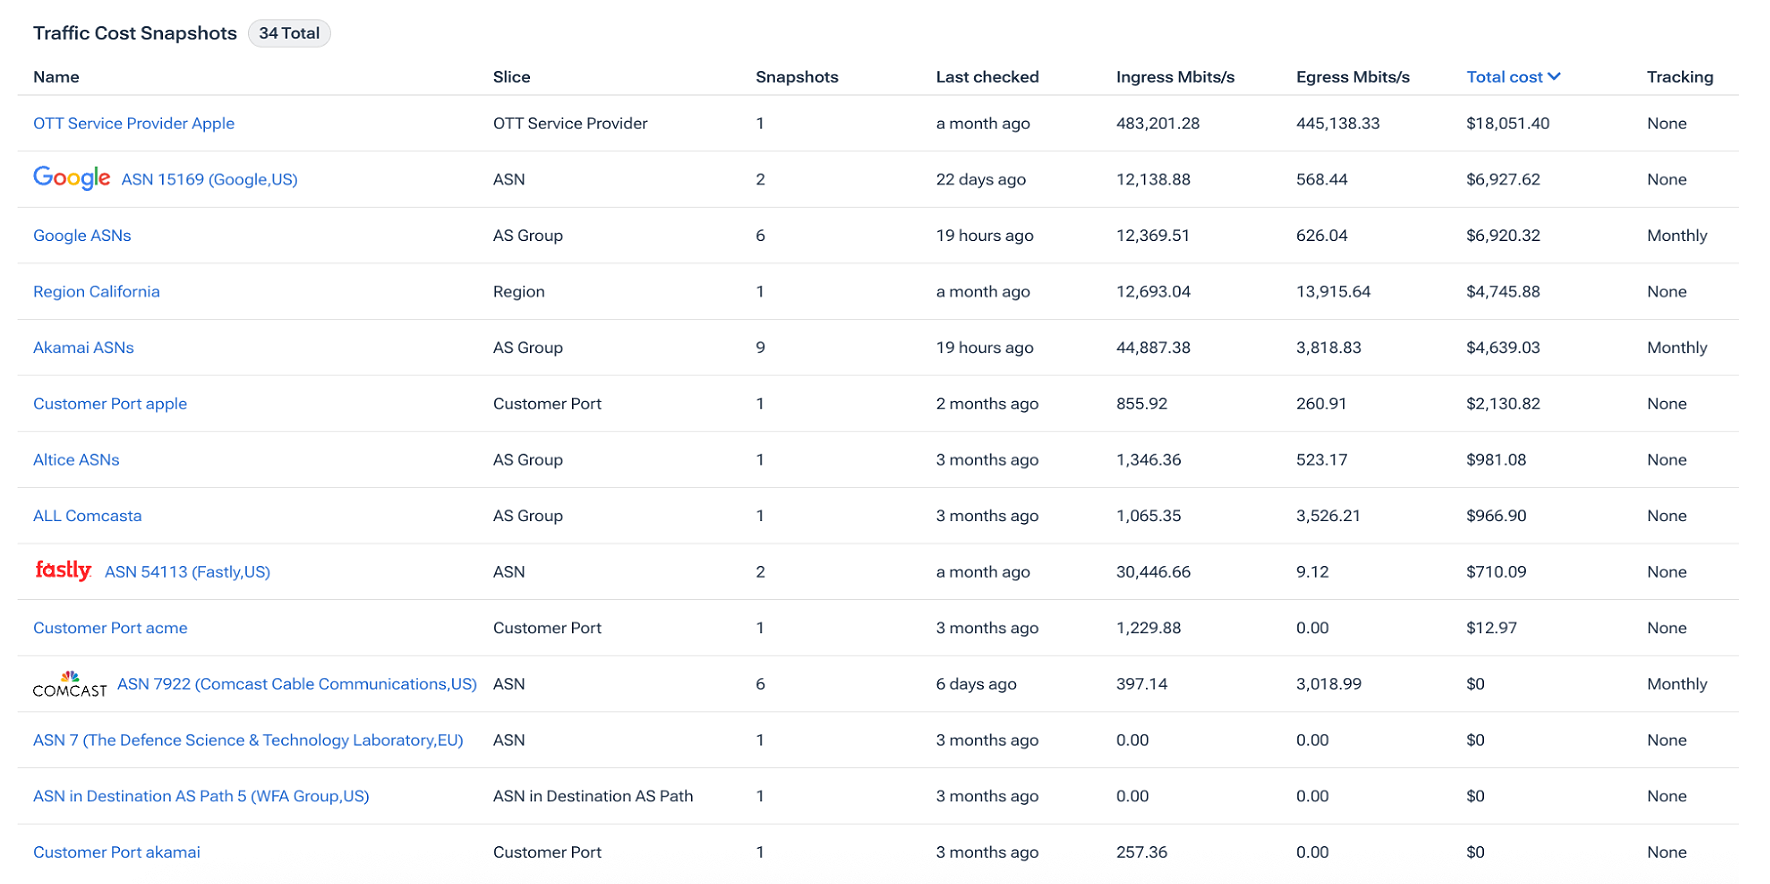
From the Traffic Costs landing page, provided above, customers can instantly get cost estimates across a dozen traffic slice dimensions in just two clicks.
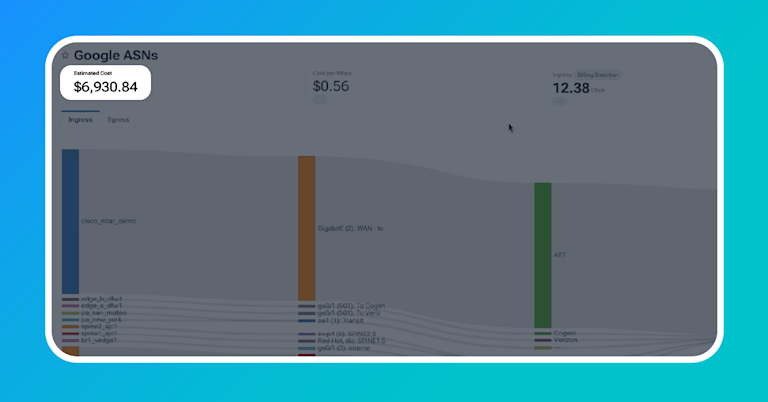
For each traffic slice estimate, Kentik displays the total estimated cost for the month, the effective cost per Mbps, and the associated ingress and egress traffic paths and volumes. You’ll also see percentage changes over time, making it easy to spot whether costs are trending in the right, or wrong, direction at a glance.
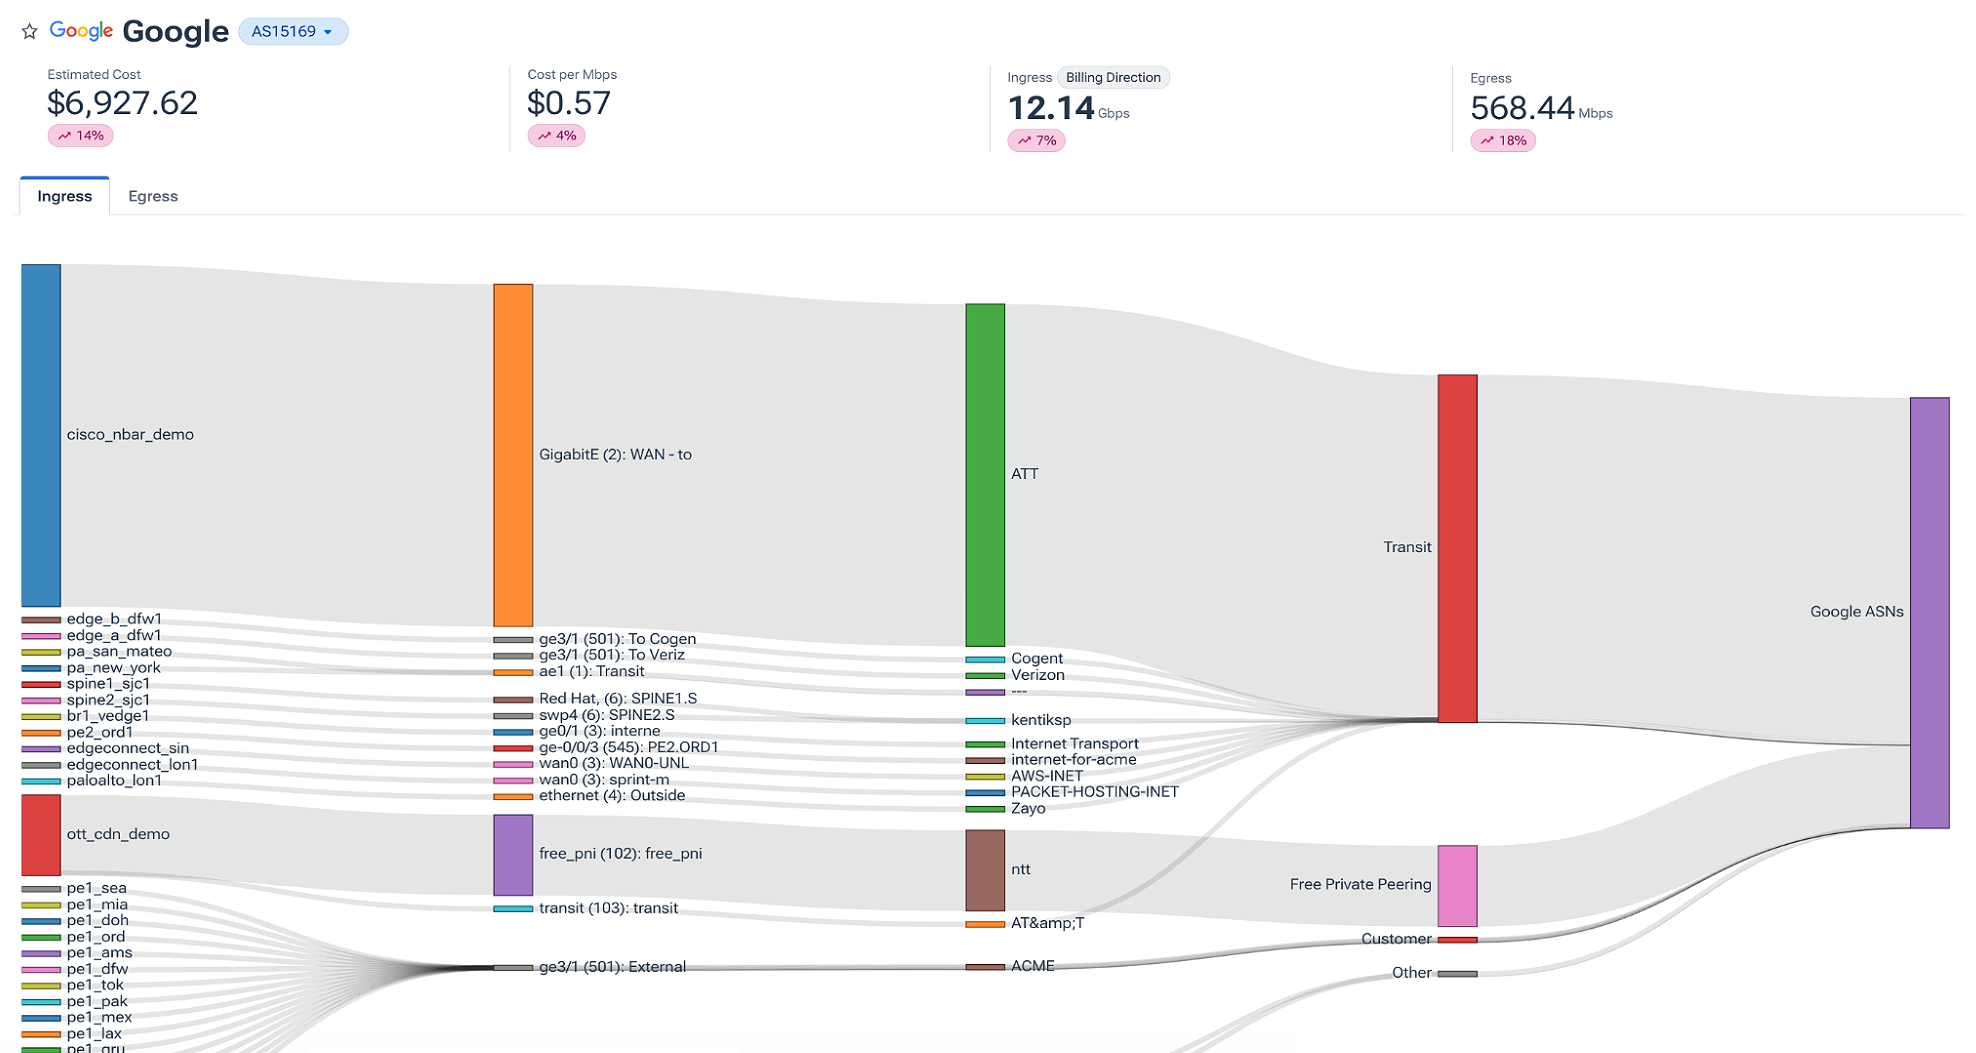
Below the Sankey diagram, you’ll see a cost breakdown for each individual path that the selected traffic slice takes in or out of your network – showing exactly how much each path contributes to total spend. Additionally, Traffic Costs automatically accounts for billing direction, so only relevant traffic is included in the calculation. This makes it easy to pinpoint high-cost paths and take action to optimize them.

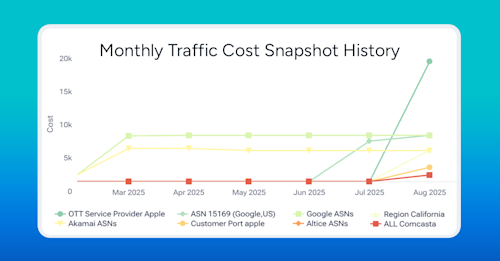
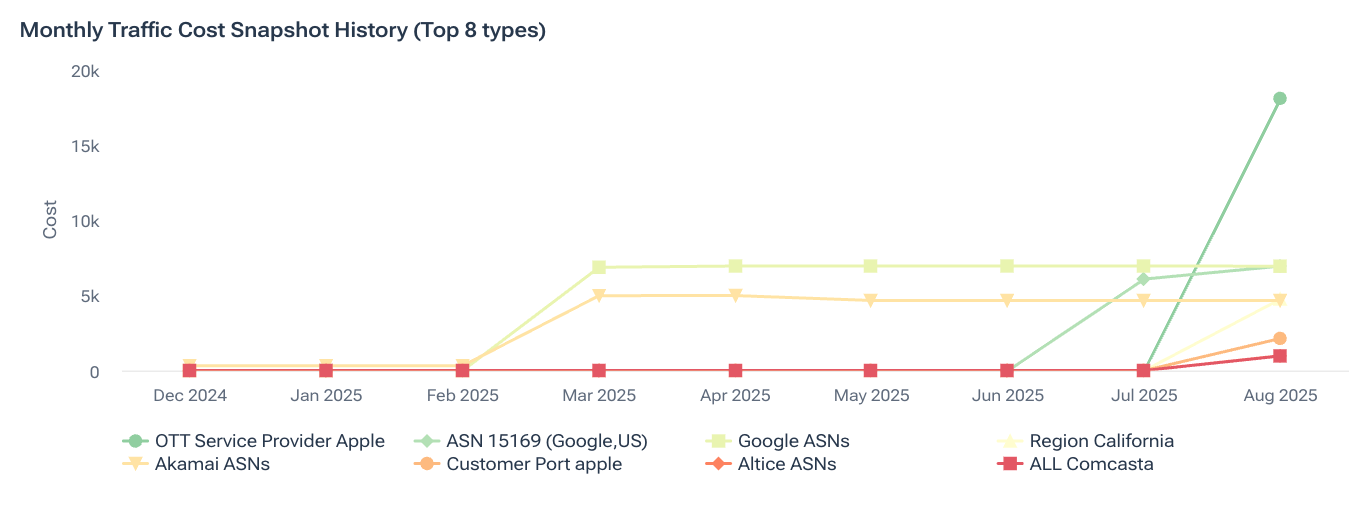
If you want to keep an eye on a particular traffic slice over time, users can simply save the estimate as a snapshot and set up automated monthly snapshots to monitor cost trends for that slice.

On the Traffic Costs landing page, you can quickly see which snapshots you’ve saved, which automations you’re running, and your monthly snapshot history.
Cost insights, democratized
The real power of Traffic Costs lies in its ability to bring unprecedented visibility into the economics of traffic delivery for service providers and digital enterprises alike. For the first time, companies can instantly see what their traffic is costing them across the network, and use that insight to drive smarter, faster decisions across the business.
“Kentik Traffic Costs is like putting our connectivity spend under an X-ray. We now have instant visibility into which portions of our traffic are driving costs – and exactly where to optimize for performance and savings.”
– Tomás Lynch, Senior Network ArchitectWhat was once buried in spreadsheets or limited to a handful of network engineers is now accessible to a broader set of stakeholders:
- For network and engineering teams, Traffic Costs replaces hours of spreadsheet wrangling and manual calculations with real-time, traffic-aware cost visibility. They can instantly identify high-cost routes, evaluate interconnect efficiency, and fine-tune traffic engineering to reduce spend, freeing them up to focus on strategic optimization.
- For sales and commercial teams, Traffic Costs provides clear visibility into customer-level economics. They can see exactly how much it costs to deliver traffic for any given customer, region, or application, and use that information to guide pricing, renewal negotiations, and profitability analysis – ensuring deals align with actual delivery costs.
- For finance teams, Traffic Costs enables better forecasting, budgeting, and spend accountability. Instead of relying on static reports or rough estimates, they gain a dynamic view of how connectivity costs are changing over time, and what’s driving those shifts – giving them the data they need to collaborate more effectively with engineering and procurement.
- For executives and leadership, Traffic Costs helps deliver high-level visibility into the financial health of the network. With clear, real-time metrics on where money is being spent and why, leaders can make informed investment decisions, improve margin discipline, and align infrastructure strategy with business goals.
Even more on the horizon
Traffic Costs is the latest step in breaking down silos between infrastructure and business teams – by merging network data with commercial data to unlock the insights needed for smarter, more strategic decisions.
And we’re just getting started.
We’re actively developing Traffic Costs to deliver even more precision, flexibility, and AI-driven insights. Here’s what’s on the horizon:
- Dynamic “what-if” pricing analysis. Model cost scenarios on the fly – like estimating the impact of a $0.05/Mbps price drop from a transit provider on total spend toward a specific network.
- Proactive budget tracking and forecasting. Stay ahead of spend with current-year budget monitoring, alerting, and predictive forecasting to keep you aligned with financial targets.
- AI-driven insights. Leverage Kentik AI to surface optimization opportunities, identify anomalies, and recommend smarter paths forward based on traffic and cost behavior.
Try Traffic Costs today
There are a few ways you can get started with Kentik Traffic Costs.
- Sign up for a Kentik trial.
- Request a demo, and someone on our team will reach out to confirm a time.
- Log in to your Kentik account (if you are a customer).
