Elephant Flows: The Hidden Heavyweights of AI Data Center Networks


Summary
Elephant flows are no longer rare. They’re foundational to AI workloads. In today’s GPU-heavy data centers, long-lived, high-volume flows can distort ECMP, overflow buffers, and rack up unexpected cloud bills. Kentik helps you see and tame these elephants with real-time flow analytics, automated alerting, and predictive capacity planning.
Suppose you’ve been designing or operating data-center fabrics for any length of time. In that case, you already know that most traffic in “traditional” data centers is made up of small, bursty flows that use up bandwidth for a short time and then disappear. However, every network engineer eventually encounters an elephant: a long-lived, high-volume flow that persists through the fabric, consuming bandwidth, pushing the limits of buffers, and distorting carefully calculated oversubscription ratios.
An elephant flow is a single session that transfers a massive number of bytes for an extended duration, taking up a disproportionate share of link capacity compared with the more typical short flows around it. Some network vendors claim that the default detection threshold is 1GB in 10 seconds; however, the size and duration are tunable, as each data center has its own definition of “huge.”
Why elephants matter in AI data centers
For web or microservice back-ends, an occasional elephant flow is usually just a nuisance. Flow hashing may pin a stream to a single link, ECMP imbalance can increase tail latency, and a few user requests may expire.
On the other hand, training or serving modern AI models is entirely different. In an AI cluster, GPUs exchange large amounts of data in tightly synchronized stages. Thousands of NICs fire at 200, 400, and even 800 Gbps in a synchronous fashion, and no device can proceed until all the data for the current step has arrived.
These transfers are made up of vast amounts of data between all or a subset of GPUs for extended periods, or in other words, they’re elephant flows by design. If just one of those flows collides with another, buffers fill, packet loss triggers retransmits, and job completion time (JCT) increases. At scale, that extra second or even microsecond results in idle GPUs, which translates to slower training runs and wasted money.

AI inference pipelines are only slightly less demanding. While an inference microservice per request may seem tiny compared to the elephant flows typically seen during training, batching processes frequently aggregate queries and push higher GPU utilization, creating fat, synchronized bursts of east-west traffic. Considering AI usage is still in its infancy, yet already highly pervasive, this isn’t a problem that we can just solve for later.
What do elephant flows do to a fabric?
The first symptom of an elephant flow is link congestion and head-of-line blocking. A single 400 Gbps RDMA flow hammers every hop in its path. If the fabric is oversubscribed, even a modest (and typical) 3:1 subscription at the spine can affect and even grind to a halt traffic for unrelated workloads.
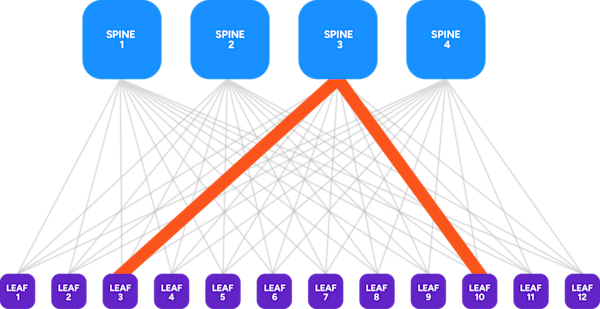
Next, elephant flows break ECMP hashing. With flow-based load balancing, the entire flow is salted onto one path. A luck-of-the-hash collision means some links go idle while others are overwhelmed with traffic. This is inefficient, can create unnecessary bottlenecks, and wastes hardware resources.
Another issue caused by elephant flows is microburst loss. AI workloads are bursty at step boundaries. When thousands of GPUs initiate the same flow simultaneously, shallow on-chip buffers overflow in microseconds, resulting in tail latency that negatively impacts performance and increases JCT.
And we can’t discuss idle links without discussing cost. Elephant flows can also lead to unexpected cloud bills. In hybrid AI architectures, elephant flows egress to GPUs in another region, which can detonate a month’s worth of budget in an afternoon. In fact, Kentik’s cloud customers see “high, unexplained egress traffic costs driven by elephant flows” as a top pain point.
Learn how AI-powered insights help you predict issues, optimize performance, reduce costs, and enhance security.

Finding the elephants
You can’t remediate what you can’t see, which makes pervasive, high-resolution telemetry table stakes.
Flow telemetry and streaming counters
NetFlow, sFlow, IPFIX, and gNMI provide byte counts, durations, and interface counters at millisecond granularity. While raw device metrics indicate that a link is hot, flow records reveal which application is responsible. Kentik’s Data Engine (KDE) ingests billions of these records per second, retaining them in a columnar datastore optimized for very fast ad-hoc querying.
Real-time analytics
Sampling alone can miss a short elephant flow. Kentik also utilizes SNMP, streaming data, and synthetic tests, allowing engineers to pivot a query from “top interfaces by utilization” to “top flows by byte-rate in the last 30 seconds” and immediately identify the traffic that is crowding out the rest of the cluster.
Intent-based thresholds
Because “elephant” is a contextual and somewhat subjective term, modern observability stacks enable dynamic alerting. You might tag any flow that exceeds 5 Gbps for 5 seconds inside your GPU VLAN as critical, while permitting 40 Gbps backup traffic on the out-of-band network after business hours.
Taming the herd
Mitigating elephant flows in AI fabrics requires a blend of architectural and operational controls.
First, we need to use lossless or near-lossless fabrics. RDMA over Converged Ethernet (RoCE) with Priority Flow Control (PFC) and Explicit Congestion Notification (ECN) prevents packet drops, but at the risk of congestion spreading. Although effective, engineers must still closely monitor queue buildup and adjust settings carefully.
Second, instead of pinning a flow, next-gen switches support per-packet load balancing or centrally scheduled fabrics that distribute elephant packets across multiple paths to avoid hash collisions. Usually called “packet spraying,” this is a foundational element of scheduled fabrics.
Next, we need sufficient telemetry from the fabric. For example, adaptive routing decisions rely on accurate, timely state information. Streaming congestion metrics into an analytics engine and feeding thresholds back to switches allows dynamic routing (or re-routing) before hotspots form.
And lastly, as many engineers know, sometimes the only solution is to increase bandwidth. Elephant flow analysis tells us where to upgrade from 400 to 800 Gbps, and where 100 Gbps SR optics are still enough.
Where Kentik fits in
The Kentik Network Intelligence Platform was designed specifically for this challenge. Kentik turns billions of flows into actionable insight in seconds. And especially in AI-centric data centers, Kentik helps engineers in a couple of ways:
The first is by automatically alerting elephant flow detection.
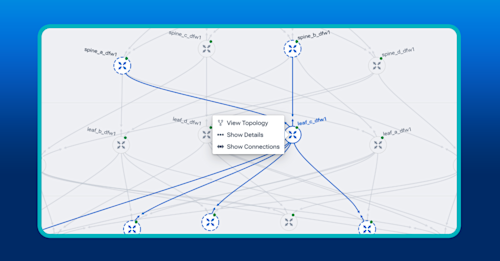
By using Data Explorer, engineers can instantly surface the heaviest flows, segmented by fabric tier, VRF, VXLAN VNI, or GPU pod. The results are automatically fed into an alerting policy and integrated with an external ticketing system. Engineers are then automatically alerted if a flow exceeds a threshold or if some other variable important to the organization is reached.
From that information, engineers can build dashboards that highlight any stream exceeding defined byte-rate or duration thresholds and trace the path the elephant flow took across leaf-spine links, revealing oversubscribed or asymmetrically hashed paths.
The second is by helping engineers plan capacity and understand operational costs.
Hybrid AI deployments often span training clusters across cloud Virtual Private Clouds (VPCs) and on-premises fabrics. Kentik unifies cloud flow logs, enabling network operators to trace elephant flow egress between tenants and enforce policy before it adversely affects costs.
Additionally, capacity planners can analyze weeks of telemetry to model how many additional GPU racks the fabric can accommodate before a data center upgrade is necessary, such as adding more links, increasing bandwidth, or installing new switches.
Elephant flows aren’t just anomalies in the network we can ignore – they’re the fundamental traffic unit of distributed AI. Left unchecked, they erode the very throughput and determinism that GPU clusters depend on. But with comprehensive flow analytics, proactive capacity analysis, automated alerting, and contextual observability, they become just another class of workload to engineer around.
The Kentik Network Intelligence Platform provides operators with deep and real-time visibility into hidden traffic heavyweights, offering the insight needed to reshape traffic or scale capacity.


