Summary
VXLAN overlays bring flexibility to modern data centers, but they also hide what operators most need to see: true host-to-host and service-to-service traffic. Kentik restores that visibility by decoding VXLAN from sFlow, exposing both overlay endpoints and underlay paths in a single view without the cost and complexity of pervasive packet capture — the result: faster troubleshooting, smarter capacity planning, and confident operations at scale.
Today’s modern data centers run high-bandwidth leaf–spine fabrics with VXLAN overlays often on proprietary hardware and software, but increasingly on whitebox switches running open software like SONiC. The need for VXLAN arose due to the limitations of VLANS, which generally can only handle 4096 virtual layer2 networks. This sounds like a lot, but is quickly exhausted in large data center environments.
In both cases, a VXLAN overlay brings flexibility, including multi-tenant segmentation, workload mobility, and simpler L2/L3 boundaries, but it also obfuscates what operations teams most need to see: who is talking to whom, over which paths, and through which devices. The reason for this is that VXLAN encapsulates traffic into new IP headers. These new headers are generally all that you will see with most flow tools.
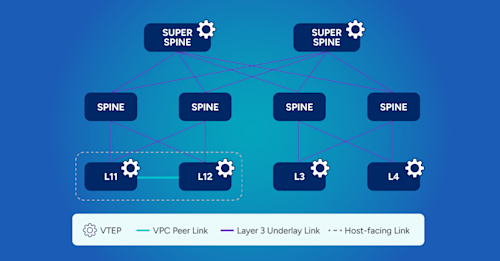
Notice in the image below that all the links display “underlay” links. This means all traffic is being “tunneled” by a VXLAN tunnel, and the central point in the network to observe flows only contains VXLAN IP headers.
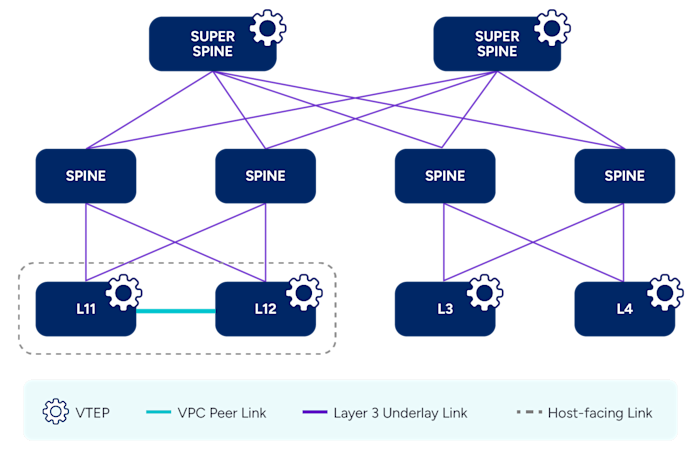
This obfuscation directly impacts operations and, therefore, the business. For example, when a trouble ticket hits, the engineer burns minutes translating VTEP-to-VTEP into business meaning. It’s challenging to determine which workloads were impacted and which devices carried them, and then to drill into counters, errors, or congestion on those specific elements.
However, with inner endpoints visible, we can right-size uplinks, rebalance tenants, validate load balancing is working as intended, and validate policy changes against observed overlay flows. That helps prevent overbuild, protects customer experience, and supports SLO reporting that aligns to applications, not tunnels.
By leveraging existing sFlow and avoiding pervasive packet capture, data center network operators can reduce complexity and cost while still obtaining the necessary overlay details. Overlay-aware analytics let app owners and network engineers look at the same graphs and talk about the same flows, reducing hand-offs and inefficient, error-prone back-and-forth.
In the following image, notice how we can extract both IP and VXLAN information.
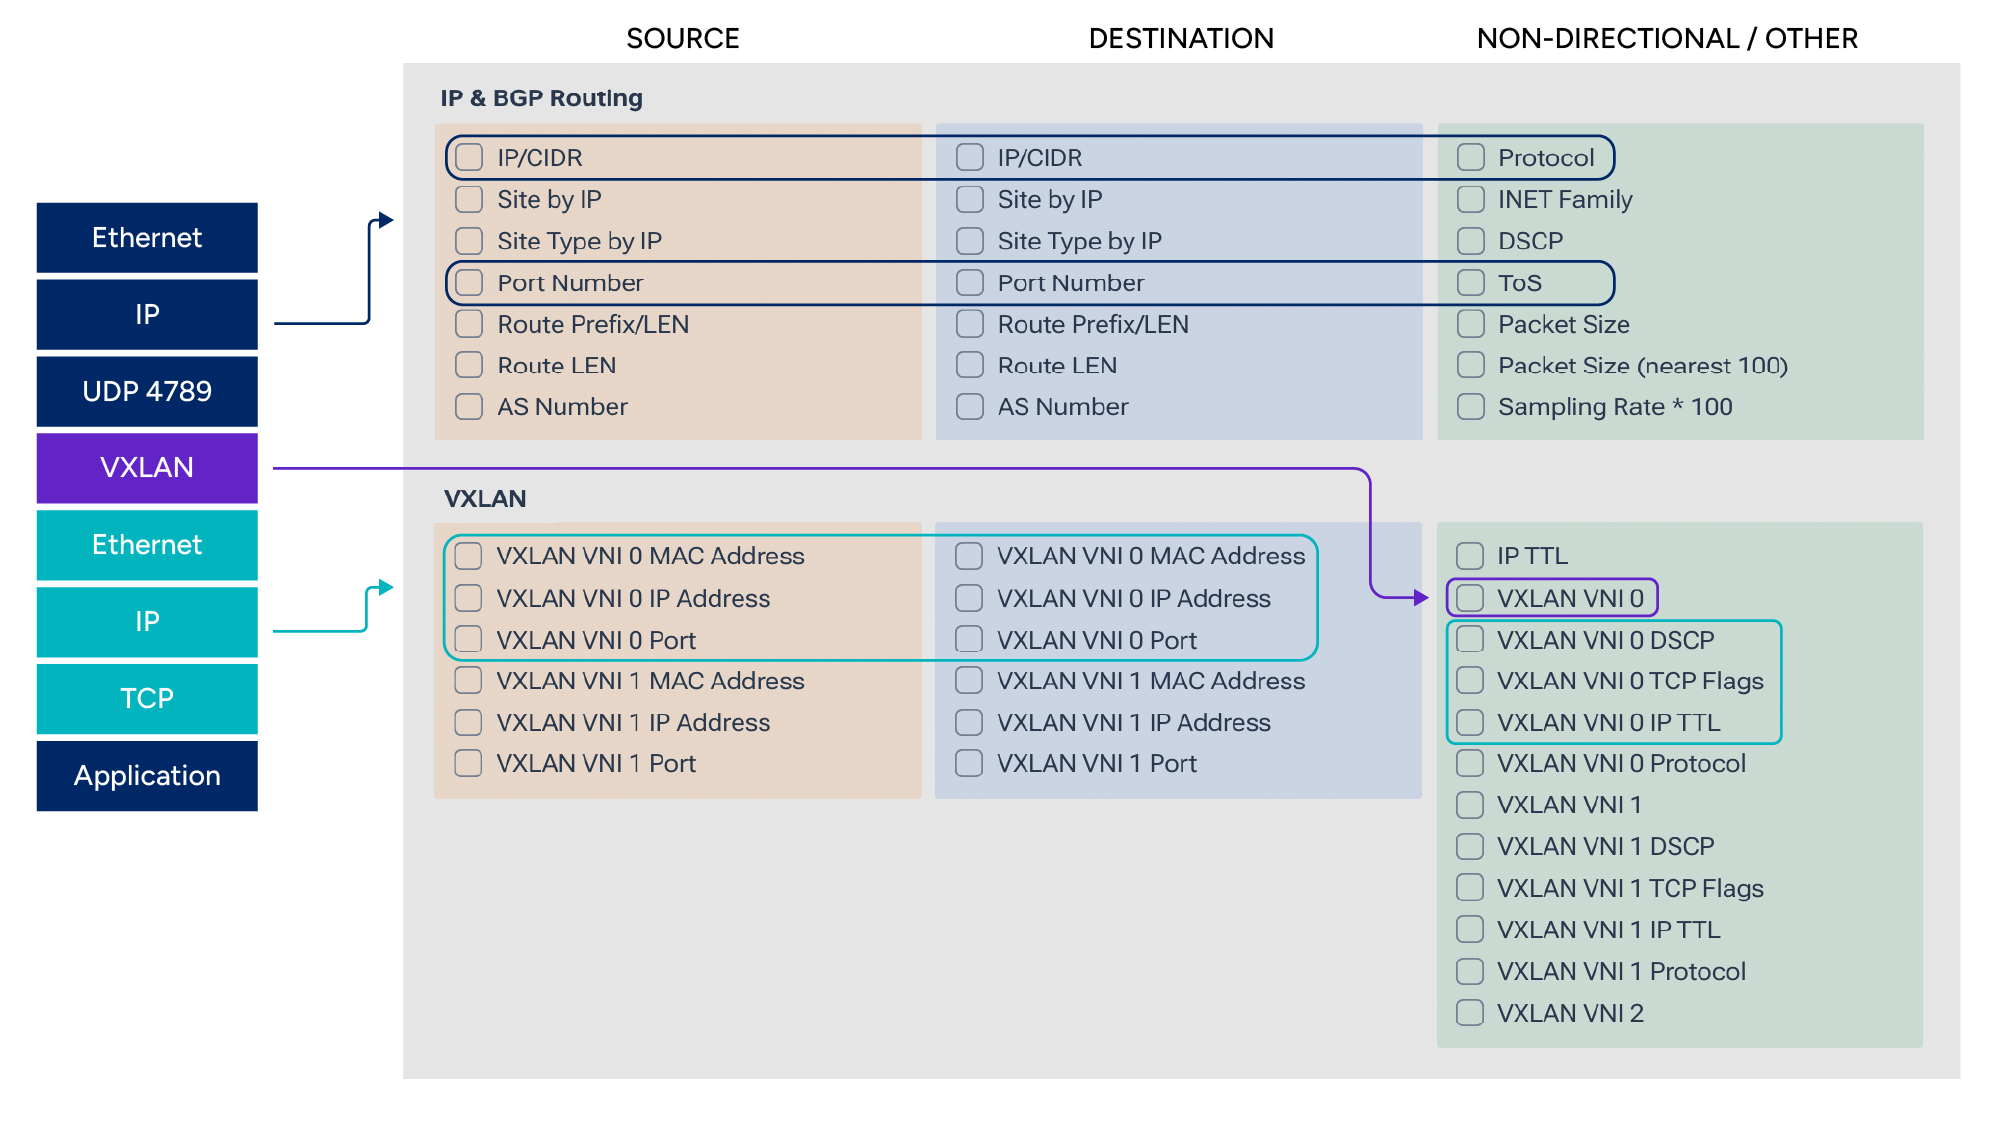
Getting end-to-end answers in a VXLAN world
When something is slow or broken, the question is rarely “which VTEP talked to which VTEP?” It’s “which services and hosts communicated on which leaf/spine path, and where did loss, latency, or queuing occur?” Data center network operators need to answer that in seconds, across a very large environment, and do it with tooling that scales operationally and economically.
VXLAN breaks traditional flow visibility
At central vantage points like superspine layers, standard flow exporters see only the underlay, such as outer IP/UDP and VXLAN headers. Therefore, flow records will show VTEP-to-VTEP conversations, not host-to-host or service-to-service in the overlay. That makes it hard to:
- Pinpoint the exact switches and interfaces impacting a workload.
- Tie traffic back to tenants, VRFs, and applications.
- Perform capacity planning or enforce SLOs using overlay context.
As enterprise organizations look to technologies like VXLAN for greater agility, scalability, and flexibility, they also need the proper tooling to make sure that added value isn’t also adding risk, ideally using telemetry already available in their switching platform, in many cases, sFlow.
But, it’s critical to first understand the difference between cache-based flow technology and packet sample-based technology like sFlow. With cache-based flow, commonly known as NetFlow or IPFIX, there is usually a flow cache built into the router’s memory. This cache is populated by analyzing packet headers crossing the device, keeping a count of bytes/packets for each flow, and periodically exporting these records to a flow collector.
With sFlow, there is no such caching. Packets are sampled along with information like interface ID and some other metadata, packaged up into an sFlow datagram, and shipped off to a collector for analysis. NetFlow and IPFIX also have this capability, but these methods are not as widely adopted as sFlow is.
Decode the overlay from sFlow and keep the underlay too
sFlow packet sampling exports a small slice of the packet (commonly the first 128 bytes), which includes both outer and inner headers of a VXLAN-encapsulated frame. Kentik ingests these samples and performs VXLAN-aware decapsulation, extracting the inner L2/L3 headers (true endpoints, tenant VNIs, etc.) while preserving the outer VTEP and interface metadata. Although the VXLAN frame is encapsulated, it is not encrypted. This allows Kentik to inspect the partial payload included with the sFlow in order to extract the layers of headers that may be available.
This change in perspective is crucial. Network operators can now filter and aggregate on overlay fields (tenant subnets, app tags, inner IP/ports) while still drilling down to underlay elements (which leaf/spine and which VTEPs actually carried the traffic). In other words, end-to-end traceability across the fabric.
Below, you can see how we get a decapsulated view of the IP traffic in Kentik. We also keep the original IPs so we can know what VTEPs and VNIs a flow is using.
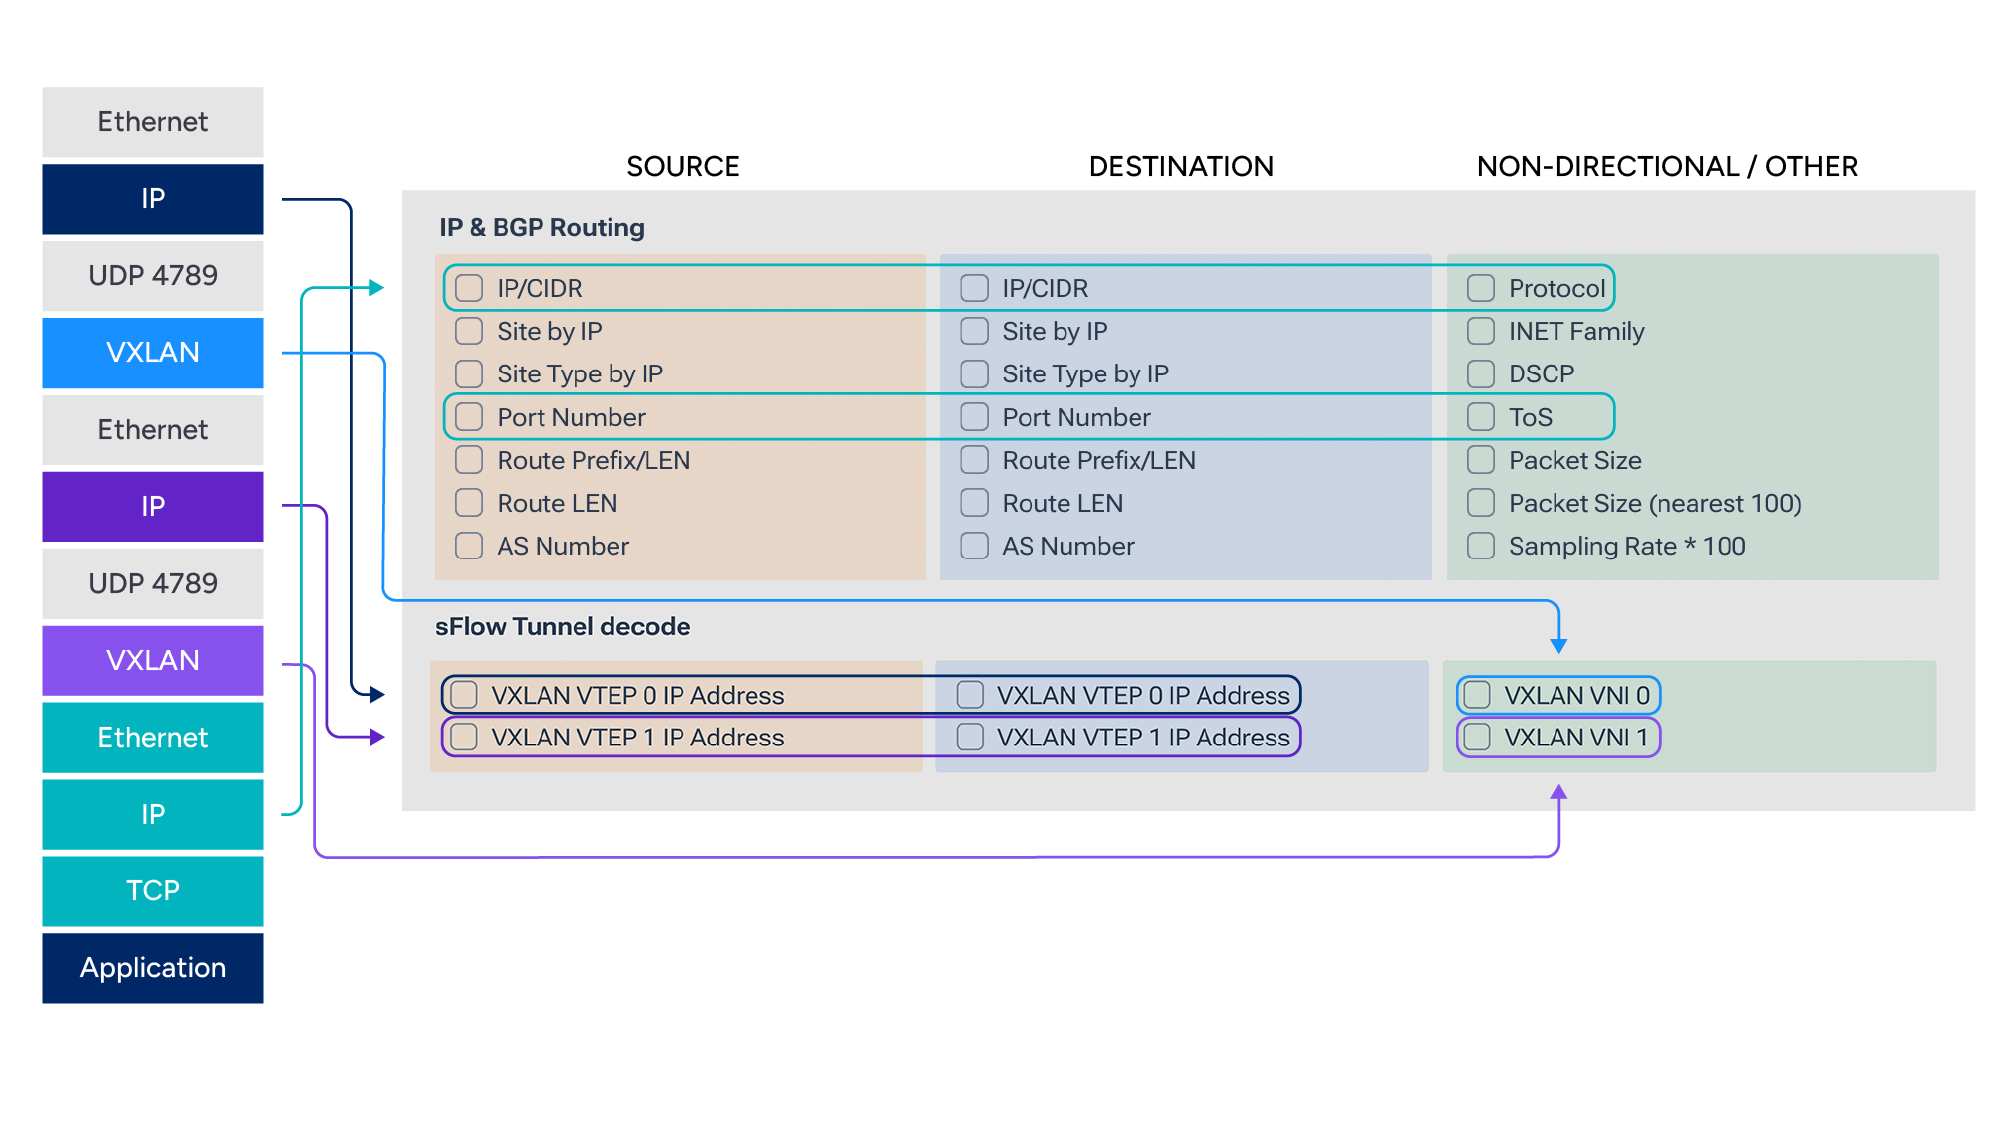
To make the experience practical, Kentik also adds custom dimensions to bind VTEP IPs to human-readable switch names. That turns questions like, “which box is hurting me?” into a single query, such as “show top overlay flows traversing leaf-101’s VTEP.”
Reconstructing VXLAN overlay traffic
Why raw flow falls short for VXLAN
Exporters at flow aggregation points see only the outer 5-tuple (source/destination underlay IPs, VTEPs, UDP/4789 for VXLAN). Most traditional flow analytics, therefore, treat every conversation as VTEP-to-VTEP, losing the inner conversation entirely. This works in traditional network environments, but leaves behind the most valuable information to a network operator when additional layers of encapsulation are present.
Digging deeper into sFlow can help solve this. Even at modest sampling rates, sFlow’s header samples contain enough bytes to parse the outer Ethernet/IP/UDP, recognize the VXLAN header, and then parse the inner Ethernet/IP/transport. That gives Kentik the raw material to reconstruct the true overlay endpoints.
Then, after decapsulation, Kentik analytics expose the real inner source and destination for troubleshooting and capacity views while retaining the outer VTEP, device, interface, and direction. Network operators can pivot bi-directionally, for example, tying a tenant flow to the underlay hops, or from a specific leaf/spine to the overlay flows that traverse it.
Network operator usability
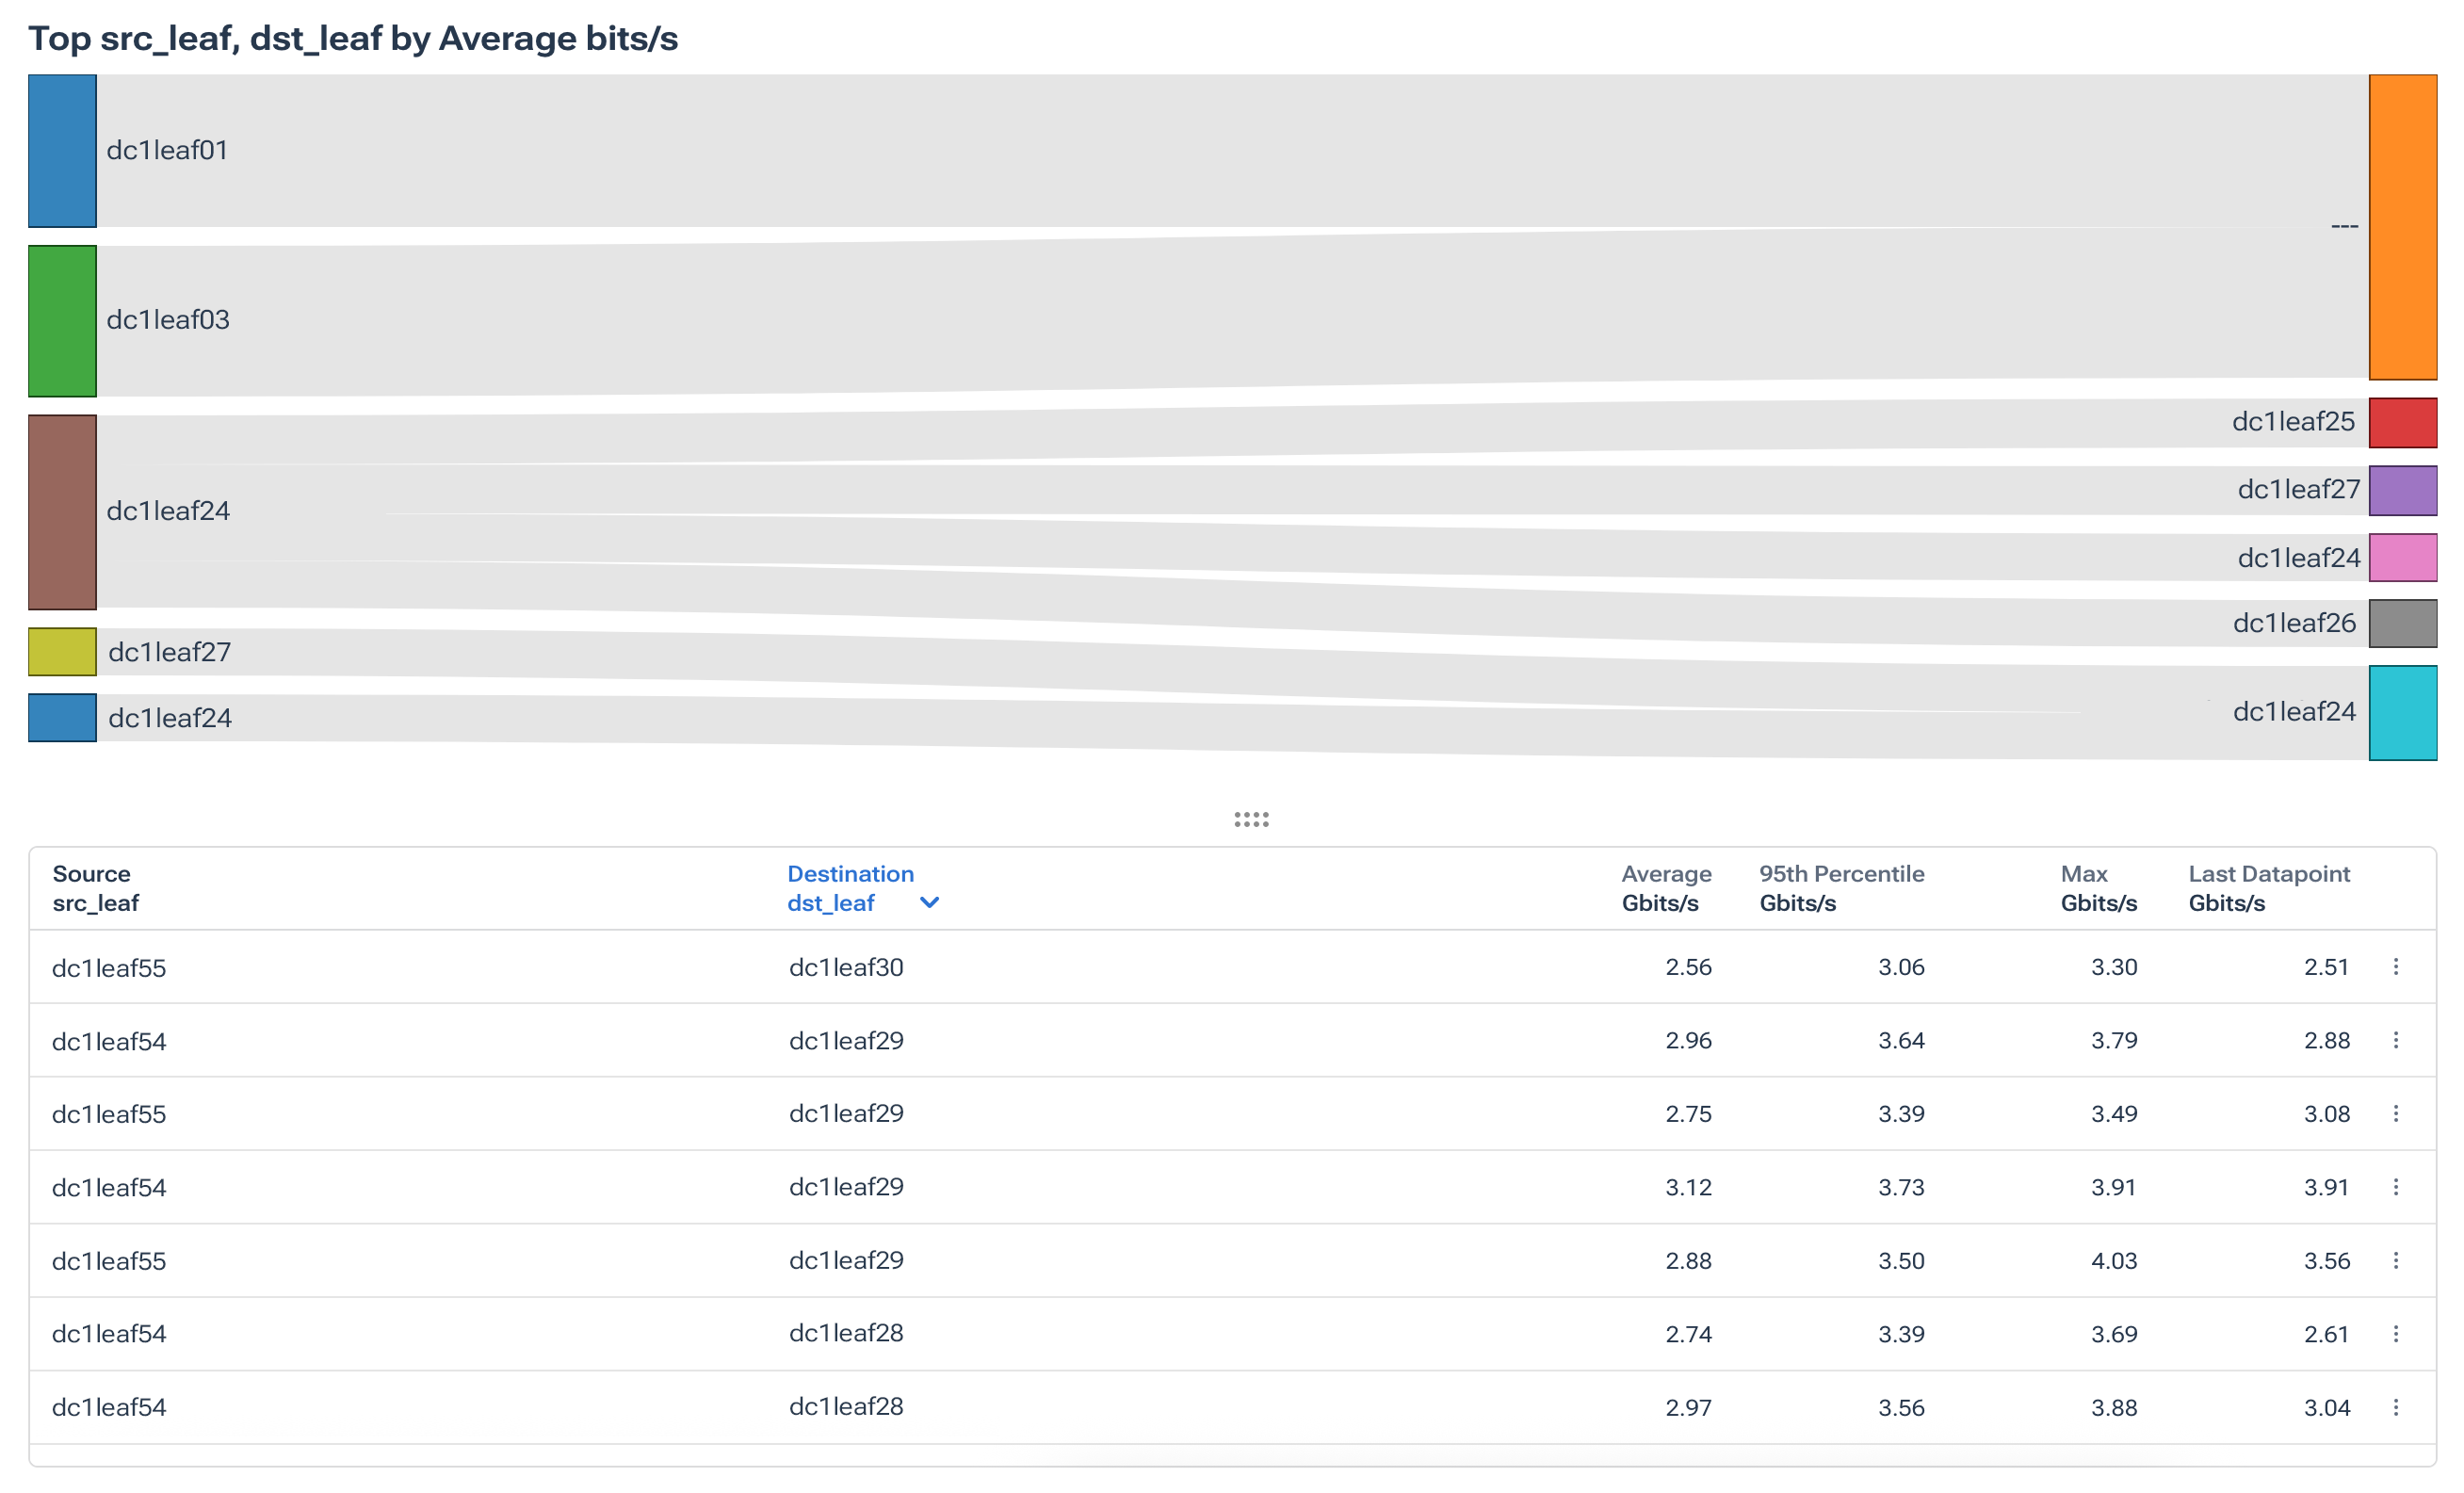
Custom dimensions map VTEP IP to switch names, enabling dashboards and alerts to read like the network, such as leaf-101, spine-04, az-west-vtep-12. That makes triage faster and makes post-mortems clearer.
Scale vs. PCAP
Packet-capture-centric approaches can be cost-prohibitive and operationally heavy at data-center scale. Kentik achieves overlay path insight from sFlow alone, preserving ingress switch and interface context. Even when monitoring at the spine, we can still gain overlay visibility that terminates at the leaves, striking a practical balance between depth and scale.
Path visualizations
With overlay fields decoded, Kentik can then render path and fabric maps filtered by overlay attributes (VNI, tenant CIDR, app tag, etc). Network operators see the actual VXLAN traffic path rather than just the tunnel endpoints.
Less flow collection
Depending on your implementation, you may perform encapsulation on the virtualization host as is done with VMWare Virtual Distributed Switch(VDS), or at the leaf switch level, as is common in many modern fabrics being deployed today. In these cases, you could collect flow from leaf switches or IPFIX generated by VMware VDS. This often means collecting flow from hundreds or thousands of exporters per fabric to achieve overlay visibility. By using Kentik’s capabilities, you can obtain comprehensive flow information, including overlay details, by monitoring the spine layer of a fabric. This can result in large cost savings for organizations needing this overlay information.
Enriching with DNS information
By enabling DNS hostname enrichment, users can report on and filter traffic based on the reverse lookup of the overlay IP addresses. Most organizations follow DNS naming conventions that help identify applications, locations and more. This allows users to not only understand what IP communications are occurring in the overlay, but also track patterns based on hostname information.
In the last image from the Kentik Portal, notice how we can use custom dimensions to add the switch names to identify the VTEP.
Takeaways
VXLAN simplifies data center design, but it complicates visibility. Data center network operators are faced with a classic challenge: flow tools see tunnels, not tenants. Kentik brings that visibility back, without pricey and invasive packet brokers and packet capture appliances, by decoding VXLAN from sampled sFlow and stitching underlay and overlay context into a single, queryable view in operator-friendly terms (switch names, paths, interfaces). The result is a fabric that can both be operated confidently and planned intelligently with lower MTTR, better capacity decisions, and tooling that scales with the business.

