A Network Crumb Back Story: A Baker’s Dozen Retrospective

Summary
Loaf and behold, this retrospective covers nearly 20 years of the Baker’s Dozen style annual ranking of the biggest ASes of the internet. In it we discuss the DFZ, de-peerings, and partitions. It was the yeast we could do.
For many years, my former colleagues at Renesys (and later Dyn, after we were acquired) would publish an annual ranking of the internet’s top ASes called the “Baker’s Dozen.” This ranking was based on estimated customer cone size as modeled in our products. As with any ranking, this list was often the subject of controversy and debate — everybody wants to be #1. 🙂
Ever since I joined Kentik back in 2020, I have fielded requests to bring back this annual AS rankings post. Now, I’m not ready to commit to that but I thought it might be interesting now to go back to the beginning of this ritual and see how things have evolved over nearly twenty years of ranking the internet’s top ASNs.
A lot has changed in the transit market since the first Baker’s Dozen was published in 2008. Over the past two decades, content delivery services have fundamentally changed the way in which internet traffic is delivered to the end-user — reducing reliance on transit. This change, combined with advancements in networking technology, helped to drive wholesale transit prices down, forcing some major networks to cut costs to stay competitive, while others turned their focus to more lucrative ventures.
For this post, I compiled 20 years of AS rankings to see what stories they reveal about the transit industry. We even built a nifty interactive visualization that allows a user to track the rankings of individual ASes over this time period.
As much of this information has been lost to the passage of time, I had to dig deep into the archives to piece together the snapshots from old Baker’s Dozen posts over the years (2008, 2009, 2010, 2011, 2012, 2013, 2014, 2015, 2016) — thank you, archive.org!
For the years 2021 and on, I used Kentik Market Intelligence, which borrows a similar approach to AS ranking. And, finally, for those missing years, I did my best to recompute the AS rankings from scratch using Routeviews data and my understanding of the techniques involved.
What are these rankings, and what do they indicate?
At Renesys, we used our own BGP route collection infrastructure to model the transit markets of the world. We would identify adjacent ASes from AS Paths in BGP routes and classify their relationships, with few exceptions, as either transit (selling/buying bandwidth) or peering (exchanging traffic for free).
Take the example route below. Reading the AS Path from right to left, we can see this IPv6 prefix is originated by Kentik (AS6169), sent to its transit provider Server Central (AS23352), on to their transit provider GTT (AS3257), over to peer Cogent (AS174), and down to Cogent’s customer GEANT (AS21320).
21320 174 3257 23352 6169 2620:129::/44In this example, AS3257 and AS23352 would get credit for transiting this prefix. The amount of credit would depend on the size of the prefix. A core assumption was that more transited IP space correlated with more traffic, an assumption that, admittedly, doesn’t always hold true.
The more credit a transit provider earned, the higher in the rankings they would go. This approach stands in contrast to CAIDA’s AS Rank, which counts the number of unique ASes in the customer cone as its metric for ranking the top ASes.
Regardless, for many years, many major service providers have found these rankings useful and informative. In the Baker’s Dozen posts, often the most interesting observations were not the exact rankings, which were heavily dependent on methodology, but what changes we were observing over time.
With all of that explanation out of the way, let’s begin our archeological dig through internet transit history.
Going back in time
The earliest Renesys ranking I could find was from a MENOG talk back in 2007. We hadn’t yet published our first Baker’s Dozen of the top 13 ASes, but it is fascinating to see what companies ranked in the top ten at the time and how they compare to where things stand today.
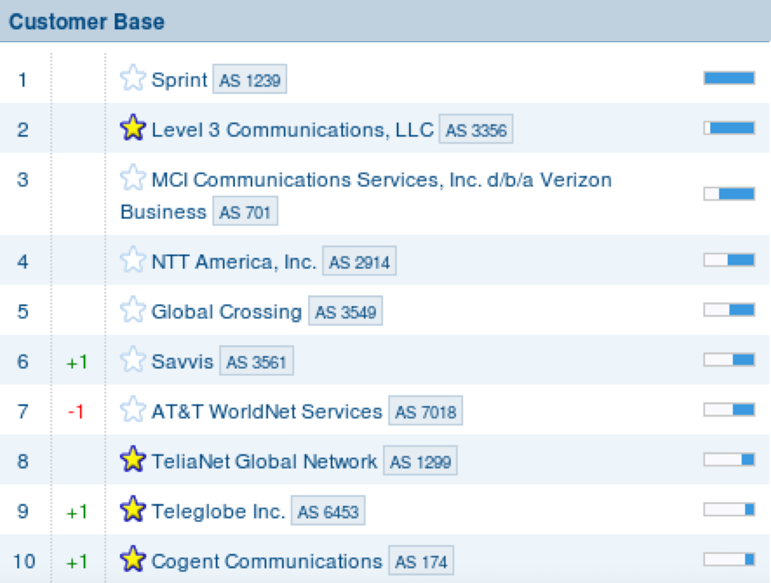
The most notable difference from recent top ten lists is who sits in the #1 spot in 2007: Sprint (AS1239). These days, not only is AS1239 not the number #1 transit provider globally, but this network has been retired, having been sold to Cogent (AS174) back in 2023. That AS1239 would be sold off to Cogent is some rich irony after the major peering dispute between the companies back in 2008, but more on that later.
Also, did you know the name Sprint originated as an acronym for Southern Pacific Railroad Internal Networking Telecommunications?
Two decades later…
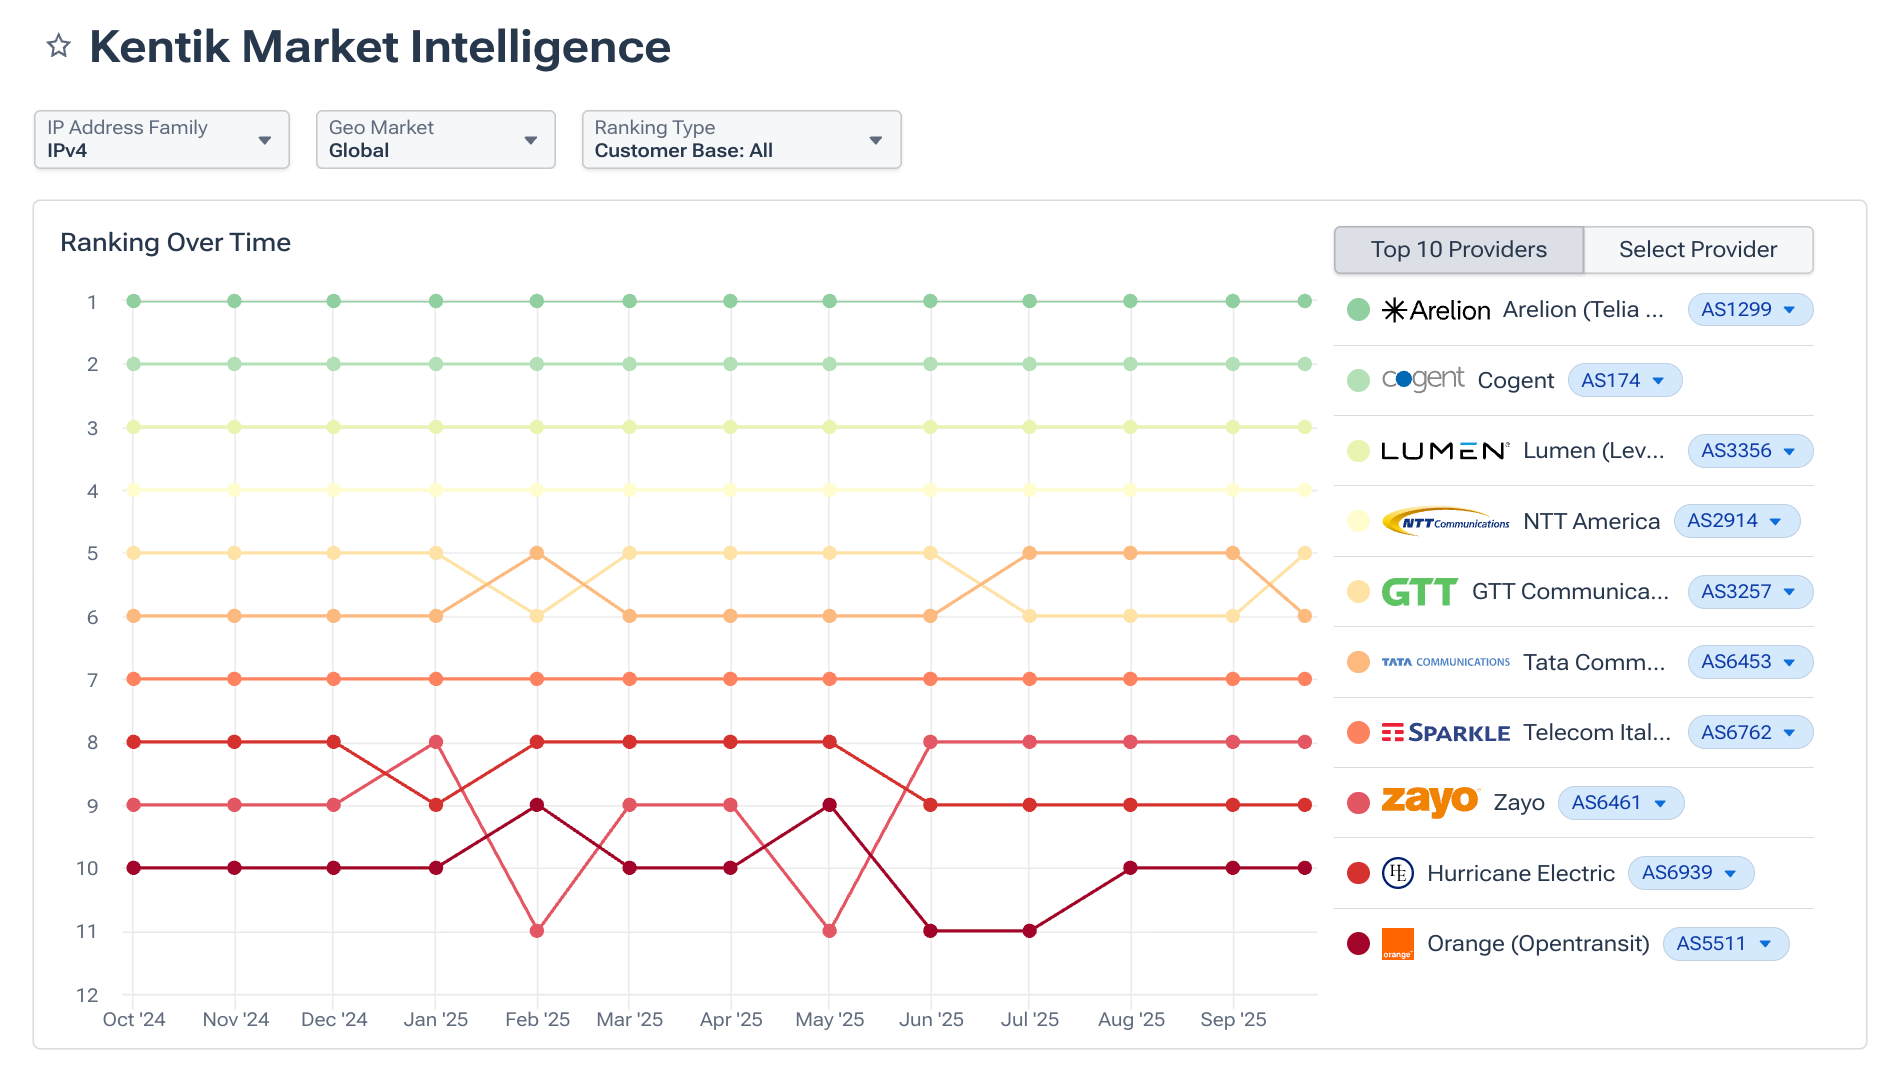
At the end of this section is an interactive visualization that can be used to explore the changes in AS rankings using 20 years of ASN rankings. The following storylines are well illustrated in the graphic:
Shift to mobile
Major US providers with mobile service offerings deprioritized international transit to focus on their mobile businesses. This shift in commercial focus caused them to drop or completely fall out of the rankings. The most dramatic example of this is Sprint going from #1 in 2007 to nonexistent last year.
AT&T (AS7018), the iconic American incumbent, ranked #7 in 2007, continued to decline until dropping out of the top 13 in 2013. Sprint lasted until 2024; now only Verizon (AS701) is in the top ten today.
Market consolidation
Some previously highly-ranked networks disappeared as a result of acquisitions. Perhaps, the most notable of these would be Level 3’s (AS3356) acquisition of Global Crossing (AS3549) in 2011, ranked #1 and #2 at the time.
CenturyLink would later acquire Savvis (AS3561) in 2011 and Level 3 in 2017, renaming itself Lumen, and putting the entire network under AS3356. Verizon acquired XO (AS2828) in 2017.
A new guard
By the time Renesys published its first Baker’s Dozen blog post in 2008, Level 3 (AS3356) had taken over the top spot, which it would hold for the next decade. But Cogent and TeliaSonera (AS1299, now called Arelion) were on the move. They had both achieved transit-free status in 2008, according to our analysis at the time, following one of many peering disputes which partitioned the internet in the early 2000s.
The visualization below illustrates the multi-year rise of Cogent and Arelion to dominate the international transit business—a rise capped off by Cogent’s acquisition of Sprint’s wireline business (AS1239).
Rise of the rest
The ascent of others (AS6453, AS3257, AS6762, AS3491, AS6939, AS6461, AS5511) due, in part, to the first two developments, but also the growth of internet service outside of North America and Western Europe, which had far more room to grow.
Keep on keeping on
And finally, NTT (AS2914, formerly Verio) began and ended this period of analysis in fourth place,* like nothing ever happened.*
(Live version here: Open ASN Rankings Through The Years in a new window.)
Partitions and the DFZ
The story of the top ASes wouldn’t be complete without discussing the phenomenon of the default-free zone (DFZ) and internet partitions.
One of the core properties of the internet — often taken for granted — is that any connected device can reach any other connected device. However, this property is not guaranteed. When two ASes in the DFZ de-peer — unless there is an intermediate transit network — a partition forms, and parts of the internet have no way to reach certain others. Let’s explain how that works.
The canonical model of the internet is this: smaller retail service providers, universities, and businesses buy transit (internet bandwidth) from larger service providers, who, in turn, buy transit from even larger service providers. Eventually, you arrive at the top of the food chain: the default-free zone (DFZ), i.e., companies that don’t have a default route to a larger service provider — sometimes known as the transit-free zone (TFZ), companies that don’t buy transit from a larger provider.
Some service providers in the DFZ have the largest customer cones (customers, and customers of transit customers, etc.), and they don’t buy transit from anyone (transit-free) because they are the biggest fish in the internet pond.
These ASes exchange traffic with each other over “settlement-free” peering, exchanging traffic for free — a mutually beneficial arrangement for both businesses. Membership in this elite group is not easily attained.
An AS must grow its customer base large enough that it can make the case that other large networks should establish a peering relationship with them to reduce costs or reach another part of the internet more directly.
How de-peering Leads to partitions
If one of the two networks in a peering relationship feel that the arrangement is no longer beneficial, the ultimate option is to de-peer, i.e., disconnect. When this happens outside of the DFZ, service providers use alternative sources of transit to regain global reachability.
For example, in 2013, Level 3 and Comcast resolved a years-long peering dispute over the handling of Netflix traffic. Level 3 was sending so much Netflix traffic to Comcast that Comcast wanted to get paid for it. When Level 3 refused, Comcast de-peered them. The details of the resolution were not made public, but the launch of Netflix’s Open Connect caching servers the previous year may have helped alleviate the underlying traffic imbalance.
If two DFZ ASes de-peer, it can create a partition because to route around the disconnection would require traversing two peering relationships. Imagine the DFZ as a full-mesh network of peering relationships.
Two consecutive peering relationships are avoided because the AS in the middle would be carrying traffic for the other networks’ customers for free. There is no incentive for the “AS in the middle,” and at the wholesale level, no one does anything for free.
A partition means that customers who rely on one of the two ASes in the dispute will have no way to reach the customers of the other AS. We presently have a long-running partition in the IPv6 internet between Cogent and Hurricane Electric: customers exclusively using one provider cannot reach the other.
In 2008, Cogent was a rapidly growing service provider that was unafraid of employing hard-nosed tactics to break into the exclusive transit-free club, even if that meant disconnecting with Sprint and creating a partition in the internet. Ultimately, the US government got involved and Sprint relented, offering peering to Cogent.
The incident led to a talk from Renesys at NANOG 45 that drilled into the implications of the break-up:

Now Cogent bought its former de-peering adversary and AS1239 has been placed on the discard pile along with AS16631, Cogent’s original ASN prior to purchasing assets (and the ASN) of bankrupt PSINet in 2002 for a cool $10 million.
Conclusion
As mentioned above, the role of transit in operation of the internet has evolved in the past two decades — see APNIC Chief Scientist Geoff Huston’s ubiquitous Death of Transit talk from a couple of years back. Of course, transit didn’t die, but it is responsible for delivering a smaller share of the traffic that internet users consume.
In a conversation during last year’s APRICOT in Thailand, Geoff and I mused about the BGP hijack of YouTube by Pakistan’s PTCL back in 2008. If the exact same thing were to happen again today, RPKI ROV and other route filtering mechanisms would block the problematic announcements. But that’s almost beside the point!
YouTube wouldn’t suffer a global outage like it did back then because it is no longer delivered over transit — nearly all of YouTube traffic is delivered through their embedded cache nodes (GGC) omnipresent in nearly all of the world’s service providers, including PTCL of Pakistan.
At Kentik we have the luxury of being able to measure the proportion of traffic delivered via transit. Below we see the breakdown of traffic handled by a mid-sized US service provider by ‘Connectivity Type.’
Over half of the traffic (measured in bits/sec) is delivered via Embedded Cache, things like Google’s GGC or Netflix’s OpenConnect. After that, comes PNI (Private Networking Interconnect, aka Peering) at 40.8%. Transit only represents 4.6% of the traffic in this representative example.
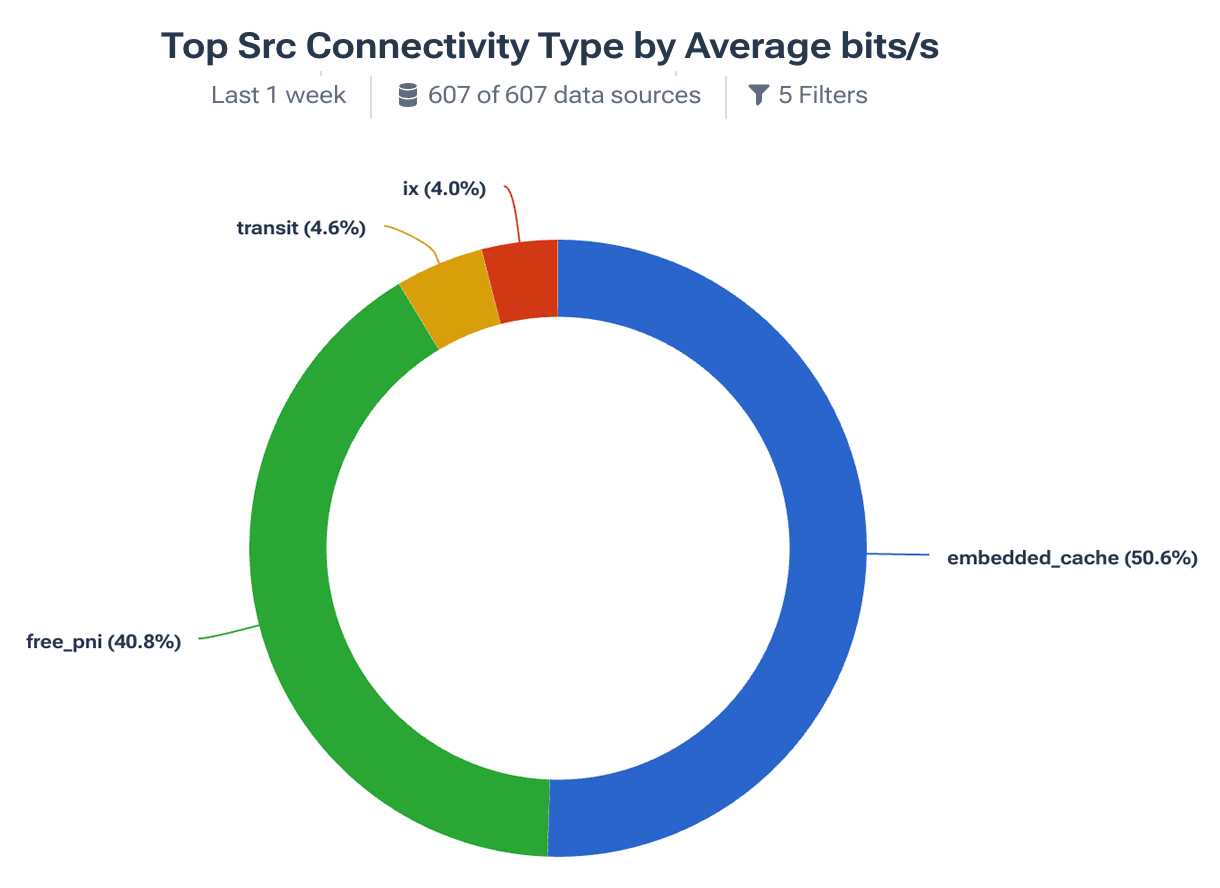
Of course, those embedded caches operate in the service of content providers like Netflix and Google, but the peering traffic is also nearly entirely just to a handful of content providers, including Akamai, AWS, Cloudflare, Fastly, Facebook, and Apple. The IXP traffic doesn’t look that much different.
So what’s carried over transit’s meager slice of the pie? In this particular case, 65% of the original 4.6% is more traffic to the same handful of content providers mentioned above — presumably cache misses or refills that weren’t served by the existing peering connections.
And this is how the internet is delivered to users around the world these days — far more efficiently than pulling YouTube videos over transit from some datacenter far away. It is all part of an internet service delivery system that is vastly more efficient for both providers and consumers than it was only a decade ago.
Transit isn’t dead, but its role has been more narrowly defined to what it can do that no other “Connectivity Type” can: carry traffic across the internet from one side of the world to the other. It may not represent a large portion of the internet’s traffic, but without it, we wouldn’t have an internet. The Baker’s Dozen and similar rankings tell the evolving story of that key piece of internet infrastructure.
