Summary
CloudWatch can be a great start for monitoring your AWS environments, but it has some limitations in terms of granularity, customization, alerting, and integration with third-party tools. In this article, learn all the ways that Kentik can supercharge your AWS performance monitoring and improve visibility.
Nowadays, you’d be hard-pressed to find a digital business that doesn’t rely on cloud infrastructure. Within these cloud environments, it’s paramount for businesses to ensure optimal performance and efficiency to deliver a smooth customer experience.
As one of the leading cloud service providers, Amazon Web Services (AWS) provides built-in solutions like CloudWatch to help users monitor the performance of their applications. However, as you’ll soon see, these built-in tools may not be sufficient for more advanced use cases.
In this article, we’ll explore AWS performance monitoring with Kentik Cloud, a solution designed to empower businesses with greater insights and control over their AWS deployments. We’ll learn about some of the key challenges associated with AWS performance monitoring to see why built-in tools like CloudWatch might fall short. Conversely, we’ll also explore some of the unique and practical capabilities of Kentik Cloud that you can use to gain valuable insights into your AWS environments.
What is AWS performance monitoring?
AWS performance monitoring refers to the practice of tracking, analyzing, and optimizing the performance of your AWS resources and services. Here, performance is typically attributed to metrics such as compute resource utilization, network traffic, and application latency. Confirming that your AWS application properly emits these metrics and then diligently tracking them is critical to guarantee the efficient operation of your resources.
Why is AWS performance monitoring important?
Let’s highlight some of the reasons why AWS performance monitoring is important:
- Improved user experience: Users are much more likely to have a positive experience using your service or application if latency and response times are low. Using performance monitoring to identify and address performance bottlenecks can ultimately lead to higher customer satisfaction and retention.
- Enhanced availability: These days, the best applications demand a 99.999 percent availability (also known as “five nines”). Monitoring can help you detect resource constraints and other anomalies before they happen. This can help you mitigate or avoid downtime altogether, ensuring high availability and minimizing business disruptions.
- Reduced costs: Effective monitoring can help organizations identify underutilized and overprovisioned AWS resources. By rightsizing essential resources, such as Amazon Elastic Compute Cloud (Amazon EC2) instances, businesses can reduce costs and put their money toward other resources that require scaling.
- Better security and compliance: Proper monitoring also includes visibility into security and compliance metrics. Tracking them can help organizations rapidly detect and respond to security threats and vulnerabilities.
- Reduced network connectivity issues: Keeping an eye on network traffic and connectivity metrics helps identify issues such as package loss and high latency. Addressing these issues ensures smooth communication between services and contributes to better availability.
- Enables data-driven decision-making: Overall, the trend with all these points is that AWS performance monitoring enables informed, data-driven decision-making. Any choice that you make regarding your application’s infrastructure scaling, workload optimization, or resource allocation needs to be backed up with sufficient data.
Built-in AWS monitoring solutions
One of the most popular services in AWS’s 200+ service catalog is Amazon CloudWatch. CloudWatch is the built-in AWS monitoring solution designed to help users track various metrics, collect and view log files, and set alarms. With this data, users can create custom dashboards to view different alarms and metrics in one place. For instance, here’s a custom CloudWatch dashboard titled “cloudwatch-networking-dashboard”:
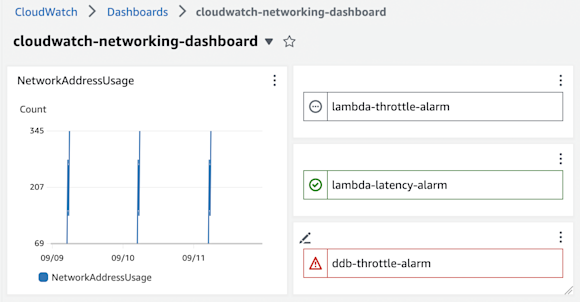
With this dashboard, users can immediately visualize a key Amazon VPC metric: Network Address Usage (NAU). Next to this line graph widget, you can also quickly obtain the status of three CloudWatch alarms (whoops, one is currently in alarm!).
Overall, CloudWatch is a great tool for monitoring your AWS environments, but it can fall short in a few key areas:
- Limited granularity: CloudWatch provides metrics at predefined granularities. For example, the “NetworkAddressUsage” metric can be viewed at one-second, five-second, ten-second, thirty-second, one-minute, and all the way up to thirty-day intervals (the previous example used fifteen-minute intervals). However, users with requirements for custom intervals may find these limiting.
- No predictive analysis: CloudWatch primarily acts as a central location for historical and current metrics for your AWS resources. However, it lacks built-in predictive analysis capabilities to forecast future trends or performance issues.
- Lack of customization: CloudWatch does support creating custom metrics and dashboards. However, its customization options are somewhat limited compared to other specialized third-party monitoring tools, and learning how to publish custom metrics can take additional time.
- Limited alerting options: While CloudWatch alarms are excellent for basic alerting, they may not be as sophisticated as some third-party alerting and incident management tools. For instance, one CloudWatch alarm primarily tracks a single metric and goes into alarm when its threshold is breached. This might not work for use cases that demand more advanced alerting logic, such as time-based alerting, anomaly detection, or alerting based on dynamic usage patterns.
- Limited integration with third-party tools: CloudWatch is primarily designed to monitor AWS resources and services, and its integration capabilities with third-party tools and services are limited. This can be a significant drawback for organizations that use a mix of cloud providers or on-premise infrastructure.
In light of these limitations, it’s advantageous to consider Kentik Cloud, a performance monitoring tool that’s geared toward providing insights into networks.
Kentik Cloud: The better AWS performance monitoring tool
Because Kentik Cloud is a dedicated network observability tool, it offers a very extensive set of features and capabilities, making it a superior choice for organizations with more complex AWS environments or more advanced monitoring needs. As you’ll see in the following points, Kentik Cloud has the potential to offer deeper insights compared to built-in AWS performance monitoring tools like CloudWatch.
Powerful visualizations
Kentik Cloud can collect network data from a variety of cloud providers. For your AWS VPCs, you can set up Kentik to observe your VPC metrics by doing a cloud export. This allows Kentik to ingest your VPC’s flow logs and metadata.
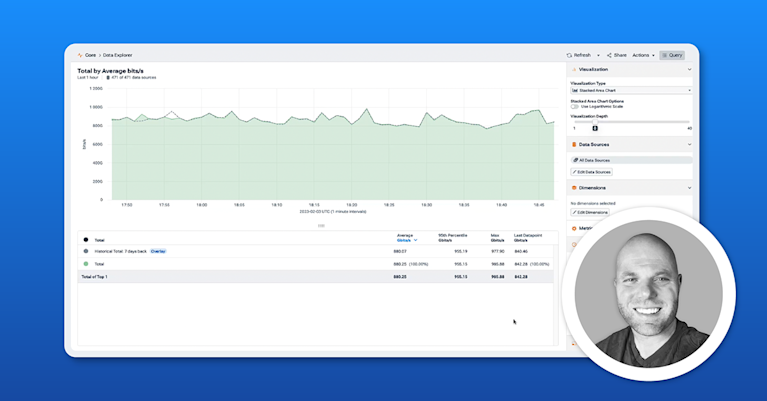
Once you’re set up, Kentik can process this network data and produce powerful visualizations. In the Data Explorer, you can graph select metrics to comprehensively view your network traffic and performance. See the example below:

Kentik Cloud provides a variety of different filters that you can use on your data to produce the right visualization for your needs at whatever granularity you like. Notice that there are two main components in each visualization, a graph and a table:
- For the graph, you can select from one of many chart view types. In this example, the individual data points use a stacked area chart, which is often useful for comparing traffic amounts between two different networks. The aggregated total uses a line chart.
- The table lists the query results in tabular form. Whereas the graph is useful for visualizations, the table can help you extract the exact value of key metrics. This is lacking in CloudWatch, which doesn’t currently provide a tabular form of queried metric data.
Real-time metrics
Data visualizations in Kentik Cloud are provided in real time to help you understand the current state of your network. When Auto Update mode is on, metrics and visualizations are continuously updated as new data flows in.
One metric that can be particularly useful to track in real time is traffic percentage. For example, if you’re slowly migrating traffic off one network and onto another, being able to monitor this transition in real time can help you detect if and when something goes wrong. The 100 percent stacked area chart is particularly useful in this case:
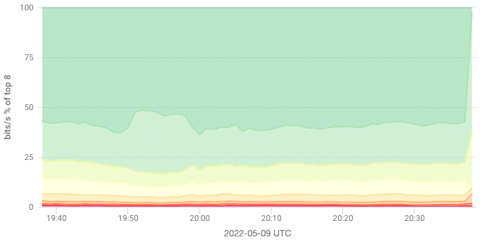
In this chart, the relative loads of different networks can be visualized in a single, real-time graph. It can help you see changes in one network’s traffic relative to all other networks, as well as the total combined usage. CloudWatch doesn’t natively support the ability to graph relative values like this (though you can manually implement a similar idea using metric math).
Synthetic testing of your cloud services
Synthetic testing is a technique that can help you proactively discover networking issues before your users do. In synthetic testing, you simulate different types of traffic through specific routing paths. For example, you might use synthetic testing to observe communications between your VPCs.
A good synthetic monitoring platform offers insights into a test’s high-level metrics and low-level details. You’ll want to know about issues like unavailability, high latency, and packet loss. At the same time, you also want to be able to trace issues down to a specific area of the network, such as a host infrastructure issue in a third-party service.
Synthetic testing is not available in a service like CloudWatch, which isn’t really intended for such use cases. However, Kentik has a synthetic testing and monitoring solution built into its platform. This allows you to plan and execute routine synthetic testing and immediately visualize the results:

Below the visualization, you’ll also get a log of the exact tests and their respective statuses. You can also combine many other features with synthetic testing to customize your network monitoring experience, such as setting up alerts when synthetic tests detect performance issues or unusual behavior. Alerts that are based on the direct results of synthetic testing can often be more telling of underlying issues than simply alerting based on metric thresholds, which is typically what you’re limited to in CloudWatch.
Perhaps the most useful feature is that network operators can use Kentik to set up automatic synthetic testing. In a single click, Kentik can predict the key routes through your network and create custom testing plans. Few other monitoring solutions double as a network testing platform, let alone one that can automatically detect key paths through your network and generate entire synthetic testing plans. As you develop and change your network infrastructure, Kentik can also automatically update test configurations in real time.
Monitoring across multiple cloud providers
As previously stated, the main limitation of CloudWatch is that it really only shines in monitoring AWS environments. However, many organizations these days employ a mix of different cloud providers, and any in-house monitoring tool within these providers is likely not going to integrate well with others. In contrast, Kentik allows you to see and monitor all your networks in one place, with native integrations built for AWS, Google Cloud Platform (GCP), Azure, and IBM Cloud. This offers a few immediate benefits for organizations that use a multicloud strategy:
- Data aggregation: Kentik can aggregate network traffic and performance data from all your cloud providers into a single interface. This means you can analyze data from multiple clouds without having to switch between different monitoring tools.
- Single unified dashboard: Kentik can provide a dashboard that displays data from your cloud providers side by side. This can be useful if you need to compare performance or traffic patterns across different clouds.
- Single alerting system: Instead of manually setting up custom alerting rules in each cloud provider, you can now do this all in Kentik.
Overall, using a platform like Kentik can help you gain a holistic view of all your networks, even if they’re distributed across many different cloud providers. (And you can learn more about Kentik and other alternatives in our article, “CloudWatch Alternatives: Enhancing Multicloud Network Observability.”
How to improve AWS performance monitoring with Kentik
AWS performance monitoring is essential for ensuring the efficiency, availability, and security of cloud-based applications. Though CloudWatch can be a great start for monitoring your AWS environments, you also learned that it has some limitations in terms of granularity, predictive analysis, customization, alerting, and integration with third-party tools.
To address these shortcomings, you learned about some of the key features of a tool called Kentik Cloud. Kentik’s cloud observability solution offers powerful visualizations, real-time monitoring, and built-in synthetic testing capabilities to provide a comprehensive view of network performance across all your cloud providers, not just AWS. By embracing Kentik Cloud, your business can get ahead of networking issues before they reach your end users and ultimately make informed, data-driven decisions about your network applications.
Try Kentik Cloud for yourself today: Start a free trial or request a personalized demo to learn more about how to improve AWS performance with Kentik.

