Enterprise WAN Optimization
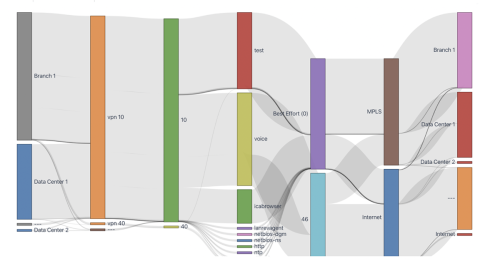
Optimize routing, security, and operations for today’s cloud-centric enterprise WAN.
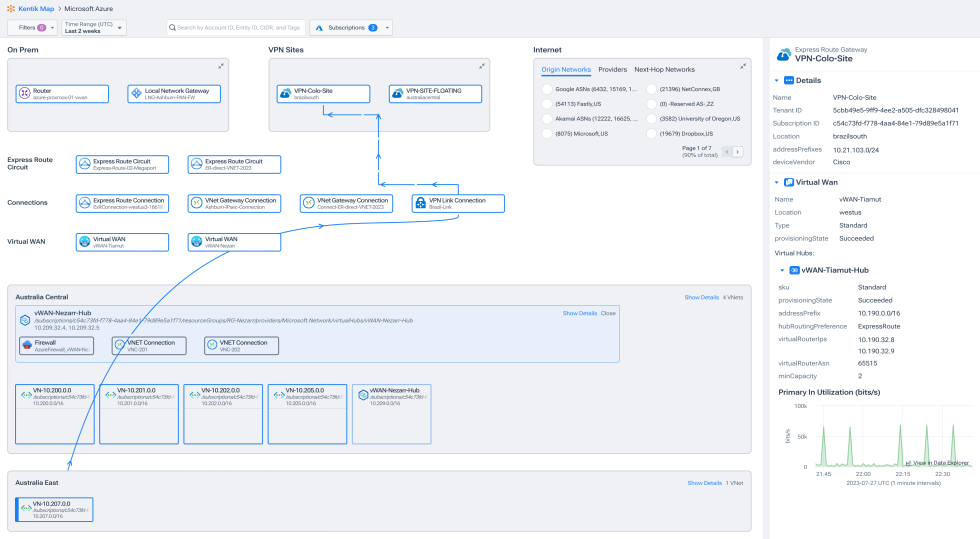
See your entire network in one view — from internet underlay to SD-WAN overlay to edge.
Interrogate connectivity between users, SaaS, cloud-based apps and network services, and the public internet.
Optimize user experience and application delivery with global connectivity and performance testing.
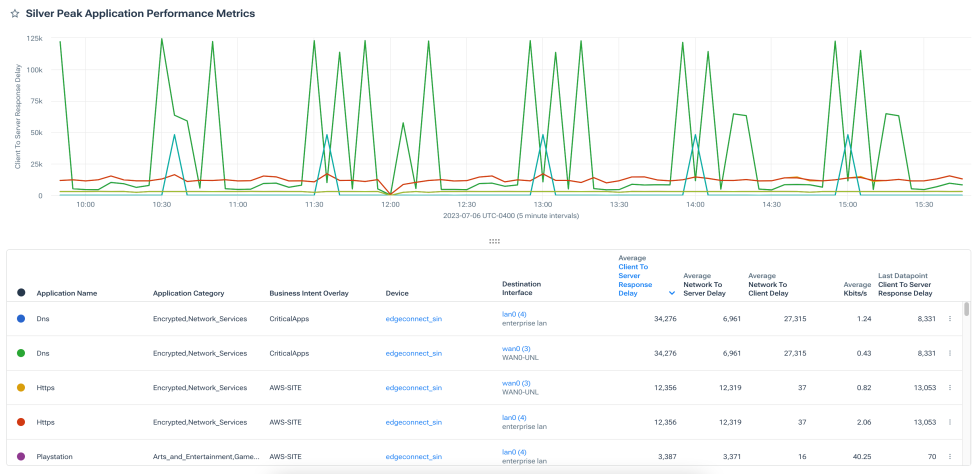
Quickly answer any network performance question
- When performance dips, easily query, visualize, and correlate diverse data from cloud, campus, and SD-WAN networks.
- Quickly diagnose spotty connectivity and slow response times with insight into underlay and overlay interaction.
- Understand application performance first-hand with synthetic tests.
Optimize application delivery with public internet insight
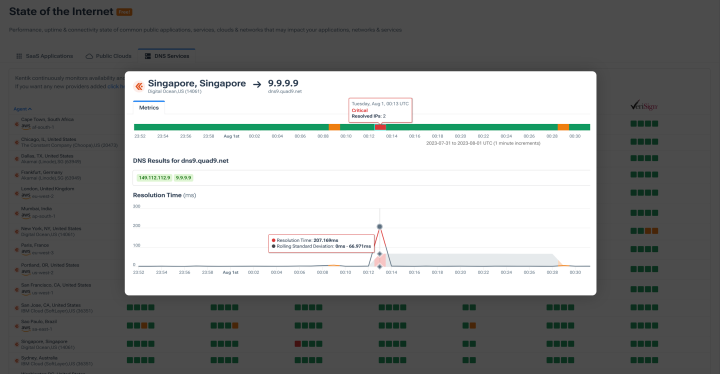
- Understand how global internet weather impacts your applications.
- Alert on connectivity to critical public resources such as public DNS servers and SaaS providers.
- See beyond simple up/down metrics by testing for latency, jitter, and path changes in external service connections.
Catch user experience issues before customers do
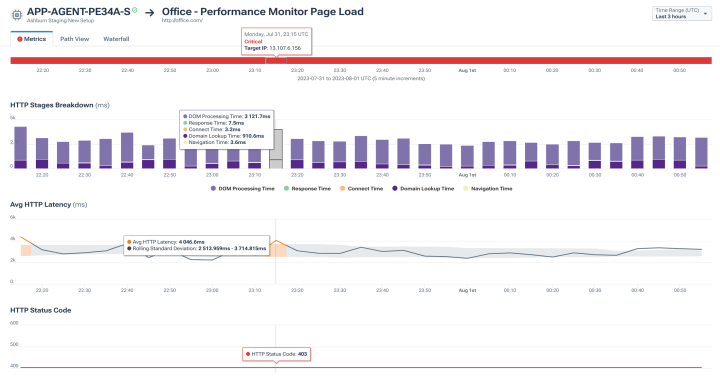
- Proactively monitor end-user experience with test agents that simulate user interactions with your critical applications.
- Gather specific quality-of-service telemetry along with page load and transaction processing times to optimize each step in a digital transaction.
Secure your data with commercial-grade tools
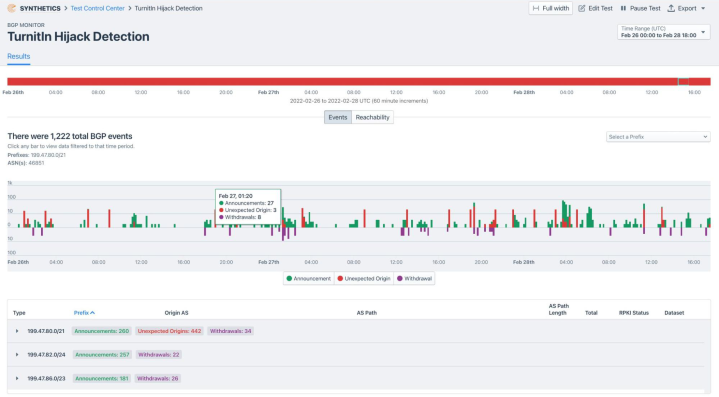
- Protect against malware, phishing, DDoS, and APT threats with fine-grained alerts.
- Validate SD-WAN policy to keep traffic links secure and compliant.
- Keep routes safe from leaks with RKPI validation and analysis.
- Monitor upstream providers to alert on BGP route hijacks.
Tune the networks you own, and the networks you don’t
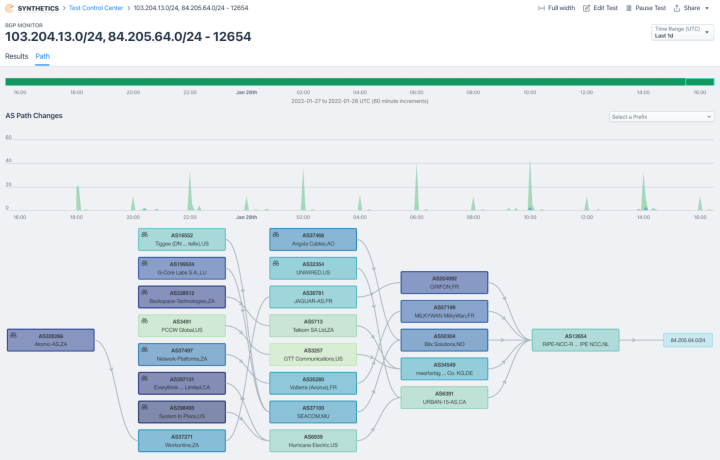
- Negotiate powerfully and minimize downstream impact with expert visibility into service provider performance and the internet.
- Get best-in-class routing and peering insights, and quickly understand if BGP connectivity is impacting performance.
- Use CDN Analytics to ensure and enforce CDN performance.

“The visibility of being able to see your entire network and all of the trends happening across every device in your entire network, all at once, is huge.”
Explore the platform
Enterprise WAN Optimization FAQs
How do I monitor WAN acceleration and caching effectiveness?
Add network- and app-facing performance baselines (latency, throughput, loss) and compare before/after acceleration, then validate results continuously. Kentik helps by combining flow analytics, topology context, and synthetic tests so you can quantify traffic and path changes (often a proxy for caching effectiveness) and quickly identify when routing, congestion, or policy shifts erase acceleration gains.
How can I monitor performance for zero-trust network access solutions?
Monitor ZTNA performance by continuously measuring paths from your user regions/branches to ZTNA or SASE gateways and correlating degradations with routing and traffic changes. Use synthetic tests from private agents (branch/VPN edge/cloud) and global agents to validate reachability, latency, loss, and jitter, then drill into path context to determine whether the issue is local, upstream, or provider-side.
What strategies help optimize SaaS breakout at branch locations?
Optimize SaaS breakout by measuring user experience by branch, comparing DIA breakout vs backhaul paths, and validating policy intent before rollout. Kentik helps by correlating SD-WAN/WAN traffic with internet and SaaS performance signals, so you can identify which breakout strategy performs best per region and keep alerts running to catch degradations early.
What is the best way to monitor SASE connectivity and performance?
Monitor SASE with Kentik by continuously measuring path health (latency, loss, jitter, reachability) from branches and regions to SASE points of presence, then correlating performance changes with traffic and routing shifts. Use private agents for inside-out testing from your real user egress points and global agents for outside-in baselines, and alert when performance degrades to isolate ISP vs SASE-provider issues fast.
How do I monitor performance for remote workforces and home networks?
You can’t instrument every home Wi-Fi router, but you can monitor the shared control points remote users depend on, such as VPN gateways, SD-WAN edges, and cloud entry points. Combine device health plus flow visibility with synthetics from those edges to SaaS and ISP regions to identify whether problems are in your infrastructure, the user’s ISP path, or the SaaS destination path.
What’s the best way to validate WAN optimization impact?
Validate WAN optimization by measuring before-and-after latency, loss, throughput, retransmits, and application responsiveness for the same sites and paths, and confirm that improvements persist under peak load and failover scenarios. Kentik supports this by combining WAN visibility with synthetic testing and traffic analytics so teams can quantify impact, isolate where optimization helped, and catch regressions when paths, policies, or providers change.
What tools help compare internet paths across different providers?
Compare providers in Kentik by running the same synthetic latency/loss/jitter tests and traceroute-based path checks to the same destinations, then reviewing path shifts and performance deltas side-by-side. Correlate synthetic results with traffic so you can see which sites, users, and applications are actually impacted when one provider degrades.


